DXY Bullish move 99.00 (Readmore)...💹 #DXY Analysis (1H Timeframe) 💹
🟢 Bullish Momentum Building Up!
Price showing strong buying pressure from the key support zone at 99.00 📈
🎯 Technical Targets:
1️⃣ 99.300 – First target
2️⃣ 99.500 – Second target
📊 As long as price holds above 99.00, bullish bias remains intact.
#DXY #USDI
About U.S. Dollar Index
The U.S. Dollar Index tracks the strength of the dollar against a basket of major currencies. DXY was originally developed by the U.S. Federal Reserve in 1973 to provide an external bilateral trade-weighted average value of the U.S. dollar against global currencies. U.S. Dollar Index goes up when the U.S. dollar gains "strength" (value), compared to other currencies. The following six currencies are used to calculate the index:
Euro (EUR) 57.6% weight
Japanese yen (JPY) 13.6% weight
Pound sterling (GBP) 11.9% weight
Canadian dollar (CAD) 9.1% weight
Swedish krona (SEK) 4.2% weight
Swiss franc (CHF) 3.6% weight
Euro (EUR) 57.6% weight
Japanese yen (JPY) 13.6% weight
Pound sterling (GBP) 11.9% weight
Canadian dollar (CAD) 9.1% weight
Swedish krona (SEK) 4.2% weight
Swiss franc (CHF) 3.6% weight
Related indices

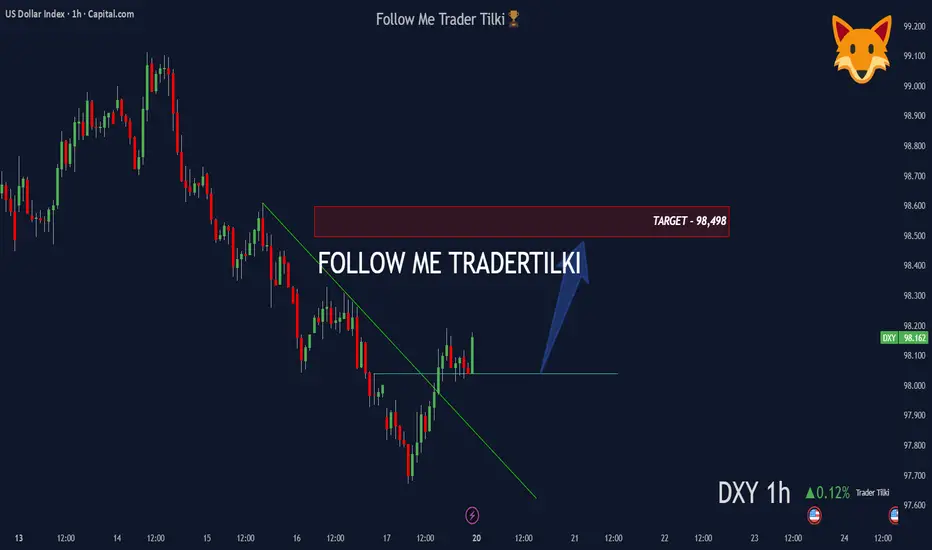
DXY 1H Analysis: Trendline Break with Rising Volume 📊 DXY – 1 Hour Analysis
Technical Outlook:
The trendline has been broken and rising volumes are drawing attention.
Based on this setup, my target level is: 98,498 🎯
Fundamental Analysis:
Recently, a White House economist stated that “we are not in any kind of economic war with China,” wh
DXY Double Top Rejection Still At PlayThe M formation I spoke about a week ago is still at play, and the gap I anticipated will get filled is still wide open.
I am bearish on DXY until confirmations to go bullish contradict my bias.

DXY: Bullish Setup Brewing at Key Weekly Support!The US Dollar Index (DXY) is showing a compelling setup on the weekly timeframe! 📈 The price has reached a critical support zone between 99.120 and 94.802. This level also aligns with the lower boundary of a descending channel, adding confluence to this high-probability zone.
🔍 Key Technical Observ
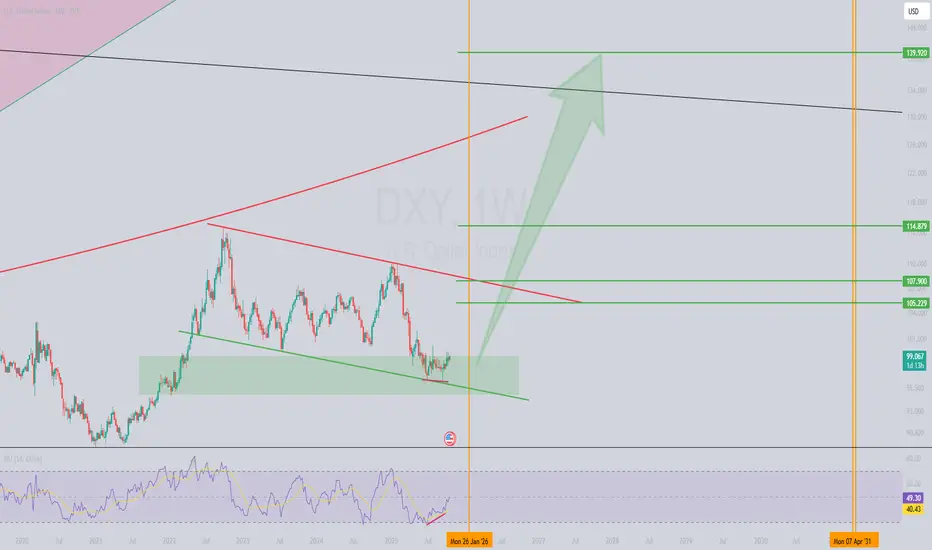
DXY - will we see a bullish divergence?Hello, dear traders. We can observe an interesting situation on the Dollar Index.
What we see:
1. An uptrend on the weekly timeframe.
2. The price is at the support level.
3. Over the 18 years of this trend, all impulses from the support level originated after MACD divergence. For divergence, we

DXY-POSSIBLE LONG [SWING]BULLISH MONTHLY RESEPECT CANDLES.
Daily Orderflow
Daily context Area
LTF entry preferably H1
TARGET buyside of the trend
APPLY RISK MANAGEMENT

DXY Trade Plan 22/10/2025Dear Traders,
The 99–99.200 zone is a very important area for the Dollar Index. Based on this, if the price breaks above this zone, we will enter sell positions on USD pairs. However, if a bearish candle appears, we will enter buy positions for a 80–100 pip move.
Regards,
Alireza!

US Dollar: Bullish-Neutral. Buys Are Valid As +FVG Holds!Welcome back to the Weekly Forex Forecast for the week of Oct 27 - 31st.
In this video, we will analyze the following FX market: USD Dollar
The USD didn't move a lot last week, but it did move higher with Monday and Tuesday moves. The rest of the week was sideways, but it held above the +FVG. A

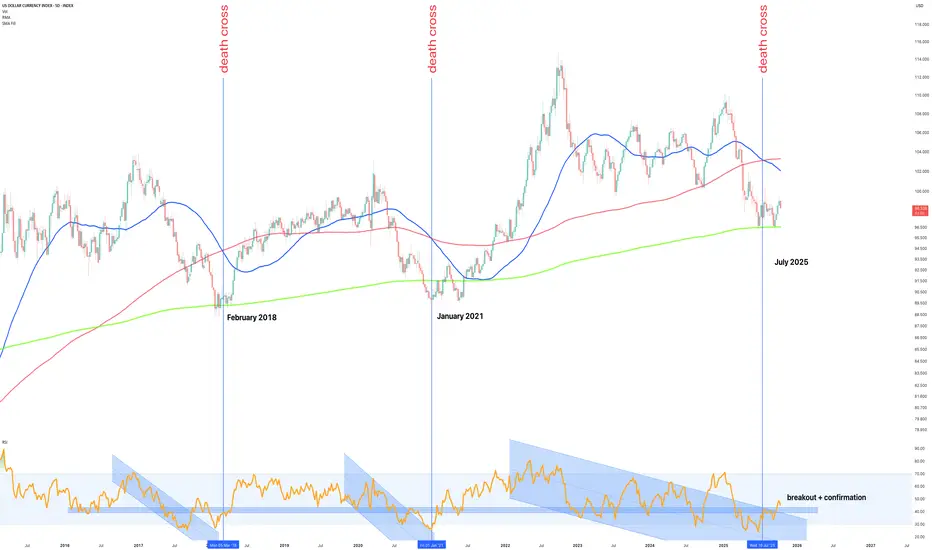
The Dollar Death Cross that marks the beginning – October 2025The term death cross often sends shivers through markets, but in the case of the US Dollar Index (DXY), it’s proven to be quite the opposite.
History tells us that every major death cross on the 5-day chart where the short-term 50 day simple moving average (SMA) crosses below the 200 day long ter
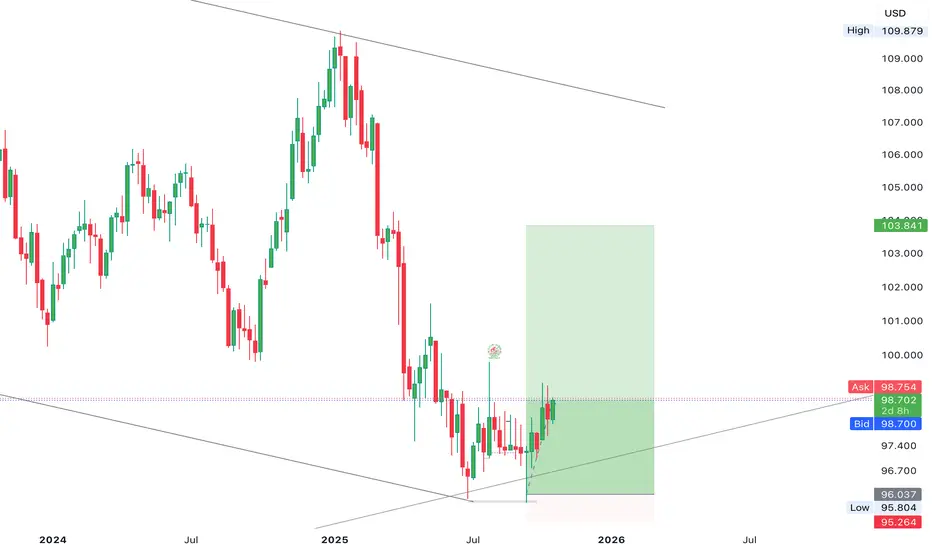
The DXY continues to establish a solid base for bullish recoveryThe DXY continues to establish a solid base for bullish recovery around the 98.000 level, aiming to mitigate toward the 103.000 region. This development highlights a potential shift in market momentum as dollar strength begins to rebuild. follow for more insights ,comment and boost idea
See all ideas
Summarizing what the indicators are suggesting.
Oscillators
Neutral
SellBuy
Strong sellStrong buy
Strong sellSellNeutralBuyStrong buy
Oscillators
Neutral
SellBuy
Strong sellStrong buy
Strong sellSellNeutralBuyStrong buy
Summary
Neutral
SellBuy
Strong sellStrong buy
Strong sellSellNeutralBuyStrong buy
Summary
Neutral
SellBuy
Strong sellStrong buy
Strong sellSellNeutralBuyStrong buy
Summary
Neutral
SellBuy
Strong sellStrong buy
Strong sellSellNeutralBuyStrong buy
Moving Averages
Neutral
SellBuy
Strong sellStrong buy
Strong sellSellNeutralBuyStrong buy
Moving Averages
Neutral
SellBuy
Strong sellStrong buy
Strong sellSellNeutralBuyStrong buy
Displays a symbol's price movements over previous years to identify recurring trends.
Frequently Asked Questions
The current value of U.S. Dollar Index is 98.637 USD — it has fallen by −0.17% in the past 24 hours. Track the index more closely on the U.S. Dollar Index chart.
U.S. Dollar Index reached its highest quote on Feb 25, 1985 — 164.720 USD. See more data on the U.S. Dollar Index chart.
The lowest ever quote of U.S. Dollar Index is 70.698 USD. It was reached on Mar 17, 2008. See more data on the U.S. Dollar Index chart.
U.S. Dollar Index value has increased by 0.10% in the past week, since last month it has shown a 0.28% increase, and over the year it's decreased by −5.44%. Keep track of all changes on the U.S. Dollar Index chart.
U.S. Dollar Index is just a number that lets you track performance of the instruments comprising the index, so you can't invest in it directly. But you can buy U.S. Dollar Index futures or funds or invest in its components.