DXY is making perhaps the final pull-back before a massive rallyThe U.S. Dollar index (DXY) has been trading within a Channel Up since the March 2008 bottom during the U.S. Housing Crisis. This is not the first time we use this pattern to identify key macro trend shifts, in fact we revisited it a little over 2 months ago.
The incredible symmetry it's been show
About U.S. Dollar Index
The U.S. Dollar Index tracks the strength of the dollar against a basket of major currencies. DXY was originally developed by the U.S. Federal Reserve in 1973 to provide an external bilateral trade-weighted average value of the U.S. dollar against global currencies. U.S. Dollar Index goes up when the U.S. dollar gains "strength" (value), compared to other currencies. The following six currencies are used to calculate the index:
Euro (EUR) 57.6% weight
Japanese yen (JPY) 13.6% weight
Pound sterling (GBP) 11.9% weight
Canadian dollar (CAD) 9.1% weight
Swedish krona (SEK) 4.2% weight
Swiss franc (CHF) 3.6% weight
Euro (EUR) 57.6% weight
Japanese yen (JPY) 13.6% weight
Pound sterling (GBP) 11.9% weight
Canadian dollar (CAD) 9.1% weight
Swedish krona (SEK) 4.2% weight
Swiss franc (CHF) 3.6% weight
Related indices

04.12.25 Daily ForecastPairs on Watch -
FX:EURUSD
FX:GBPUSD
A short overview of the instruments I am looking at for today, multi-timeframe analysis down to what I will be looking at for an entry. Enjoy!

05.12.25 Daily ForecastPairs on Watch -
FX:EURUSD
FX:AUDUSD
A short overview of the instruments I am looking at for today, multi-timeframe analysis down to what I will be looking at for an entry. Enjoy!

DXY BULLISH SETUPAfter a complete 5 wave bearish move, the dxy bounced in a leading diagonal pattern which signifies a wave A. Now wave B is still in formation and we patiently waiting for a pivot around 50%fib into wave C , which should last a few months

DXY - long, first RADXY - long, first RA , is a simple trade, will take some days, use riskk and trade managment for best result

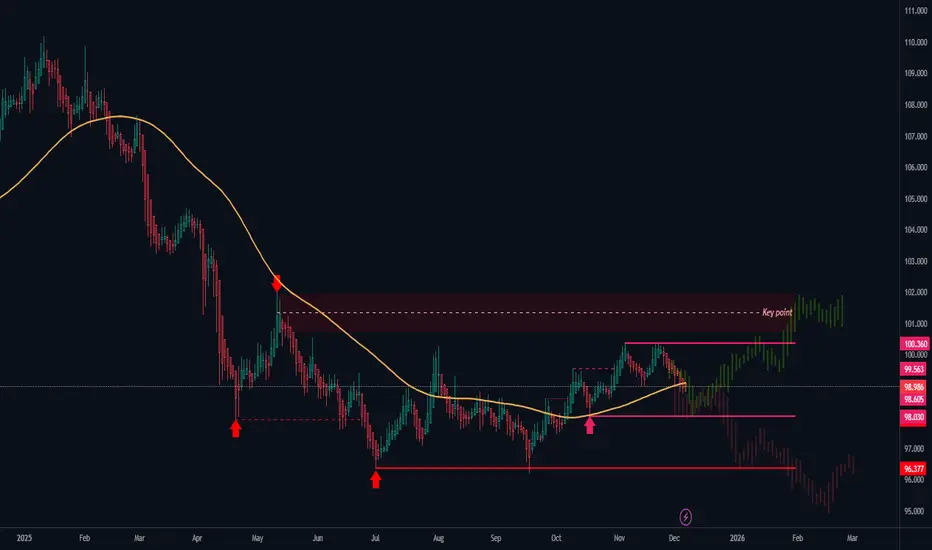
US DOLLAR INDEX - Key Breakout or Just a Relief Pump?INDEX:DXY
Not gonna lie, this chart looks like the dollar is walking on thin ice right now. Price just slipped under that 50 EMA after failing to pierce their high at 100.360
We've still got that solid support parked near 98.030 and if that gives way we will keep pointing straight down to the 96
$DXY Weakness To End The Year!to remain weak this month. We could see that santa rally in most markets. A/U, E/U, G/U pairs are some of my favorites. Gold & Silver to keep pushing higher to end the year.

DXY I Monthly CLS range - Model 1- TP discount LQHi friends, new range created. As always we are looking for the manipulation in to the key level around the range. Don't forget confirmation switch from manipulation phase to the distribution phase to make the setup valid. Stay patient and enter only after change in order flow. If price reaches 50%

Dollar Index Has Fallen to Its Lowest Level in Almost 1.5 MonthsThe Dollar Index Has Fallen to Its Lowest Level in Almost 1.5 Months
The key event of the week will take place on 10 December – at 22:00 GMT+3 the FOMC will publish its interest rate decision, followed half an hour later by a press conference with Jerome Powell.
As the chart of the dollar index (

Major Volatility Incoming – The Most Important News of 2025**“Tomorrow’s U.S. interest rate decision is one of the most critical events of 2025, with the potential to shape market direction across all major asset classes. The Federal Reserve’s stance on rates will directly influence liquidity, risk sentiment, and overall market volatility.
A higher-than-ex

See all ideas
Summarizing what the indicators are suggesting.
Oscillators
Neutral
SellBuy
Strong sellStrong buy
Strong sellSellNeutralBuyStrong buy
Oscillators
Neutral
SellBuy
Strong sellStrong buy
Strong sellSellNeutralBuyStrong buy
Summary
Neutral
SellBuy
Strong sellStrong buy
Strong sellSellNeutralBuyStrong buy
Summary
Neutral
SellBuy
Strong sellStrong buy
Strong sellSellNeutralBuyStrong buy
Summary
Neutral
SellBuy
Strong sellStrong buy
Strong sellSellNeutralBuyStrong buy
Moving Averages
Neutral
SellBuy
Strong sellStrong buy
Strong sellSellNeutralBuyStrong buy
Moving Averages
Neutral
SellBuy
Strong sellStrong buy
Strong sellSellNeutralBuyStrong buy
Displays a symbol's price movements over previous years to identify recurring trends.
Frequently Asked Questions
The current value of U.S. Dollar Index is 98.958 USD — it has fallen by −0.08% in the past 24 hours. Track the index more closely on the U.S. Dollar Index chart.
U.S. Dollar Index reached its highest quote on Feb 25, 1985 — 164.720 USD. See more data on the U.S. Dollar Index chart.
The lowest ever quote of U.S. Dollar Index is 70.698 USD. It was reached on Mar 17, 2008. See more data on the U.S. Dollar Index chart.
U.S. Dollar Index value has decreased by −0.12% in the past week, since last month it has shown a −0.46% decrease, and over the year it's decreased by −6.80%. Keep track of all changes on the U.S. Dollar Index chart.
U.S. Dollar Index is just a number that lets you track performance of the instruments comprising the index, so you can't invest in it directly. But you can buy U.S. Dollar Index futures or funds or invest in its components.