Dollar Index Pulls Back from a Key HighDollar Index Pulls Back from a Key High
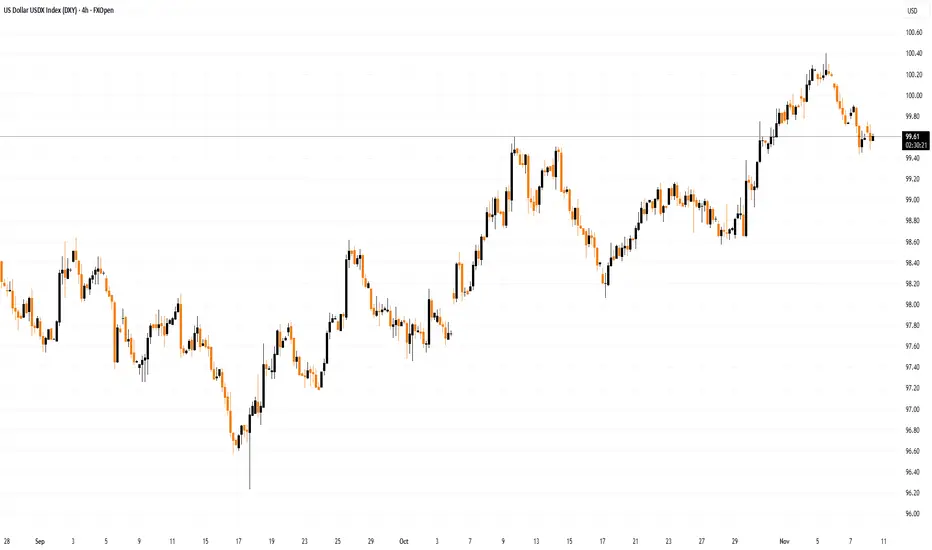
As the Dollar Index (DXY) chart shows, the index is currently trading below its 5 November high, which formed after a false bullish breakout (marked by an arrow) above the 1 August peak — a scenario previously outlined in the post “The Dollar Index Near a Ke
About U.S. Dollar Index
The U.S. Dollar Index tracks the strength of the dollar against a basket of major currencies. DXY was originally developed by the U.S. Federal Reserve in 1973 to provide an external bilateral trade-weighted average value of the U.S. dollar against global currencies. U.S. Dollar Index goes up when the U.S. dollar gains "strength" (value), compared to other currencies. The following six currencies are used to calculate the index:
Euro (EUR) 57.6% weight
Japanese yen (JPY) 13.6% weight
Pound sterling (GBP) 11.9% weight
Canadian dollar (CAD) 9.1% weight
Swedish krona (SEK) 4.2% weight
Swiss franc (CHF) 3.6% weight
Euro (EUR) 57.6% weight
Japanese yen (JPY) 13.6% weight
Pound sterling (GBP) 11.9% weight
Canadian dollar (CAD) 9.1% weight
Swedish krona (SEK) 4.2% weight
Swiss franc (CHF) 3.6% weight
Related indices
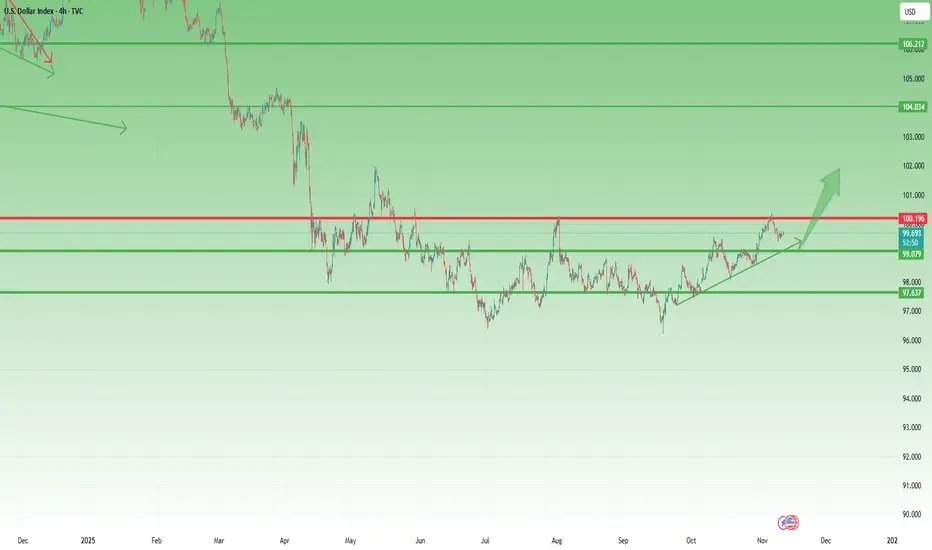
US DOLLAR INDEX (DXY): Bullish Movement Confirmed?!Following a recent bearish movement, the 📈DXY has corrected to a previously breached key structural level.
I have identified two significant bullish confirmations after this test: the price has violated the neckline of a double bottom pattern and the resistance line of a falling parallel channel pa

US Dollar: Look For Buys As The Pullback Ends!Welcome back to the Weekly Forex Forecast for the week of Nov. 17 - 21st.
In this video, we will analyze the following FX market: USD Dollar
The USD was in retracement last week. It looks like that may be ending, and a new bullish leg could potential start early this week.
Wait patiently for the

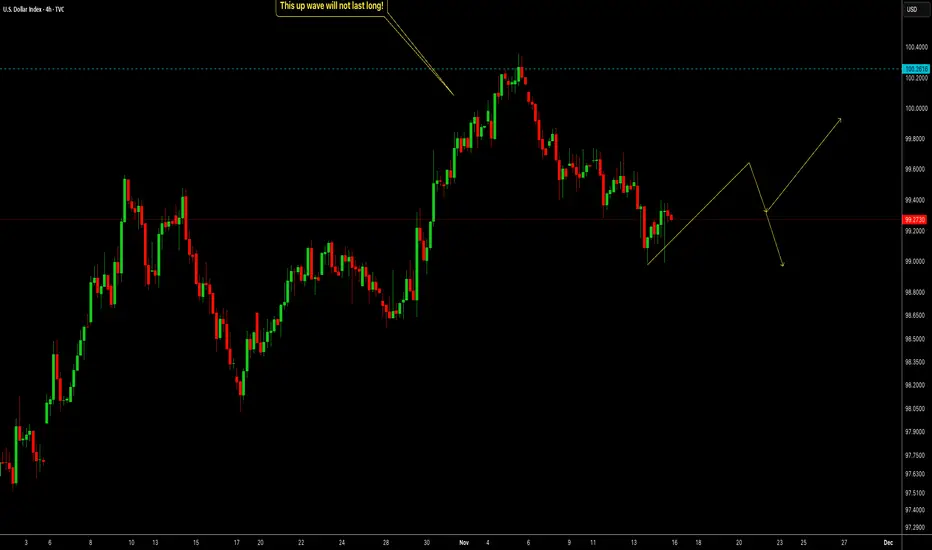
DXY - Short-Term Bounce, But the Bigger Drop Isn’t Done YetThe Dollar Index is forming a small corrective up-move on the 4H chart. This current rise still looks weak and is unlikely to last long. As long as price stays below the major zones above, the broader structure suggests one more push lower before any meaningful bullish reversal.
Short-term volatili
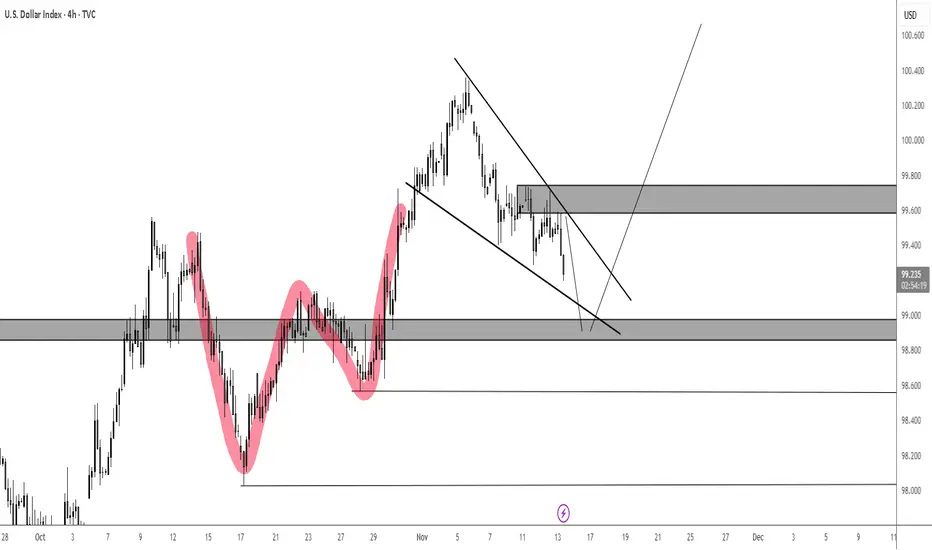
DXY W Formation and Falling WedgeI anticipate a bounce soon, but, as indicated, a false breakout to the downside of that falling wedge to trap early buyers is highly likely.
Patience is key.
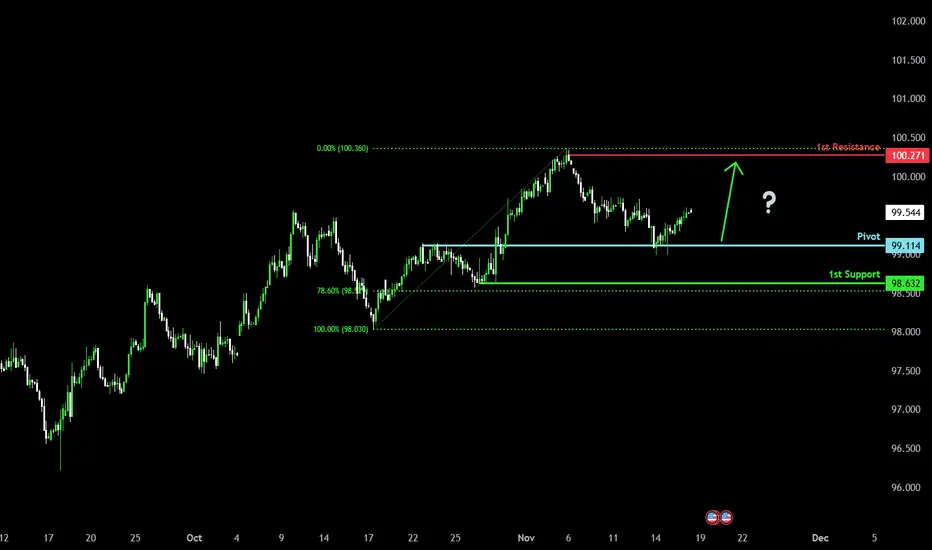
Bullish momentum to extend?US Dollar Index (DXY) has bounced off the pivot, which is a pullback support, and could potentially rise to the 1st resistance.
Pivot: 99.11
1st Support: 98.63
1st Resistance: 100.27
Disclaimer:
The opinions given above constitute general market commentary and do not constitute the opinion or ad
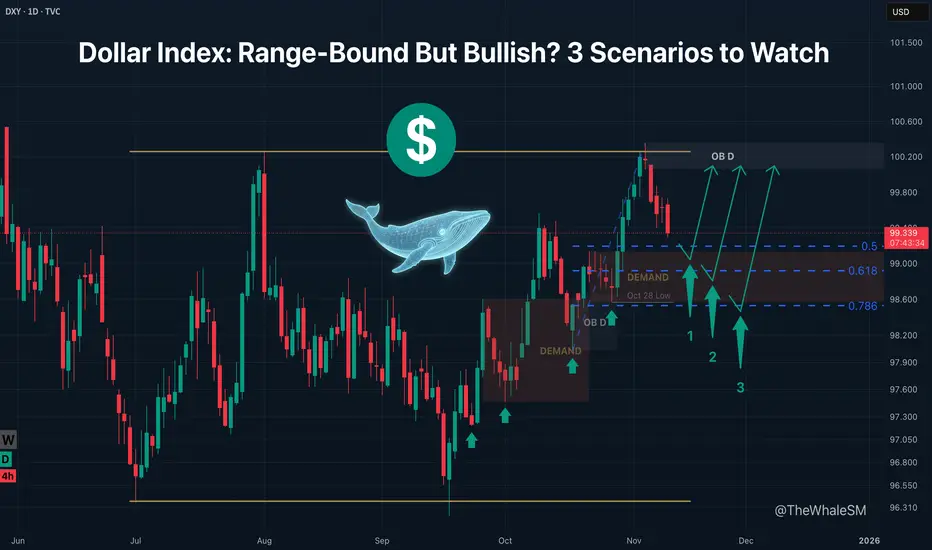
Dollar Index: Range-Bound But Bullish? 3 Scenarios to WatchThe Dollar Index ( TVC:DXY ) is in a global range, within which there is a bullish daily order flow. This flow is manifesting as a sequential mitigation of, and reversal from, imbalances and manipulation zones.
On November 5th, a deviation above the global range occurred, sweeping external liquid
DXY key levels to look out for this week (WC 17/11)DXY key levels for the following week ahead.
Key fundamentals this week includes FOMC meeting minutes on Wednesday, NFP change along with unemployment rate on Thursday and to finish the week off on Friday- Manufacturing & Services PMI release on Friday.

DXY Pulls Back from 100 – A Healthy Correction, Not a Reversal1. What Happened Since Last Week
In last week’s DXY analysis, I warned that although the U.S. Dollar Index remains in a broader uptrend, the 100.00 level represents both a strong technical and psychological resistance that could trigger a short-term retracement.
That scenario played out almost per
Bullish bounce off?US Dollar Index (DXY) is falling towards the pivot and could bounce to the 1st resistance resistance.
Pivot: 99.78
1st Support: 99.34
1st Resistance: 100.71
Disclaimer:
The opinions given above constitute general market commentary and do not constitute the opinion or advice of IC Markets or any

See all ideas
Summarizing what the indicators are suggesting.
Oscillators
Neutral
SellBuy
Strong sellStrong buy
Strong sellSellNeutralBuyStrong buy
Oscillators
Neutral
SellBuy
Strong sellStrong buy
Strong sellSellNeutralBuyStrong buy
Summary
Neutral
SellBuy
Strong sellStrong buy
Strong sellSellNeutralBuyStrong buy
Summary
Neutral
SellBuy
Strong sellStrong buy
Strong sellSellNeutralBuyStrong buy
Summary
Neutral
SellBuy
Strong sellStrong buy
Strong sellSellNeutralBuyStrong buy
Moving Averages
Neutral
SellBuy
Strong sellStrong buy
Strong sellSellNeutralBuyStrong buy
Moving Averages
Neutral
SellBuy
Strong sellStrong buy
Strong sellSellNeutralBuyStrong buy
Displays a symbol's price movements over previous years to identify recurring trends.
Frequently Asked Questions
The current value of U.S. Dollar Index is 100.221 USD — it has risen by 0.19% in the past 24 hours. Track the index more closely on the U.S. Dollar Index chart.
U.S. Dollar Index reached its highest quote on Feb 25, 1985 — 164.720 USD. See more data on the U.S. Dollar Index chart.
The lowest ever quote of U.S. Dollar Index is 70.698 USD. It was reached on Mar 17, 2008. See more data on the U.S. Dollar Index chart.
U.S. Dollar Index value has increased by 0.79% in the past week, since last month it has shown a 1.71% increase, and over the year it's decreased by −5.56%. Keep track of all changes on the U.S. Dollar Index chart.
U.S. Dollar Index is just a number that lets you track performance of the instruments comprising the index, so you can't invest in it directly. But you can buy U.S. Dollar Index futures or funds or invest in its components.