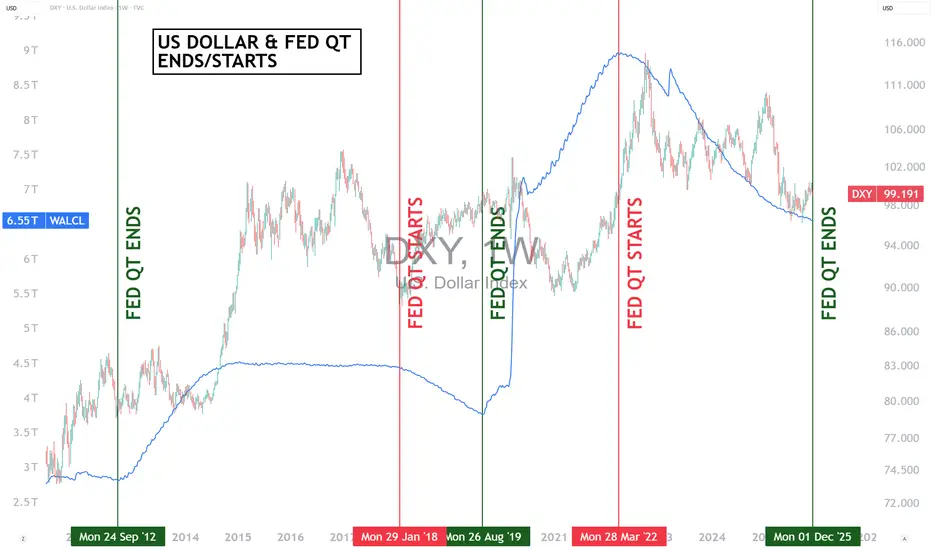
End of the Fed’s QT: What Impact on the US Dollar?Since Monday, December 1, 2025, the quantitative tightening (QT) program initiated in 2022 has been halted. The evolution of the Federal Reserve’s balance sheet has always had a major impact on financial assets, particularly in the FX market. Through which mechanisms? And what impact should we expect on FX and the US dollar?
Since Monday, December 1, 2025, the US Federal Reserve (Fed) has officially ended the quantitative tightening cycle initiated in 2022. This decision marks an important turning point in US monetary policy: the balance sheet contraction— which had tightened financial conditions for more than three years—has now come to an end. Historically, changes in the Fed’s balance sheet exert a significant influence on financial markets, particularly on the US dollar index (DXY). However, the end of QT does not carry the same meaning as the start of a quantitative easing (QE) program.
Stopping balance sheet reduction means the Fed no longer withdraws liquidity from the financial system. In theory, this is neutral to slightly bearish for the dollar. With less pressure on real interest rates, the relative attractiveness of the dollar diminishes, especially against currencies with higher carry. Historically, in periods when QT ended—such as in 2012 or 2019—the dollar tended to weaken gradually. Simply stabilizing the balance sheet slightly loosens financial conditions, encouraging a rotation toward riskier or higher-yielding assets outside the US.
However, it is essential to emphasize a point that is often misunderstood: the end of QT is absolutely not equivalent to the beginning of QE. In QE, the Fed purchases large quantities of bonds, injecting significant and continuous liquidity into the economy. These purchases put direct downward pressure on long-term yields and weaken the dollar more clearly. Conversely, when QT stops, the Fed essentially does nothing: it no longer withdraws liquidity, but it does not add any either. The balance sheet stabilizes—sometimes with slight fluctuations—but it does not automatically expand again.
The distinction is therefore crucial:
• End of QT = stabilization, moderate impact, often neutral to slightly bearish for the USD.
• Start of QE = balance-sheet expansion, clearly bearish impact as the supply of dollars increases.
In summary, the end of QT in December 2025 may contribute to a slightly less supportive environment for the dollar, but its impact remains limited in the absence of signals pointing to a real shift toward QE. The next few months will therefore depend more on policy rates, inflation trends, and monetary-policy expectations than on the QT halt alone.
DISCLAIMER:
This content is intended for individuals who are familiar with financial markets and instruments and is for information purposes only. The presented idea (including market commentary, market data and observations) is not a work product of any research department of Swissquote or its affiliates. This material is intended to highlight market action and does not constitute investment, legal or tax advice. If you are a retail investor or lack experience in trading complex financial products, it is advisable to seek professional advice from licensed advisor before making any financial decisions.
This content is not intended to manipulate the market or encourage any specific financial behavior.
Swissquote makes no representation or warranty as to the quality, completeness, accuracy, comprehensiveness or non-infringement of such content. The views expressed are those of the consultant and are provided for educational purposes only. Any information provided relating to a product or market should not be construed as recommending an investment strategy or transaction. Past performance is not a guarantee of future results.
Swissquote and its employees and representatives shall in no event be held liable for any damages or losses arising directly or indirectly from decisions made on the basis of this content.
The use of any third-party brands or trademarks is for information only and does not imply endorsement by Swissquote, or that the trademark owner has authorised Swissquote to promote its products or services.
Swissquote is the marketing brand for the activities of Swissquote Bank Ltd (Switzerland) regulated by FINMA, Swissquote Capital Markets Limited regulated by CySEC (Cyprus), Swissquote Bank Europe SA (Luxembourg) regulated by the CSSF, Swissquote Ltd (UK) regulated by the FCA, Swissquote Financial Services (Malta) Ltd regulated by the Malta Financial Services Authority, Swissquote MEA Ltd. (UAE) regulated by the Dubai Financial Services Authority, Swissquote Pte Ltd (Singapore) regulated by the Monetary Authority of Singapore, Swissquote Asia Limited (Hong Kong) licensed by the Hong Kong Securities and Futures Commission (SFC) and Swissquote South Africa (Pty) Ltd supervised by the FSCA.
Products and services of Swissquote are only intended for those permitted to receive them under local law.
All investments carry a degree of risk. The risk of loss in trading or holding financial instruments can be substantial. The value of financial instruments, including but not limited to stocks, bonds, cryptocurrencies, and other assets, can fluctuate both upwards and downwards. There is a significant risk of financial loss when buying, selling, holding, staking, or investing in these instruments. SQBE makes no recommendations regarding any specific investment, transaction, or the use of any particular investment strategy.
CFDs are complex instruments and come with a high risk of losing money rapidly due to leverage. The vast majority of retail client accounts suffer capital losses when trading in CFDs. You should consider whether you understand how CFDs work and whether you can afford to take the high risk of losing your money.
Digital Assets are unregulated in most countries and consumer protection rules may not apply. As highly volatile speculative investments, Digital Assets are not suitable for investors without a high-risk tolerance. Make sure you understand each Digital Asset before you trade.
Cryptocurrencies are not considered legal tender in some jurisdictions and are subject to regulatory uncertainties.
The use of Internet-based systems can involve high risks, including, but not limited to, fraud, cyber-attacks, network and communication failures, as well as identity theft and phishing attacks related to crypto-assets.
Trade ideas
DXY FRGNT Daily Forecast -Q4 | W47| D20 | Y25 |📅 Q4 | W47| D20 | Y25 |
📊 DXY FRGNT Daily Forecast
🔍 Analysis Approach:
I’m applying Smart Money Concepts, focusing on:
Identifying Points of Interest on the Higher Time Frames (HTFs) 🕰️
Using those POIs to define a clear trading range 📐
Refining those zones on Lower Time Frames (LTFs) 🔎
Waiting for a Break of Structure (BoS) for confirmation ✅
This method allows me to stay precise, disciplined, and aligned with the market narrative, rather than chasing price.
💡 My Motto:
"Capital management, discipline, and consistency in your trading edge."
A positive risk-to-reward ratio, paired with a high win rate, is the backbone of any solid trading plan 📈🔐
⚠️ Losses?
They’re part of the mathematical game of trading 🎲
They don’t define you — they’re necessary, they happen, and we move forward 📊➡️
🙏 I appreciate you taking the time to review my Daily Forecast.
Stay sharp, stay consistent, and protect your capital
— FRNGT 🚀
TVC:DXY

Dollar Breaks The Wedge Support As SP500 Eyeing More UpsideHey guy, hope everyone is doing well.
As you know, we have seen some minor pullback on stocks yesterday as JPY come up a bit, after some hawkish remarks from BOJ Ueda. And at the same time cryptocurrencies also experienced a pretty sharp sell-off. But I believe these are all just temporary flows at the start of a new week and month. Position adjustments will still happen, and possibly after some pause on stocks we will resume higher, meaning that the dollar could stay in this weak mode, especially since the DXY ame out of a wedge pattern and now signals more downside. In such case, this previously broken trendline could be retested as a resistance around 99.65–99.85, tomorrow or in the second half of this week I would expect more dollar weakness.
GH

The DXY has room to reboundThe DXY has room to rebound from the 98.848 level after the decline in new unemployment claims.
A stronger labor reading signals fewer layoffs and a resilient U.S. economy, reducing the likelihood of near-term Fed rate cuts.
Sticky rate expectations and stronger yield support typically lift the dollar, giving the DXY a bullish bias from current levels.

NOV.30,2025 ANALYSIS ON THE DOLLAR INDEX (DXY)DXY is at crossroads with a monthly indecision Candlestick. Glass ceiling tops of 99.978 is still hanging, However the week still closed with a higher low defended on the 200EMA on the 4H timeframe with a bullish kicker reversal two candle pattern. Considering the weekly candle close, there is real risks to the downside, My 21 period RSI is below 50 on 4H confirms real downside risk too . My bias on the dollar index is still to the upside but however if you trade the long side apply tight stop loss using the 200EMA on 4H or the 35EMA on daily chart as the decision yard. If price loses these EMAs then short side is confirmed for 97.148 target. There is also a hidden bullish divergence on the daily and weekly chart so upside potential is equally weighted to the downside double tops target. Therefore prepared for both scenarios this coming week.
Thank you for supporting my publications with your boosts and comments. Best of forex trading everybody. Cheers

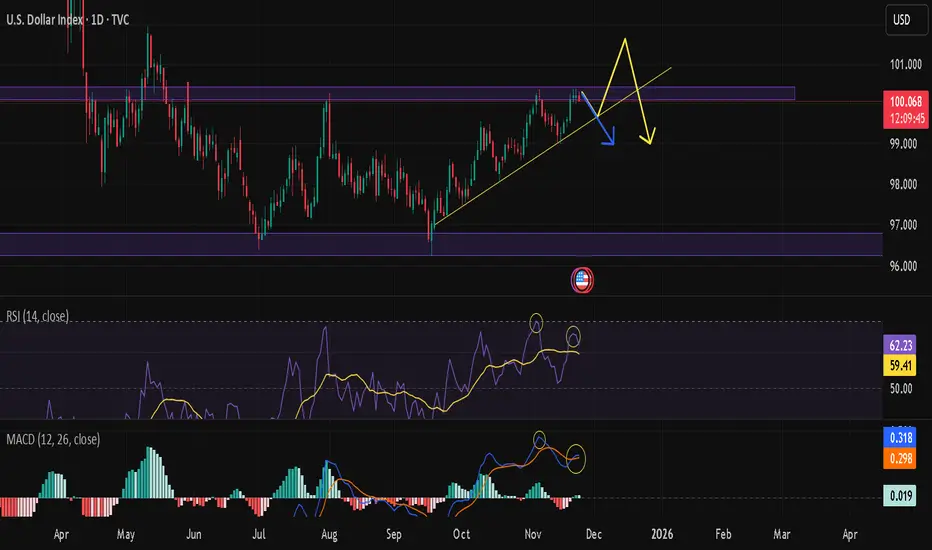
DXY at a KEY “Decision Point” on the Supply ZoneAfter an extended bullish duration, the DXY is now challenging a technically critical “Supply Zone” (100.150 – 100.600). Further away from key levels, both pump and dump up and down, momentum oscillators on all time frames give us mixed signals of exhaustion from buyers and that we are near to making a big decision in the direction of our market.
A comprehensive technical look that includes the broader structures and multi-month macroeconomic supply-demand analysis.
TECHNICAL OUTLOOK
Critical Resistance (Purple Zone): We are currently sitting right inside that 100.150 – 100.600 corridor. This is a level we know well—it’s packed with strong selling pressure and smart money order blocks. Think of this zone as a huge mental hurdle for the bulls; trying to go "Long" here without seeing a clean, high-volume breakout is just asking for trouble with a bad risk/reward setup.
Trend Structure: That ascending yellow trendline connecting the lows since September has been holding the price up so far. But look closer—the space between the price and this trend support is squeezing tight (Compression). This usually tells us one thing: volatility is kicking in and a big move is brewing.
Negative Divergence (RSI) : Here’s the warning sign. While the daily chart is trying to make new highs or just hanging on at resistance, the RSI is losing steam and making lower highs. This "Bearish Divergence" is a classic signal that the trend is running on fumes.
Momentum (MACD) : The MACD histogram is fading out, which confirms the bulls are getting tired. It hints that profit-taking—and the sellers taking over—is likely just around the corner.
MACROECONOMIC AND FUNDAMENTAL DYNAMICS
Fed Expectations : The market is scrambling to rethink the Fed's rate path for 2025. We are watching the data like hawks right now; even a small sign of cooling in jobs or PMI data could spark a rejection from this resistance and send the DXY correcting downwards.
Bond Yields : Any pullback in the US 10-Year Treasury Yields (US10Y) is going to add fuel to the fire for sellers on the Dollar Index.
Liquidity Hunt: Watch out for the "fakeout." Market makers might try to push the price just above that 100.600 level to grab liquidity and hunt the stops of early shorters before slamming it back down. Keep your eyes peeled on the Price Action here.
STRATEGY AND OUTLOOK
Since we are banging our heads against resistance, opening new long positions here just isn't juicy enough risk-wise.
Bearish Scenario: If we see a hard crash with volume breaking that ascending yellow trendline, that seals the deal for a reversal. If that happens, we’re looking at intermediate supports first, with the main target being that 96.50 level down low.
Bullish Scenario : Unless we get a solid daily candle close above 100.800, any rallies should be looked at as opportunities to sell. If the price stays above that level, then this idea is dead in the water.
Conclusion: It’s a "sit on your hands" moment. Waiting for that trend support to break is the safest confirmation we can get before jumping in.
Disclaimer : Just sharing my personal notes and educational analysis here, not financial advice.
US Dollar: Wait For The Breakout!Welcome back to the Weekly Forex Forecast for the week of Dec 1 - 5th.
In this video, we will analyze the following FX market: USD Dollar
The USD is bearish-neutral. It had a bearish close to last week, but did not close below the low of the previous week. This could indicate more consolidation coming.
Wait for price to trade above or below Friday's candle, and let that be your guide for the week.
Enjoy!
May profits be upon you.
Leave any questions or comments in the comment section.
I appreciate any feedback from my viewers!
Disclaimer:
I do not provide personal investment advice and I am not a qualified licensed investment advisor.
All information found here, including any ideas, opinions, views, predictions, forecasts, commentaries, suggestions, expressed or implied herein, are for informational, entertainment or educational purposes only and should not be construed as personal investment advice. While the information provided is believed to be accurate, it may include errors or inaccuracies.
I will not and cannot be held liable for any actions you take as a result of anything you read here.
Conduct your own due diligence, or consult a licensed financial advisor or broker before making any and all investment decisions. Any investments, trades, speculations, or decisions made on the basis of any information found on this channel, expressed or implied herein, are committed at your own risk, financial or otherwise.

DXY | Price Action - Awaiting a Clear BreakoutMacro approach:
- US dollar index has traded slightly weaker so far this week, pressured by rising expectations of another Fed rate cut and soft US data at the start of Dec. Sentiment toward the greenback has been cautious amid a pullback in US yields and ongoing repricing of the Fed’s policy path.
- Markets are increasingly discounting a high probability of a Dec FOMC cut as recent communication and prior easing have reinforced the view that policy is moving deeper into an easing cycle, undermining the US dollar’s yield advantage. At the same time, the latest ISM manufacturing release showed activity remaining in contraction territory, adding to concerns over US growth momentum and limiting support for the currency. Risk appetite in equities and metals has also improved, further reducing near‑term safe‑haven demand for the dollar.
- US dollar index may remain under pressure if the upcoming US labor market data and services surveys indicate further cooling, reinforcing the case for additional Fed easing. Key catalysts include this week’s jobs indicators, the ISM Services Index release, and fresh Fed speeches, which could potentially shift rate-cut expectations and drive renewed volatility in the index.
Technical approach:
- DXY consolidated within the range of 99.00-100.28. The index is between both EMAs, indicating a sideways movement remains intact.
- If DXY breaches above 100.28, the price may rise toward the following resistance at 101.70.
- Conversely, closing below EMA78 and 99.00 may prompt a further decline toward the subsequent support at 97.60.
Analysis by: Dat Tong, Senior Financial Markets Strategist at Exness

1 last visit to the trenches.good eve'
us dollar looks interesting to me,
starting to print a 3 day - 1 week hidden bear on various oscillators,
stuck at the 100 resistance.
so long as it bear flags beneath this 100 level, i believe the dxy is going to come down 1 final time to the low 90's before a bottom is attained.
---
calling this one a leading diagonal, despite the irregular structures in the sub-waves.
with something like the dxy, i don't mind being a bit more flexible with how i approach charting it.
---
🎯 = 93

The Dollar Isn’t Falling. It’s Being Repriced.The dollar didn’t weaken because of a single headline.
It weakened because two forces aligned at the same moment—policy certainty and political uncertainty.
Futures now price a full December rate cut.
That removes the dollar’s yield premium and lifts liquidity expectations.
But the bigger shift is political.
Odds have increased that Kevin Hassett could replace Jerome Powell as Fed Chair.
Markets understand the implication: potential pressure on Fed independence.
Currencies respond quickly to credibility risk.
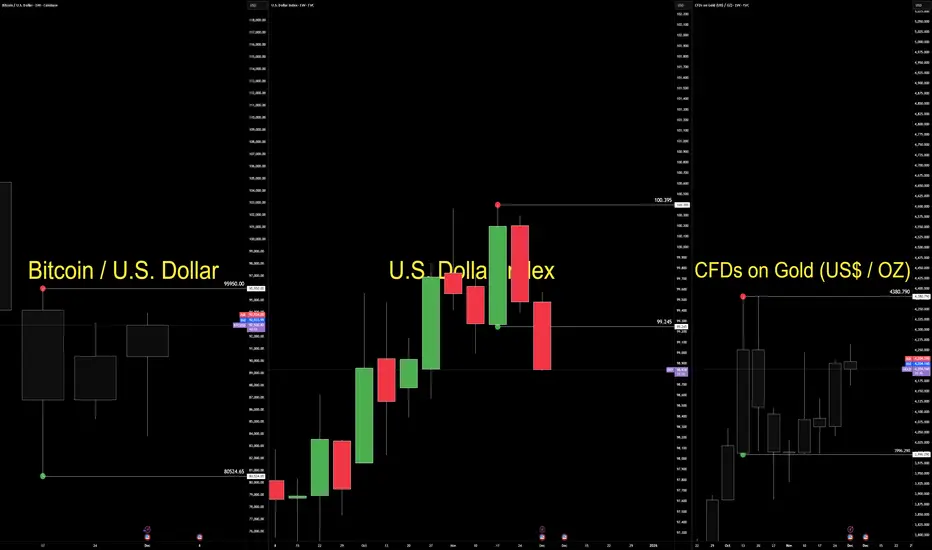
EURUSD strengthened.
Gold firmed.
Bitcoin stabilized despite its bearish structure.
Now the technical side.
The dollar still trades inside a bullish consolidation between 99.245 and 100.395.
Structure is intact, but behaviour has shifted under the surface.
Pressure is building inside the box.
Gold holds a weekly bullish consolidation above 3996.290.
Price is absorbing quietly—typical when investors hedge independence risk.
Bitcoin remains in a weekly bearish consolidation between 95,950 and 80,524.
A rare decoupling from the debasement narrative.
The macro story supports upside, but structure has not yet released.
This environment demands a behaviour-first lens.
Market Structure maps the containment.
Geometry shows the compression.
Volume Flow reveals participation rotation.
Order Flow exposes intent before trend.
Execution depends on pressure validation, not prediction.
Today is not a trend shift.
It is a credibility repricing.
The dollar hasn’t lost structure.
It has lost premium—while gold and crypto absorb the early rotation of capital into assets less dependent on institutional stability.
When policy becomes predictable and leadership becomes political, markets adjust before headlines explain why.
— CORE5DAN
Institutional Logic. Modern Technology. Real Freedom.
DXY FRGNT Daily Forecast -Q4 | W49| D3| Y25 | 📅 Q4 | W49| D3| Y25 |
📊 DXY FRGNT Daily Forecast
🔍 Analysis Approach:
I’m applying Smart Money Concepts, focusing on:
Identifying Points of Interest on the Higher Time Frames (HTFs) 🕰️
Using those POIs to define a clear trading range 📐
Refining those zones on Lower Time Frames (LTFs) 🔎
Waiting for a Break of Structure (BoS) for confirmation ✅
This method allows me to stay precise, disciplined, and aligned with the market narrative, rather than chasing price.
💡 My Motto:
"Capital management, discipline, and consistency in your trading edge."
A positive risk-to-reward ratio, paired with a high win rate, is the backbone of any solid trading plan 📈🔐
⚠️ Losses?
They’re part of the mathematical game of trading 🎲
They don’t define you — they’re necessary, they happen, and we move forward 📊➡️
🙏 I appreciate you taking the time to review my Daily Forecast.
Stay sharp, stay consistent, and protect your capital
— FRNGT 🚀
TVC:DXY

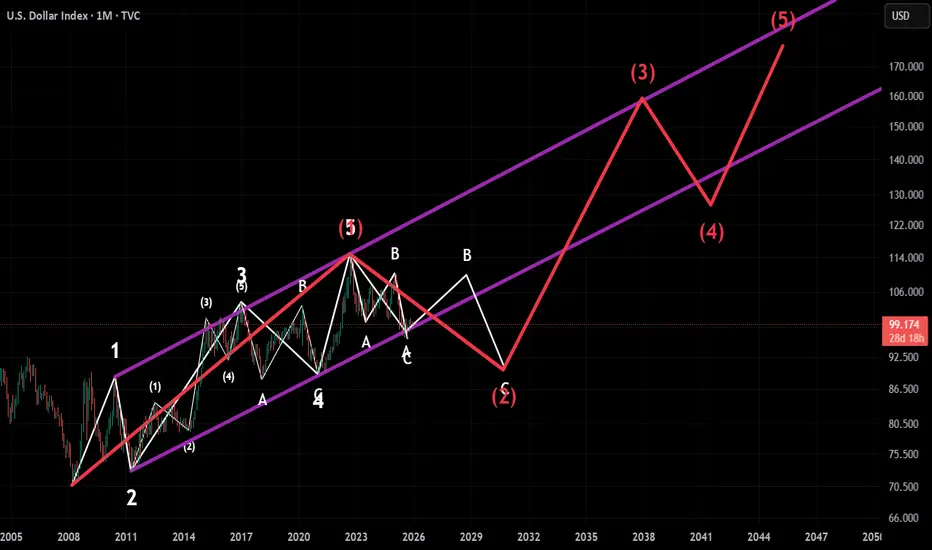
DXY is in SIDEWAYS consolidation phase in near future📈 DXY – Long-Term Elliott Wave Analysis (Monthly) –
The US Dollar Index continues to follow a clear multi-decade Elliott Wave structure inside a rising purple channel, and the long-term configuration strongly suggests that a major Cycle Wave (1–5) impulse has already completed. The advance began with Wave (1) rising sharply off the long-term base, followed by a deep Wave (2) correction back to channel support. From there, the index entered its strongest bullish phase, producing a powerful Wave (3) rally that pushed price into the upper boundary of the long-term channel. After this expansion, the Dollar consolidated through Wave (4), a prolonged sideways/down correction that held the channel midline, before finally completing the sequence with Wave (5), which tagged the upper channel once more and confirmed a multi-decade cycle top.
Following this Cycle Wave (5) top, DXY transitioned into a large A–B–C corrective structure, forming Cycle Wave (2). The first leg, Wave A, broke the uptrend decisively. The subsequent Wave B rally was corrective and choppy, failing to retest the highs and respecting the underside of the channel midline. The ongoing decline represents Wave C, which structurally aligns with a classic deep retracement. Confluence from the long-term channel, structural levels, and Fibonacci projections places the ideal Wave C low inside the 88–92 zone, highlighted as the red box on the chart. This region corresponds with the 0.5–0.618 retracement of the entire Wave (1–5) advance, making it the most logical area for Cycle Wave (2) to complete.
Momentum also supports a continued corrective bias in the near term. The monthly RSI sits around 44–47, historically consistent with mid-correction conditions rather than a completed low. Previous major cycle bottoms formed closer to RSI 30–35, hinting that further downside pressure may still be required before a durable reversal emerges. Key horizontal levels add confluence: 92.00 serves as the first structural support, while the 88–90 zone marks the primary inflection point for the end of Wave C. Strong resistance overhead rests at 105, followed by 120–122 at the channel midline.
Once Wave C completes and Cycle Wave (2) bottoms, the structure supports the beginning of a massive Cycle Wave (3) advance. This next impulsive sequence has long-term targets at 110–115 initially, then 125–130 as the mid-cycle rally develops, followed by a potential retest of the 135–140 range at the upper channel. The final Cycle Wave (5) of the future structure projects toward 150–155, aligning with the extended upper channel shown on the chart. This represents the super-cycle bullish scenario for the Dollar.
An alternative, lower-probability scenario suggests that Wave B may not have fully completed, allowing additional sideways action before Wave C resumes downward. However, only a sustained break below the long-term lower channel boundary (around 80–82) would invalidate the bullish super-cycle outlook. Until then, the primary expectation remains that DXY is approaching the final stage of its Wave C decline, after which a multi-year uptrend should begin.
Overall, the next 1–3 months appear biased toward downside continuation into the 88–92 support zone to finalize Cycle Wave (2). The subsequent 3–6 months favor the emergence of a strong bullish reversal that begins the early stages of Cycle Wave (3). The long-term chart remains structurally bullish, and once the corrective C-wave completes, the Dollar is positioned for a powerful multi-year advance.
Dxy and euro🇺🇸 DXY (US Dollar Index)
Today’s news impact: Bearish bias
Here’s why:
🔹 ADP forecast is VERY weak (5K) vs previous 42K
That’s a massive drop in expected hiring.
Weak jobs → weaker economy → higher chance of FED rate cuts → DXY bearish.
🔹 Export & Import Price Index expected LOWER (0.1% vs prior 0.3%)
Lower price indexes = lower inflation pressures → more reason for rate cuts → DXY bearish.
🔹 No strong USD-positive news today
Everything is soft data.
Soft data = soft dollar.
👉 Conclusion: DXY today = Bearish pressure unless numbers come out surprisingly strong.
🇪🇺 EUR (Euro)
Today’s news impact: Slightly Bullish bias
Even though no big euro numbers today, one thing stands out:
🔹 Lagarde speech (ECB President)
If she keeps her usual tone (still fighting inflation, careful about rate cuts), the euro holds strength.
Hawkish speech → EUR bullish
Neutral speech → EUR stable
Only dovish speech → EUR bearish
But normally Lagarde stays on the cautious side = euro stable-to-bullish.
👉 Conclusion: EUR today = Neutral to slight Bullish until Lagarde speaks.
⭐ Final Summary
DXY: Bearish (weak ADP forecast + weak inflation data)
EUR: Slightly Bullish (Lagarde speech risk, USD weakness gives EUR strength)
If you want, send me the EUR/USD 4H chart and I’ll match the news bias with your trendline structure for the perfect decision.

Bearish drop off?US Dollar index (DXY) has rejected off the pivot and could drop to the 1st support.
Pivot: 99.54
1st Support: 98.62
1st Resistance: 100.28
Disclaimer:
The opinions given above constitute general market commentary and do not constitute the opinion or advice of IC Markets or any form of personal or investment advice.
Any opinions, news, research, analyses, prices, other information, or links to third-party sites contained on this website are provided on an "as-is" basis, are intended to be informative only, and are not advice, a recommendation, research, a record of our trading prices, an offer of, or solicitation for, a transaction in any financial instrument and thus should not be treated as such. The information provided does not involve any specific investment objectives, financial situation, or needs of any specific person who may receive it. Please be aware that past performance is not a reliable indicator of future performance and/or results. Past performance or forward-looking scenarios based upon the reasonable beliefs of the third-party provider are not a guarantee of future performance. Actual results may differ materially from those anticipated in forward-looking or past performance statements. IC Markets makes no representation or warranty and assumes no liability as to the accuracy or completeness of the information provided, nor any loss arising from any investment based on a recommendation, forecast, or any information supplied by any third party.

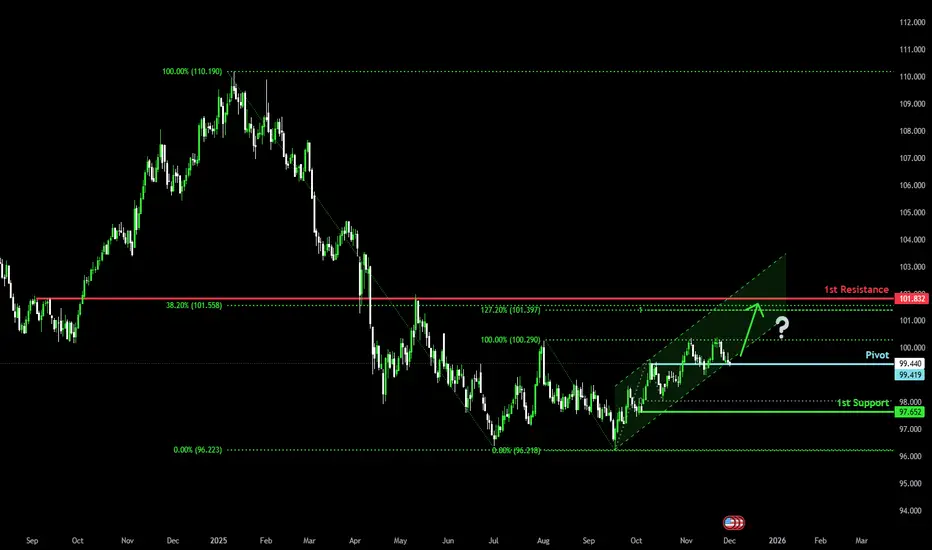
Could we see a bullish reversal?US Dollar Index (DXY) is reacting off the pivot and could bounce to the 1st resistance which lines up witht he 38.2% Fibonacci retracement.
Pivot: 99.41
1st Support: 97.65
1st Resistance: 101.83
Disclaimer:
The opinions given above constitute general market commentary and do not constitute the opinion or advice of IC Markets or any form of personal or investment advice.
Any opinions, news, research, analyses, prices, other information, or links to third-party sites contained on this website are provided on an "as-is" basis, are intended to be informative only, and are not advice, a recommendation, research, a record of our trading prices, an offer of, or solicitation for, a transaction in any financial instrument and thus should not be treated as such. The information provided does not involve any specific investment objectives, financial situation, or needs of any specific person who may receive it. Please be aware that past performance is not a reliable indicator of future performance and/or results. Past performance or forward-looking scenarios based upon the reasonable beliefs of the third-party provider are not a guarantee of future performance. Actual results may differ materially from those anticipated in forward-looking or past performance statements. IC Markets makes no representation or warranty and assumes no liability as to the accuracy or completeness of the information provided, nor any loss arising from any investment based on a recommendation, forecast, or any information supplied by any third party.
Dollar index The market (dollar index) will be bearish after a jump and a fake-out. Fake out line specified!

USD Dollar FOMC IdeaBias until Dec FOMC:
We will be looking to continue to ride the Fed rate cuts odds increased on the markets as that is still holding most weight at the moment and will most likely continue to do so until the FOMC decision on 11 December.
The markets have been primarily pricing in the rate cut expectations 30 days well before the actual FOMC decision, there during the actual Rate decision release, we barely get any impact and we get markets repositioning for any future guidance to come. Basically a case of ‘Buy the rumour and Sell the news’’ play.
- Because at the moment, we have been seeing rate cut probabilities increasing to 85% which has been holding most weight for Gold upside and giving the greedy intuitions a reason to further buy up risk assets.
However,
- This doesn't mean that Dec is a guaranteed rate cut, and during the December FOMC, the fed may either cut rates by 25bps or Hold rates, and if there future guidance remarks are hawkish since inflation is still elevated - then we can see Profit taking on risk assets. Therefor expect to see Gold bears, DXY bulls, BTC Bears, Stock bears.
So until the actual December FOMC, If December Rate cut probabilities are still elevated (80%+), then, we can still expect Buyers in control on Risk assets, so:
- DXY - Downside.
- GOLD - Upside , potentially retest upto previous ATH’s $4380’s. Then Profit taking post FOMC.
- US Stocks - Upside on SPX to make New ATH’s and bearish wave if Dec FOMC hawkish.
- BTC - Upside to 100k, prev supply zone before Correction bearish phase.

EURUSD long setupEURUSD sitting on a London session low zone and in a P-Line zone along with the RSI showing oversold conditions, conversely DXY is at a the London session high and also the RSI showing overbought. Going for a 1:2 RR trade.

US Dollar Plunges into December as DXY Threatens September RallyThe US Dollar plunged more than 1.3% off the November highs after DXY turned from pivotal resistance last week at 100.15/35- a region defined by the 2024 low, the August high, and the 2024 low-close. The losses are now threatening to break the September uptrend, and the focus is on today’s close with respect to the November low-day close (LDC) at 99.27. A close below this level would risk a larger decline towards 98.69/79- a region defined by the August high-day close (HDC), the May low, and the 38.2% retracement of the advance off the yearly low. Look for a large reaction three IF reached.
Initial resistance stands with former channel support and is backed by the 200-day moving average at 99.67. A breach / close above this moving average would be needed to suggest this was a false break scenario with critical resistance unchanged at 100.15/35.
Bottom line: We are looking to confirm the break below the September channel early in the month. From a trading standpoint, rallies should be limited to the 200DMA IF price is heading for a larger correction here with a close below 99.27 needed to keep the bears in control.
-MB

DXYHow to become successful in forex and stock trading: 1.Master fundamentals and technical analysis. 2,Build and follow a solid trading plan. 3.Apply strict risk management (1–2% rule). 4.Stay disciplined—control fear and greed. 5.Record and analyze every trade. 6.Focus on high-quality setups only. 7.Diversify across assets and markets. 8.Keep evolving—study, adapt, and grow daily.

DXY: Dollar Index Mid-Term OutlookThe U.S. Dollar Index is maintaining a steady corrective rhythm on the 4-hour timeframe, with recent price behaviour indicating a potential shift in momentum as markets transition into December. Current swings highlight an evolving structure where buyers and sellers continue to balance out ahead of key macro catalysts.
Disclosure: We are part of Trade Nation's Influencer program and receive a monthly fee for using their TradingView charts in our analysis.

Weekly WatchlistThe dollar index has been in a **short-term upward cycle for almost 75 days**, and now it’s moving toward the **100 level**, which is a very strong resistance. This week we need to see whether it can:
1. **Break this resistance**, and
2. **Hold above 100** (give a proper consolidation)
If these two conditions are met, we can say the **DXY has turned bullish**.
If that happens, **many currency pairs, gold, and even crypto** could come under strong downward pressure, because a stronger dollar usually pushes these markets lower.
But if the 100 level rejects the price, then a pullback or reversal is likely.

DXY bullishDXY resumed upwards monday and tuesday, but fell again wednesday and thursday, into another a deeper level of horizontal supoort, then consolidated friday and is now bullish again, dxy resuming back up again. Next strong move up is still to come...
