US Dollar Flexes, Look For on 99.05Sunday War Map –
A weekly candle this strong leaves a mark. The dollar printed a 96.77 low to 98.18 high—a full-bodied bullish bar that demands respect.
Macro
This week is stacked with U.S. data that can shake the pullback narrative:
Tue 30 Sep – JOLTS & Consumer Confidence: first look at hiring demand and household mood.
Wed 1 Oct – ISM Manufacturing PMI: factory pulse and price pressures.
Thu 2 Oct – Durable Goods & Trade Data: capital-expenditure clues.
Fri 3 Oct – Non-Farm Payrolls & Hourly Earnings: the heavyweight. A hot jobs print could delay the December Fed-cut story (futures still price ~70% odds).
Technical Targets
Expect an early-week pullback as traders digest that massive weekly bar.
Two liquidity pools we’ve tracked for months were cleared last week; two upside targets still in play 98.2 and 98.3 remain before the chart reaches a true “bearish-range discount.”
Keep eyes on the 99.05 volume node—a well-defined supply zone where cross-market reactions (EUR, gold, crypto) could spike.
The dollar controls the tempo. Wait for the market to come to your levels; don’t chase the last candle.
Trade ideas

DXYDXY is in correction and can give us some more sideways before any push up.
Disclosure: We are part of Trade Nation's Influencer program and receive a monthly fee for using their TradingView charts in our analysis.

DXY outlook from 29th sept to 3rd oct 2025The DXY has shown signs of longs even when the FED cut rates. the last quarter may actually be bullish for the US dollar.
it has been forming large buy candles on the daily timeframe in the previous week. this may not be a sign that we are bullish but also the market has failed to close below the FVG on the weekly time frame from July ever since it traded into it.

DXYThe Dollar Index (DXY) is currently rising within a flat corrective structure. Wave C may complete around the 100 zone, which serves as a key resistance level. Once this area is reached, a strong bearish reversal could follow. Traders should be cautious of potential exhaustion in the upward move and prepare for selling opportunities once confirmation appears.

Dollar Index Holding Up But GBPUSD Might Change That...Dollar = Relative Game, Not Absolute
Dollar Index isn’t just the USD — it’s USD vs a basket (mainly EUR, JPY, GBP).
If the Fed cuts but ECB, BOE, and BOJ are also leaning dovish, the relative advantage doesn’t change; USD stays steady.
The dollar has been consolidating because macro signals are mixed (Fed easing vs US resilience, inflation uncertainty, global growth divergence), and the euro/yen/GBP balance out.
The market is waiting for a clear catalyst — usually a Fed decision, inflation report, or geopolitical shock to break the range.

$DXY longsFor next week I’ll be focusing on dollar longs since we got a 4H swing trend BOS and a lot of descending highs left open.
Favoring positions on #EURUSD and #GBPUSD.
Will keep you updated. #FOREX

DXYThe U.S. Dollar Index (DXY) maintains a bearish bias after breaking key support levels. Markets are pricing in a less aggressive Fed, mixed economic data, and rising risk appetite, all of which limit demand for the USD as a safe haven.
🔑 Key Factors
Monetary policy: The Fed no longer shows the hawkish tone of 2022–2023; rate cuts are expected in the coming quarters, reducing the dollar’s appeal.
Macro data: Inflation is more under control and signs of economic cooling → fewer arguments to keep rates high.
Market sentiment: Flows into stocks and crypto reflect greater risk appetite, reducing USD demand.
External factors: The ECB and BoJ are showing signs of tightening → the interest rate differential with the U.S. narrows, cutting the dollar’s advantage.

DXY 4H🔹 Overall Outlook and Potential Price Movements
In the charts above, we have outlined the overall outlook and possible price movement paths.
As shown, each analysis highlights a key support or resistance zone near the current market price. The market’s reaction to these zones — whether a breakout or rejection — will likely determine the next direction of the price toward the specified levels.
⚠️ Important Note:
The purpose of these trading perspectives is to identify key upcoming price levels and assess potential market reactions. The provided analyses are not trading signals in any way.
✅ Recommendation for Use:
To make effective use of these analyses, it is advised to manually draw the marked zones on your chart. Then, on the 15-minute time frame, monitor the candlestick behavior and look for valid entry triggers before making any trading decisions.

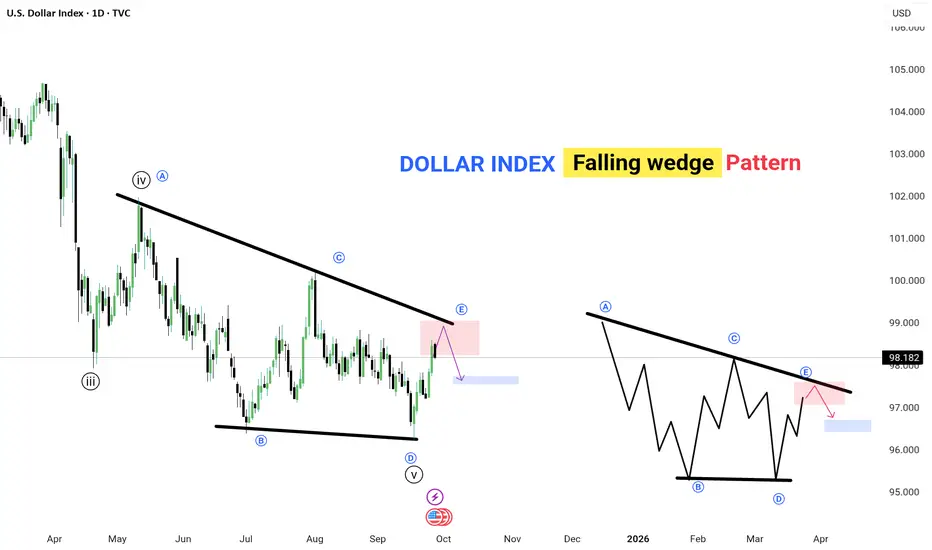
DOLLAR INDEX – Falling Wedge Pattern📉 The Dollar Index is forming a falling wedge, a classic reversal pattern.
🔹 Price is approaching the upper trendline resistance (point E).
🔹 Expect a potential pullback toward the support zone (highlighted in blue).
🔹 Pattern repeats: After E, a corrective dip is likely before the next move.
✅ Key Points:
Falling wedge usually signals trend reversal or continuation.
Watch for breakout confirmation above resistance for bullish continuation.
Current focus: resistance zone near 98–98.2, then potential drop to 96–97 support.
💡 Lesson: Patience pays — wait for clear rejection or breakout before trading this setup.
---
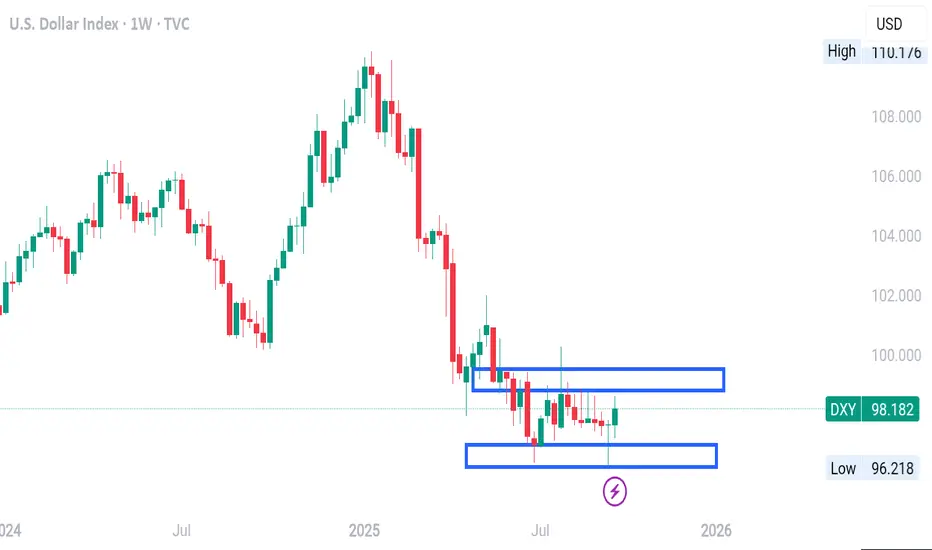
DOLLAR INDEX WEEKLY TIMEFRAME ANALYSIS Looking at the chart (USD Index, Weekly timeframe):
1. Current Context
Price has been in a clear downtrend from the highs above 110.
Recently, it has moved sideways between 96.90 – 99.30 (the two boxed ranges you marked).
Current weekly candle is green, showing a short-term attempt to bounce.
2. Key Zones
Resistance zone: 98.53 – 99.34 (upper box). Price has repeatedly failed to close above this region.
Support zone: 96.92 – 96.12 (lower box). Buyers have stepped in here multiple times to prevent deeper falls.
3. Directional Bias
Macro bias (weekly structure): Still bearish, because the overall trend is lower and price is consolidating near the bottom after a strong selloff.
Immediate/short-term bias: Neutral to slightly bullish, since the last candles show rejection of the lower end (around 97) and price is pushing back up toward resistance at 98.50+.
4. What to Watch
If price breaks and closes above 99.34, bias shifts bullish with room toward 100.95.
If price rejects the 98.5–99.3 zone again and rolls over, expect continuation lower toward 96.00 and potentially 95.30.
👉 Summary:
Bias is bearish overall, but short-term corrective bullish as price moves within the range. Directional confirmation will come only when price breaks out of either the 99.30 resistance or the 96.12 support.
DXYDXY Bearish Outlook
COT positioning confirms sellers are in control, showing bearish sentiment.
Market structure also points lower with lower highs and lower lows.
As long as this structure holds, bias remains bearish.

DXY Showing signs of strength as we can see in weekly TF price rejects this weekly area and confirms reversal through doji candle on a weekly TF fed is not supposed to cut rates in next meeting there are possibilities that dollar can regain its strength
price did not break below the previous week low..

DXY ( Doller Index ) I expect to see the dollar index begin to rise from these areas. The wave will take months, perhaps even two years, to reach the upward target

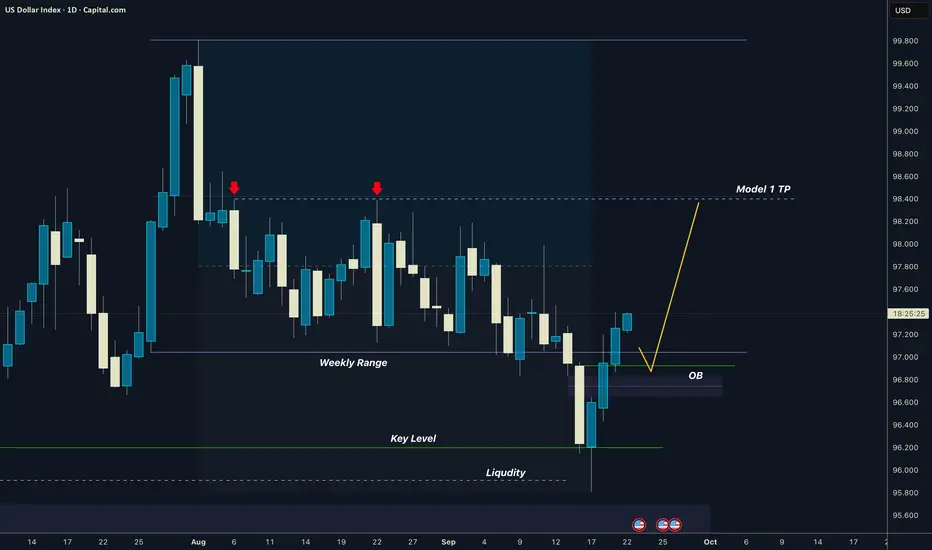
Dollar I Weekly Range I 50% Target I Model 1GM Traders, we have seen price has been accumulating thru the whole august, now it dipped bellow the range and strongly rejected and created OB. It has change to to go to 50% of that range where is doouble top liquidity which.
Have a great trading week !!
David Perk aka Dave FX Hunter
DXY (US Dollar Index) 2H chart.DXY (US Dollar Index) 2H chart, you can see my drawn a breakout setup with targets marked.
Here’s the breakdown:
Current price: ~97.42
Trendline breakout setup is shown, with bullish continuation in mind.
First target point is marked around 98.00
Second target point is marked around 98.60
✅ So the bullish targets are:
TP1: 98.00
TP2: 98.60

Dollar Index Holds Firm on Fed CautionFundamental approach:
- DXY edged higher this week amid firmer US data and cautious Fed rhetoric that tempered aggressive easing bets. Risk sentiment was mixed, with markets awaiting core PCE for policy cues, supporting the dollar on rate differentials and data resilience.
- Stronger jobless claims and an upgraded Q2 GDP print underpinned the greenback, while Fed speakers highlighted divisions over the pace of additional cuts, limiting the index's downside.
- DXY could stabilize or firm if core PCE surprises, while a soft print may rekindle cut expectations and weigh on the dollar.
Technical approach:
- DXY broke the descending trendline and retested the key resistance at around 98.60. The index is around EMA21, and it is awaiting an apparent breakout to determine the upcoming trend.
- If DXY breaks above EMA21 and key resistance at 98.60, the index may retest the following resistance at 100.
- On the contrary, failing to close above 98.60 may lead the index to retest EMA78 or the following support at around 97.15.
Analysis by: Dat Tong, Senior Financial Markets Strategist at Exness

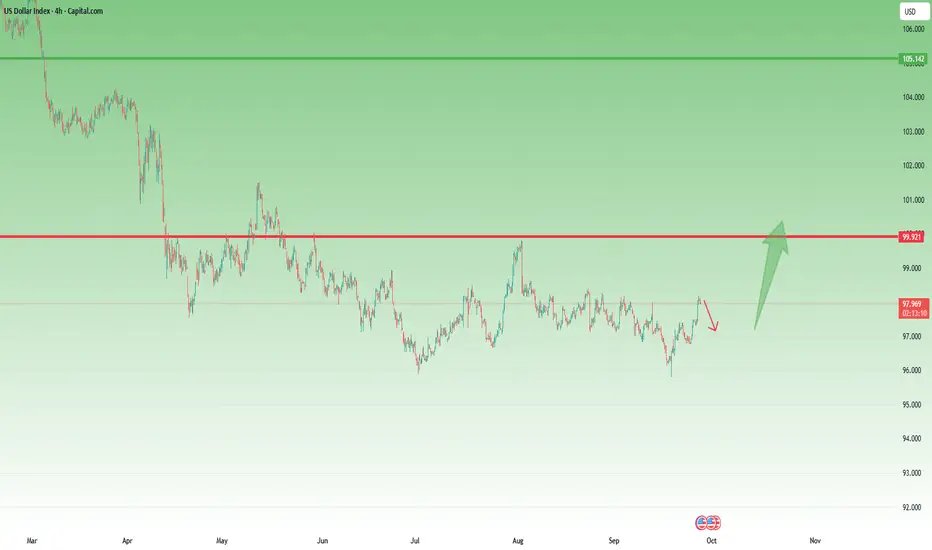
DXY – Reversal in Motion, Correction Next?In my previous DXY analysis, I highlighted that all the bad news might already be priced in for the USD, opening the door for a reversal.
That scenario is now unfolding: after making new dips, the index bounced strongly from the 95 zone and is currently trading around 98.
After such a sharp rebound, the market looks ready for a correction. This pullback phase could provide traders with attractive opportunities – especially to position short on the major USD pairs, but at better, higher prices.
Trading Plan:
• The reversal has confirmed, but I expect a correction before continuation.
• I’m looking for retracements to offer entry levels for USD shorts via majors.
• As always, flexibility is key – monitor price action closely to time entries correctly.
The market has started to shift – now it’s about waiting for the correction to align risk and reward properly. 🚀
DXY Breakout Trade Setup – Bullish Channel & High R:R OpportunitChart Overview:
Instrument: U.S. Dollar Currency Index (DXY)
Timeframe: 1 Hour (1H)
Current Price: 98.371
Analysis Date: September 26, 2025
🔍 Technical Structure:
1. Bullish Channel:
A clear ascending channel is drawn, indicating a strong short-term uptrend.
Price action has been respecting the channel well, moving between the upper and lower trendlines.
A bullish breakout is either anticipated or just confirmed above the channel.
🟦 Trade Setup (Long Position):
✅ Entry Point:
Price: 98.267 (blue horizontal line labeled "Entry Point")
This is slightly below the current price (98.371), suggesting an entry on a slight pullback after breakout.
🛑 Stop Loss:
Price: 97.986 (also marked 97.982 on the lower blue line)
Located below a recent support zone and below the breakout structure.
This gives a safety buffer if the breakout fails.
🎯 Target Point (Take Profit):
Price: 99.676
This is based on the measured move from the height of the channel, projected upward from the breakout point.
📐 Risk-to-Reward Ratio (RRR):
Very favorable; visually it appears to be around 4:1 or higher.
Small stop loss area (red box) relative to the large target area (green box).
High RRR makes this setup attractive for risk-managed traders.
🔎 Additional Observations:
Trend: Strong bullish momentum leading into the breakout.
Volume / Confirmation: Not shown on the chart, but ideally you’d want volume confirmation for the breakout.
Timing: Entry and confirmation should align with break and retest of the channel top.
✅ Summary of the Trade Plan:
Component Value
Entry 98.267
Stop Loss 97.986
Take Profit 99.676
Risk-Reward ~4:1
Trade Type Long (Buy)
Strategy Breakout + Retest
⚠️ Important Notes:
Wait for confirmation (like a bullish candle close above the channel or successful retest).
Be aware of macroeconomic news that can affect DXY (e.g., Fed announcements, interest rate decisions, inflation data).
Use position sizing appropriate to your risk tolerance.

DOLLAR REBOUND TO TAKE PROFIT ZONE DOLLAR ,the united states dollar remains a key driver for EURUSD,AUUSD,GBPUSD,USDJPY,XAUUSD,BITCOIN SILVER ,COPPER,when i shared a perspective on the rebound we started seeing a sharp drop in weekly gains of EUR,GBP,GOLD ,SILVER AUD ,CAD, ZAR.
IF THE DXY REBOUND FINALLY REACH TAKE PROFIT ZONE ,OTHER PERS TRADING AGAINST THE DOLLAR WILL STRUGGLE.
#DOLLAR #DXY #US10Y
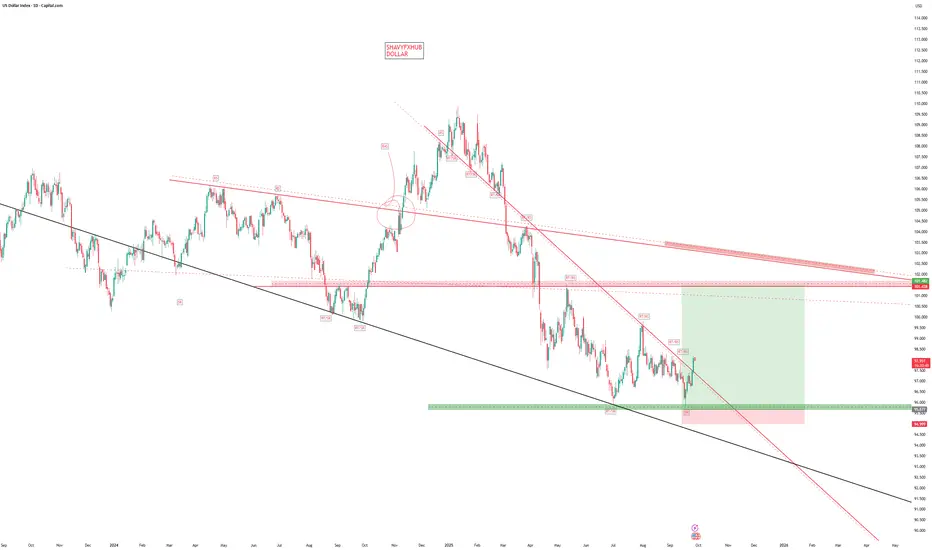
DXY Daily Timeframe – Technical & Fundamental AnalysisDXY Daily Timeframe – Technical & Fundamental Analysis
Fundamentals:
The U.S. economy continues to print strong economic data, which typically supports the dollar. However, the DXY has failed to create new highs and is currently sitting below key resistance. This suggests that much of the positive data is already priced in. With buying momentum slowing, there is an increasing probability that traders will begin taking profits — potentially triggering a sell-off.
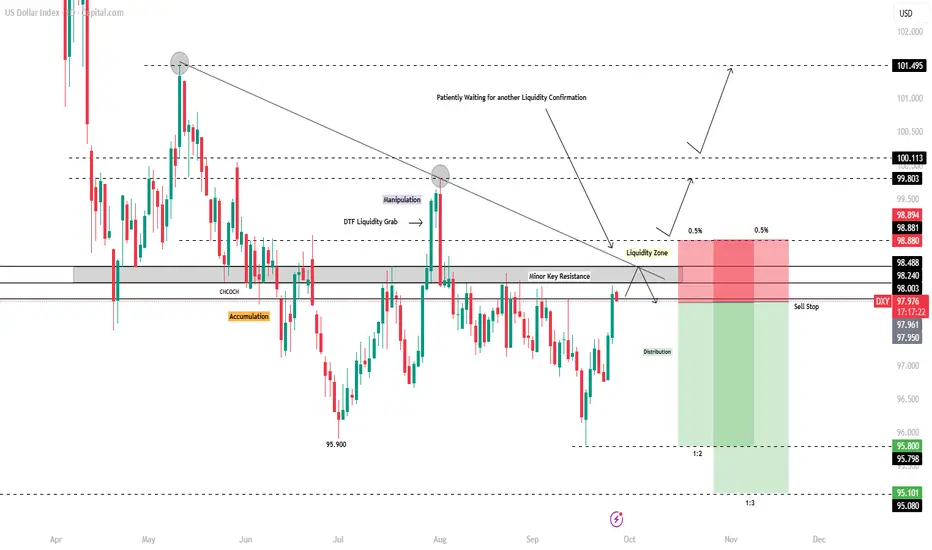
Technicals:
After a liquidity hunt/manipulation above previous highs, price broke below a key level, confirming a Change of Character (CHoCH).
Post-breakout, price accumulated sell positions under the key level and was driven lower, reaching as far as 95.900.
A pullback followed, with price retesting the minor key resistance at 98.300, but failing to break higher.
We are now watching closely for a liquidity grab within the 98.300–98.880 liquidity zone.
📌 Trading Plan (DTF Bias – Bearish):
Point of Interest (POI): 97.950
Stop Loss (SL): 98.880 (above liquidity zone)
Take Profit 1 (TP1): 95.800
Take Profit 2 (TP2): 95.100
📌 Disclaimer: This is not financial advice. Always wait for proper confirmation before executing trades. Manage your risk wisely and trade what you see—not what you feel.

DXY--General outlook details--This daily chart is for the current position.
--Check for the big picture chart I add below.

DXY--Big picture--To see the big picture I analysed the instrument in 3M time period
--I will add a seperate lower time frame chart
