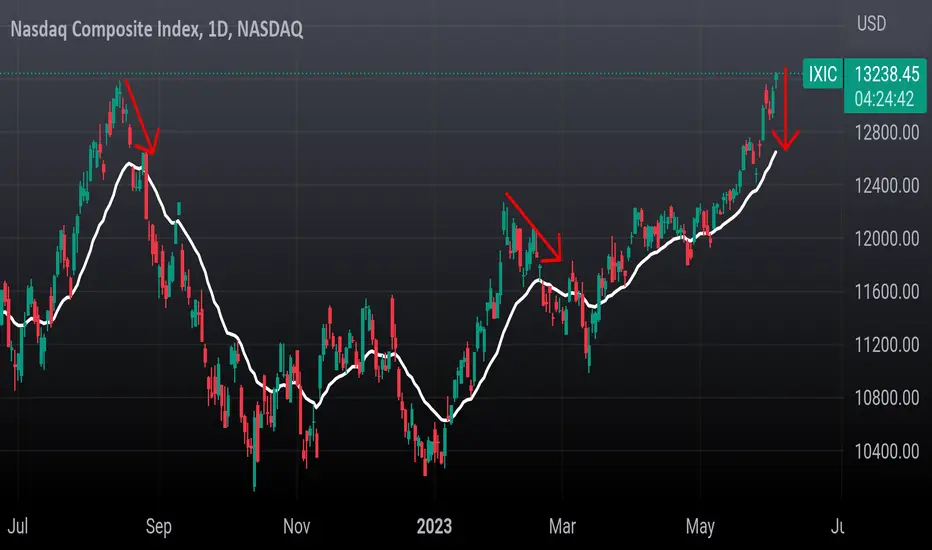
IXIC (Nasdaq) Price is too Overbought right now and below I'll try to convey my thoughts.
Nasdaq never extends more than 5-6% from its 21ema before a significant sell off .
The 21ema the white line
Let's start with Nasdaq rally from March 2020 lows unt Sept 2020
March 2022
August 2022
Feb 2023
June 2023
Also weekly candle is forming a hangman while completely outside Bollinger band.
After this aapl event this week I expect a pullback to Daily 21ema minimum.
Market insights
IXIC is in a bulish chanelNasdaq analysis
Since December 28, 2022, when it touched the bottom of the ascending channel, it has continued its upward trend for 153 days with a relatively good slope of 24 degrees and has grown by 29%.
Regardless of the current candle, the limits of the index can be considered between the midline and the ceiling of the channel (12793 to 13647).
According to the status of the RSI indicator, it is not far-fetched to modify the index up to the midline of the channel.
If the midline of the channel is touched, a growth of 6.36% to the ceiling of the channel can be imagined.
Don't forget capital management and compliance with risk to reward.
Good luck and profitable.

Nasdaq Composite Index, IXIC, Start of a New Bull MarketIt doesn't get more simple than looking at this Monthly Chart going back over a decade. You can clearly see the incredible uptrend and the True Strength Index, although having shown a bearish divergence since Jan.2022, the TSI has barely broken the Centre line and is now about to turn back above. This New Bull Market should last through to the end of 2014. Just waiting for confirmation, and that will happen in June.

Understanding Current Market Trends 🔄CURRENT MARKET TRENDS 🔄
1. 🎯 Selective Market Dynamics
The present market scenario remains highly selective. This has been a pattern, with a tendency for a rotational environment. Stocks that are currently underperforming or rebounding from their lowest points are leading the market for short durations. This is while tech-heavy indices like the Nasdaq temporarily stagnate, then it's their turn to lead, and the cycle continues. But, there's a growing concern - fewer companies are driving the Nasdaq, which is complicating attempts to gain significant progress with individual stocks due to diminishing participation.
2. 🐺 The 'Lone Wolf' Phenomenon
The case of NVDA serves as an excellent example of this emerging "lone wolf" trend. Recently, NVDA shares experienced a substantial increase of nearly 30% following an impressive earnings report and promising quarterly guidance. This surge contributed to a 1.7% uplift in the Nasdaq index. Meanwhile, other indices like the Dow and Russell 2000 ended negatively for the day.
🤔 DECODING MARKET CONCERNS
1. 📉 Hidden Weaknesses in Indices
While favorable earnings responses are generally positive, the risk lies in a market driven by a limited number of stocks. This poses a challenge because the strength of indices can be misleading, concealing the limited overall participation if the driving force comes from a handful of giant corporations.
2. 🛡️ Defensive Tendencies & Megacaps
There are phases when financial institutions become cautious about risk and the overall economy, leading them to adopt a defensive stance. Megacap companies have offered liquidity during these times, thus becoming the "safe" choices when institutions hesitate to take on riskier investments. This has led to an updated version of the old Wall Street adage, "You'll never go out of business losing your client's money in IBM." In this context, IBM is replaced by modern tech giants like Apple (AAPL), NVDA, Amazon (AMZN), Google (GOOGL), Meta (META), and Netflix (NFLX) - the new IBM's are the FAANG companies!
🚀 NAVIGATING MARKET DYNAMICS
1.💡The Eventual Shift
While this trend will eventually change, predicting when this will happen is not a necessity. Indicators such as a rise in successful breakouts will provide all the necessary information. Until then, discipline and avoidance of fear of missing out (FOMO) and hasty strategies is advised.
2.🌊 Riding the FAANG Wave?
You might be contemplating whether to join the FAANG trend. If these stocks show positive signs or proper bases, the answer is yes! For instance, NVDA and NFLX were recently included in our Watch List for this very reason.

nasdaq 🌊Greetings,
A mirror to my tableau painted for Bitcoin,
I surmise that the Nasdaq is engaged in the theatrical rendition of a cycle degree fourth wave.
Historically,
these fourth waves are prone to a tactical withdrawal into the realm of the prior degree wave four territory.
In this distinct instance, the territory in question lurks in close proximity to the abysmal pits of the pandemic nadir.
A bullish harbinger would manifest should the Nasdaq maintain an altitude above these pandemic depths for the duration of this bear market.
If such a trend is confirmed, i will dare to anticipate an audacious ascent to the lofty summit of $30,000 as we voyage through the decade towards the 2030 agi revolution.
---
w4 - $8,100
w5 - $30,000
☿

Nasdaq Monthly overview Nasdaq - after more than a year, the Monthly candle is breaking out 20 SMA and it implies that IT shares would be benefiting of this. Strong DXY is also helping the cause.

IXIC/USM2 updateI still think blowoff top like dot com bubble may be headed our way, then we get the big kahuna everyone seems to be waiting on.

Potential Major Nasdaq Top! 5-16-23Attention this is a RED ALERT!
On 05/16/23 the Nasdaq Composite (IXIC) appears to have completed an Elliott wave Ending Diagonal Triangle. If so this could be the final wave up of the rally that began in October 2022. On 05/16/23 the IXIC advance/decline line was bearish. 15 -minute MACD and RSI have significant bearish divergences.
May is the start of a seasonally bearish time for stocks.
U.S. stocks may have begun a multi - month decline.
This is a RED ALERT!

beautiful , classic pattern of #Nasdaq composite the pattern is a classic W with a flag shape handle ,I expect a route, like I have placed in my chart.

IXIC (Nasdaq) For my followers who are unfamiliar with the Indexes , The IXIC is the entire nasdaq where as the QQQ (NDQ) only represents the top 100 tech; This distinction is important in what I'm about to explain.
Since Feb the IXIC has not been able to get over 12,280 while the QQQ has made a higher high since Feb; This is because only 5 tech names have been moving higher.
Just like the QQQ , IXIC is also trading inside a rising wedge
I think Monday we begin to pullback and eventually close close Fridays gap by CPI Wed.
From there we will see if the correction begins for tech or the start of a broader rally in tech..
Breakdown scenario
Breakout scenario

NASDAQAgain it is trying pull back, i thought today it will break this resistance level.these are major resistance and support

"New bull market!" "Return to normal!" Bubble bust denial lolzFED "pivot" hopes won't die.
Bank collapses are "good for the stock market".
AI mania has the meme market looking alive again. NVDA, a company in which both revenue and earnings have dropped significantly over the past 3 quarters, is trading at 150+ P/E and 25xSales with a $666Billion market cap!
We're "back to normal" folks! /s
I LOVE how this classic Market Psychology chart lines up so well with the current NASDAQ monthly chart!

IXIC/USM2 this bubble compared to dot com...blowoff?Maybe blowoff top coming with global liquidity about to explode with reserve currency wars? i'm long in growth positions with fingers crossed!

NASDAQ FAILED TO SURPASS THE HORIZANTAL RESISTANCEBearish div in mom indicators, slide below the trend followers... sold my longs

IXIC - Double TopAn idea for IXIC showing a strong trend line in white that should be respected.
This works well with a double top, a bearish pattern.
A channel can also be drawn encompassing the double top.
I have posted key price points with the labels.

2023 Crisis In my own eyes
THIS IS JUST A THOUGHT OF SOMEONE WHO LOOKS AT THE MARKET FROM A BEAR POINT OF VIEW- NO ADVISE
Publishing here the history of economics effect on stock market
I took the last couple of crisis (bubble at 2000 and the real estate crisis on 2008) and added the bellow charts
- Inflation
- Interest
- Unemployment
Once thing is clear- each time inflation went up- The fed increased the intersect rate and unemployment went down to the lowest points of the decade or more
- When unemployment reached the bottom, we were getting towards the top of the market (on 2008) or in the middle of the fall down (2001)
- UNEMPLOYMENT RATE NEVER REACHED THE BOTTOM WHEN THE CRISIS WAS OVER OR DURRNING THE UPTREND ON THE ABOVE CRISIS
-When Inflation rates got to the pick level - the market was either still climing or in the begining of the fall
- INFLATION RATES NEVER PICKED OR STAYED HIGH FOR A LONG TIME WHILE THE MARKET BOTTOMED
- THE PRIOD OF AT LEAAST 7 MONTHS WE HAD THE HIGH INTRESET RATE AT THEIR PICK
- AND IT HAPPENED WHILE THE MARKETS WERE CRASHING
THE SIGANL FOR THE BOTTOM USUALLY CAME WHEN THE INFALTION CAME TO IT'S LOWEST POINT
- DRAMATIC MOVES OF THE INFLATION GOING DOWN - WERE IN THE MIDDLE OF THE CRASH AND TOWARDS THE END WHEN WE HIT THE BOTTOM
- Were are we now 4-2023???
In My Opinion:
- We are in the beginning of the big crash, we are going to sink hard to new low level, we will visit the highest levels of the market before the CORONA (February 2020)
- I really think we will have a hard recession which will take 5-7 years or more to get back to the tops of the ETFs (QQQ/ SPY etc...)
We are being fouled at the moment the the bottom already happened, as nothing is shiny in the near/ far furture
- AAPL IS ONLY 9% FROM IT'S ATH (MAKE SENCE??) not to me
- VIX IN ITS LOWEST FOR THE PAST 1+ YEAR (USUALLY THE MARKET WILL PUT ALL TO SLEEP BEFORE THEY DROP THE KNIFES)
- LAYOFF SEASON HAS BEGAN AT THE BIG COMANIES
- FED DECLEARED A SOFT RECESSION (WHEN THEY SAY SOFT IT'S THE SAME AS WHEN THEY SAID TRANSITORY INFLATION - PLEASE REMEMBER !!!
- INTRESET RATE?? NEXT 0.25 IS COMING IN 2 WEEKS
- WHAT IS THE CATALIST FOR THE MARKET TO GO HIGH??
NOTHING (In My Opinion)
THIS IS JUST A THOUGHT OF SOMEONE WHO LOOKS AT THE MARKET FROM A BEAR POINT OF VIEW- NO ADVISE


Follow Through Day's and Market BottomsIt’s said that three out of every four stocks will follow the trend of the general market. It’s also known that the best opportunities come when a bear market ends, and a fresh new uptrend begins. The question is, how do you know when a new uptrend starts?
The Follow Through Day
A Follow Through Day was defined by William O’Neil as “when one of the major market averages moves up over 1.25% on heavier volume than the previous day.” A Follow Through Day usually occurs sometime between days 4 and 12 of an attempted rally.
When to Start Counting Rally Days
While the market is in a down trend, you are waiting for the first day the market closes positive to start counting your attempted rally days. The first positive day is day 1 of the rally attempt. On day 4 or later you are looking for the Follow Through Day to occur.
How Does a Follow Through Day Fail
Not every follow through day works, but no bull market has started without one. All days of the rally do not need to be up, some may be down, however a follow through day officially fails when the low of day 1 of the rally attempt is undercut. When this happens, it is time to start looking for a new day 1 and another follow through day.
It is not uncommon to have multiple attempted rallies and failed follow through days before the market begins a new uptrend. Let’s look at a few market bottoms from the past reviewing the concepts covered.
Nasdaq 1998 Bottom
SPX 1974 Bottom

NASDAQ NEXT TARGET 16000 AROUND DECNASDAQ ON A MOVE .
GET READY FOR BIGGER MOVE IN LARGE CAP STOCKS .
DEC TARGET 16000 APRROX.
different and new stocks starts to move in new bull market

IXIC - Realistic Target The strong trendline in white shows that IXIC is looking for another touch.
I see 10k as a strong psychological support and the spot for price to be tested.
Drawn a little dotted trend line to show downward movement.
To 10K !

MAIN CRYPTO INDICATORhi 🖖🏼
there is no reason to say yea i'm bullish AF ON BTC....but yes BTC can move sideways inside a box (1M 15k-28k)
for now BTC touched wyckoff target (check last BTC update-28100 USDT) and it's possible to see correction till 25100 USDT
but what can ruin normal moves on BTC?....breaking a specific level on ICXC (nasdaq) chart....like 61.8 fibo or MA200, MA100, PRZ.....
we must always take a look on ICXC and then check BTC to take a position
this chart isn't a trade for me i just use it as a good indicator
i'll share some BTC pairs (alts) in coming days
DYOR 🥂
HAPPY NOWROOZ EVERYONE 🤩💚🖖🏼
be omide azadi...🕊

Financial Crisis 2023 Firstly,
September 2007 - Lehman Brothers collapse
March 2023 - Silicon Valley Bank collapse
Asset correlations (bottom pane):
Gold ( red ) - on a slow rise in 2007, same as today
Dollar strength ( blue ) - bearish in 2007, same as today
Nasdaq (orange) - bearish in 2007, same as today
Indicators' inference :
The top pane shows a logarithmic version of an indicator called MACD leader (zero lag). 2006 - 2007 and 2022 - 2023 have so far been the only years which produce inconclusive monthly signals since 1988.
The middle pane's aim is to signal simultaneous movements of securities and spread graph equations. Each line represents the correlation coefficient between the main chart and a financial instrument. Spread graphs attempt to illustrate peaks in inflows/outflows from equities --> safe heavens through correlation.
Similar to spread graph equations, the idea of accounting for the movement of capital to different assets was applied to make the main chart:
TVC:IXIC*10000000*((TVC:US30Y-TVC:US10Y+TVC:US10Y-TVC:US02Y+5)*TVC:GOLD)^-1
Finally,
Current Retest(D):
Same chart - Longer Period (3M):
Feel free to drop a question. Thanks for your time!

