INTRADAY ascendinc triangle Monday close in break out, tuesday ascending triangle build in 3 session
About UK 100 Index
The UK Financial Times Stock Exchange 100 is an index of share prices of the largest 100 companies listed on the London Stock Exchange (LSE) by market capitalisation. The index was launched on January 3, 1984 at a base value of 1000, and the index level is calculated in real-time.
Related indices

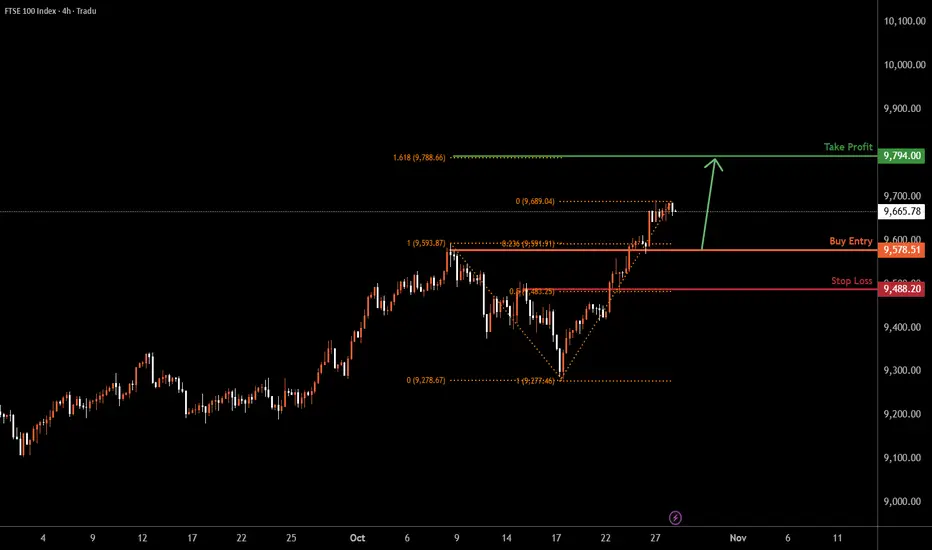
UK100 H4 | ullish Bounce off Pullback SupportUK100 is falling towards the buy entry, which is a pullback support that lines up with the 23.6% Fibonacci retracement and could bounce from this level to the upside.
Buy entry is at 9,578.51, which is a pullback support that aligns with the 23.6% Fibonacci retracement.
Stop loss is at 9,488.20, w
FTSE100 overbought consolidation capped at 9770The FTSE remains in a bullish trend, with recent price action showing signs of a breakout within the broader uptrend.
Support Zone: 9646 – a key level from previous consolidation. Price is currently testing or approaching this level.
A bullish rebound from 9646 would confirm ongoing upside momentu

FTSE breakout support at 9445The FTSE remains in a bullish trend, with recent price action showing signs of a breakout within the broader uptrend.
Support Zone: 9445 – a key level from previous consolidation. Price is currently testing or approaching this level.
A bullish rebound from 9445 would confirm ongoing upside momentu

UK100 - TIME TO KILL Team, yesterday we did well with the AUS200 short position. couple of times.
Today we focus on SHORTING THE UK100 AT THIS LEVEL 9515-22
STOP LOSS at 9580
Target 1 at 9486-72 - TAKE PARTIAL 50-70%
Target 2 at 9465-56
NOTE: Once the price below 9492, bring stop loss to BE
lets go

FTSE 100 Outlook: Twin Bullish Signals Point to Fresh HighsFresh record highs for the FTSE 100 contract may be on the cards, with consecutive bullish signals pointing to growing upside risks.
The first arrived on Friday with a hammer candle on the daily chart, rebounding strongly after testing the 50-day moving average. That was followed on Monday by anoth

FTSE 100 Wave Analysis – 20 October 2025
- FTSE 100 reversed from key support level 9330.00
- Likely to rise to resistance level 9600.00
FTSE 100 index recently reversed from the support area between the key support level 9330.00 (former strong resistance from August and September), 50% Fibonacci correction of the upward impulse from Se

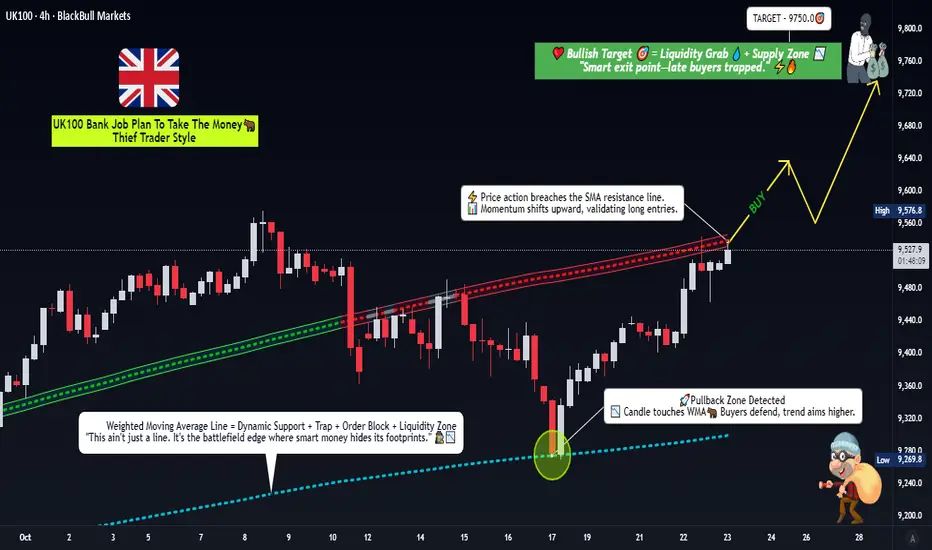
FTSE 100 Setup: Time to Go Long on This LSMA Breakout?🎯The UK100 "Capital Flow Heist" Blueprint 🚀 (Swing Trade Setup)
Buckle up, Thief Crew! 🏴☠️ We're plotting a bullish swing trade on the UK100, aiming to catch the next leg up. This isn't financial advice; it's a strategic blueprint for those who know how to handle the risk!
📈 The Master Plan (Analy
LSE: Losing IPO Volume, Gaining Strategic AutonomyIn the third quarter, the London Stock Exchange dropped out of the top 20 global IPO markets for the first time in many years, ranking 23rd in the Bloomberg rating . This is an unexpected turn for an exchange that has long ranked among the world's leading venues for public offerings and attracted c


See all ideas
Summarizing what the indicators are suggesting.
Oscillators
Neutral
SellBuy
Strong sellStrong buy
Strong sellSellNeutralBuyStrong buy
Oscillators
Neutral
SellBuy
Strong sellStrong buy
Strong sellSellNeutralBuyStrong buy
Summary
Neutral
SellBuy
Strong sellStrong buy
Strong sellSellNeutralBuyStrong buy
Summary
Neutral
SellBuy
Strong sellStrong buy
Strong sellSellNeutralBuyStrong buy
Summary
Neutral
SellBuy
Strong sellStrong buy
Strong sellSellNeutralBuyStrong buy
Moving Averages
Neutral
SellBuy
Strong sellStrong buy
Strong sellSellNeutralBuyStrong buy
Moving Averages
Neutral
SellBuy
Strong sellStrong buy
Strong sellSellNeutralBuyStrong buy
Displays a symbol's price movements over previous years to identify recurring trends.
Frequently Asked Questions
The current value of UK 100 Index is 9,717.24 GBP — it has fallen by −0.44% in the past 24 hours. Track the index more closely on the UK 100 Index chart.
UK 100 Index reached its highest quote on Oct 29, 2025 — 9,787.63 GBP. See more data on the UK 100 Index chart.
The lowest ever quote of UK 100 Index is 1,717.70 GBP. It was reached on Sep 9, 1988. See more data on the UK 100 Index chart.
UK 100 Index value has increased by 1.45% in the past week, since last month it has shown a 3.92% increase, and over the year it's increased by 19.09%. Keep track of all changes on the UK 100 Index chart.
The champion of UK 100 Index is LSE:FRES — it's gained 196.27% over the year.
The weakest component of UK 100 Index is LSE:WPP — it's lost −64.78% over the year.
UK 100 Index is just a number that lets you track performance of the instruments comprising the index, so you can't invest in it directly. But you can buy UK 100 Index futures or funds or invest in its components.
The UK 100 Index is comprised of 100 instruments including LSE:AZN, LSE:HSBA, LSE:SHEL and others. See the full list of UK 100 Index components to find more opportunities.