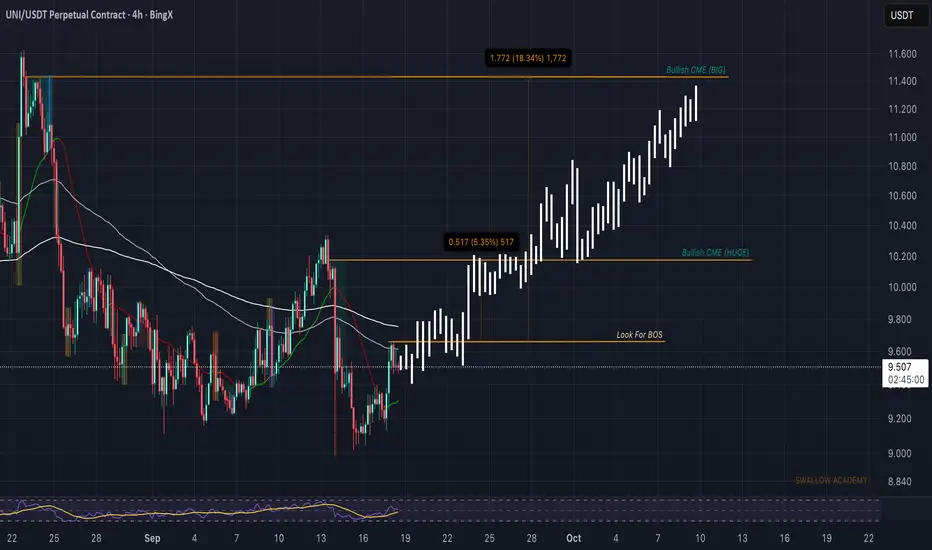
Uniswap (UNI): 2 Bullish CME Gaps To Fill SoonUNI update: we’re still waiting for a clean BOS. The bullish CME gaps are yet to be filled—first around 10.2 and the bigger one near 11.3–11.5.
As long as buyers defend the EMAs and we see that breakout, we’ll look for continuation into those levels. Patience is key here; the gameplan stays the sa
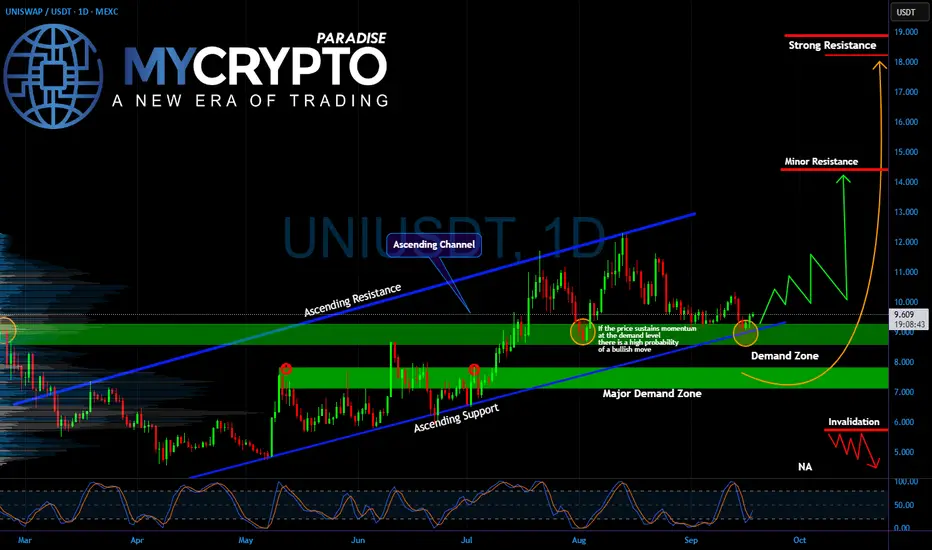
UNIUSDT About to Explode or Break Traders’ Dreams?Yello Paradisers, is #UNIUSDT quietly preparing for its next major rally, or are we sitting right on the edge of a painful trap for impatient traders? Let’s break it down.
💎#UNI has been holding within its ascending channel, bouncing consistently from its demand zone around $9–$9.50. Every retest o
$UNIPUMP Token Slumps, Leads Meme Coin Losses: Pump.fun’s native token, PUMP, recently slumped, leading losses among meme coins like Dogecoin, PEPE, and BONK, as the market stumbled.


UNIUSDT — Value Slips Under 9.35, Who Holds the Floor?UNI’s auction looks like a bar with a strict bouncer: every rally into 9.7 gets thrown out, while the crowd drifts back toward 9.2. Let’s map the value bands.
High Timeframes (Weekly → 2D → 12H)
– Weekly: Rejecting 10–11 supply. Demand 8.6–9.0, deeper 7.6–8.0.
– 2D: LH sequence into 9.0–9.3 floor.

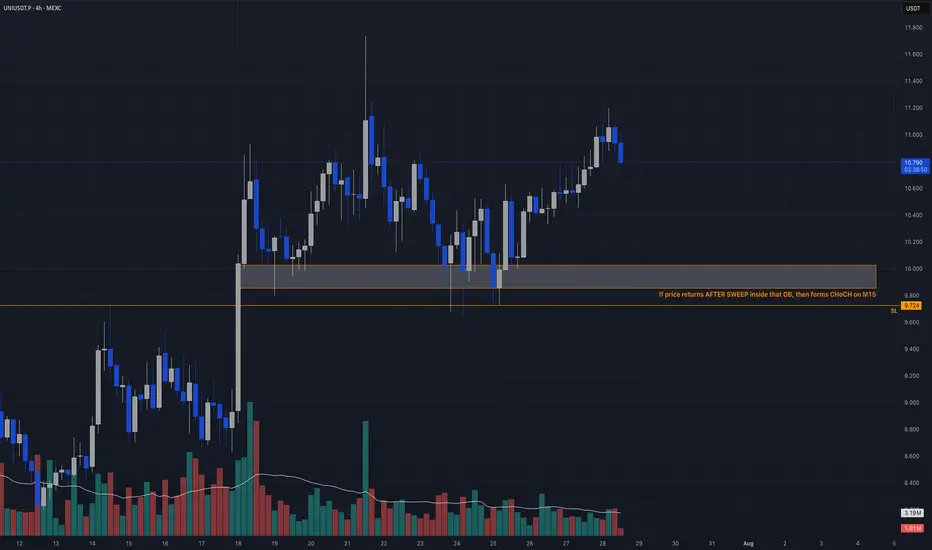
Liquidity Sweep + OB Retest → CHoCH TriggerCandle Craft fam — we’ve got a clean and calculated setup unfolding on UNIUSDT.P (4H). This one fits our criteria perfectly: structure, sweep, and planned trigger. No rush. We wait for the market to show its hand.
⸻
📈 Bias: Long
🧠 Strategy: Liquidity Sweep + OB Retest → CHoCH Trigger
📍 Entry Plan
UNI/USDT DISCOUNT ARRAY
DISCOUNT ARRAY
Price is inside a 4HR and DAILY FVG and seems to have found support
Sweep of origin bar low confirms a possible liquidity grab.

UNI UNI as of now looks very positive for the next days/week. Potentially I`ve mentioned two order blocks where we gonna be. NFA, DYOR

Uniswap (UNI): Has Really Good Potential To Grow 60%3 confirmations are here, which might lead to explosive movement. toward the local resistance area. R: R is good so let's see!
More in-depth info is in the video—enjoy!
Swallow Academy

UNI - LONG SET-UP BINANCE:UNIUSDT
UNI Long Set-up 📈
Looking good to Long Between 7.9 - 8.4 🔼
SL Below 7.2 or as per your risk capacity 🔽

See all ideas
Summarizing what the indicators are suggesting.
Oscillators
Neutral
SellBuy
Strong sellStrong buy
Strong sellSellNeutralBuyStrong buy
Oscillators
Neutral
SellBuy
Strong sellStrong buy
Strong sellSellNeutralBuyStrong buy
Summary
Neutral
SellBuy
Strong sellStrong buy
Strong sellSellNeutralBuyStrong buy
Summary
Neutral
SellBuy
Strong sellStrong buy
Strong sellSellNeutralBuyStrong buy
Summary
Neutral
SellBuy
Strong sellStrong buy
Strong sellSellNeutralBuyStrong buy
Moving Averages
Neutral
SellBuy
Strong sellStrong buy
Strong sellSellNeutralBuyStrong buy
Moving Averages
Neutral
SellBuy
Strong sellStrong buy
Strong sellSellNeutralBuyStrong buy
Displays a symbol's price movements over previous years to identify recurring trends.