UNIUSDT: Trend in 4-H time frameThe color levels are very accurate levels of support and resistance in different time frames, and we have to wait for their reaction in these areas.
So, Please pay special attention to the very accurate trend, colored levels, and you must know that SETUP is very sensitive.
Be careful
BEST
MT
Related pairs

UNI Looks Bearish (1H)From the point where we marked the red arrow on the chart, the UNISWAP correction has begun, and the pattern appears to be a diametric.
The best area for wave F to complete is the highlighted red zone. If the price reaches this zone, we will look for Sell/Short positions.
The stop-loss and targets

UNIUSDT Better Long Setups Coming...Patience PaysI'm seeing a lot of bullish setups and decided to give me two cents.
Current UNI/USDT price action is raising a red flag for potential long entries. History shows this specific Rate of Change (ROC) zone has often marked a local top.
Historic ROC Overbought: Every time the price has pushed into th

UNI 4H – Post-UNIfication consolidation longUniswap remains one of the key DEX protocols: TVL is around $4.5B and 30-day DEX volume is roughly $94.6B, which keeps Uniswap at the top of the sector by liquidity and fee generation.
Over the last 30 days UNI is up ~+22%, with a sharp acceleration in November (70%+ week) after the UNIfication pro

UNI SWAPHello friends
As you know and the news has spread, UNI has grown well, which indicates the arrival of buyers.
Now that the price is correcting, we have two scenarios:
The first scenario is that the price breaks the specified channel from here and moves to the specified targets.
The second scenario

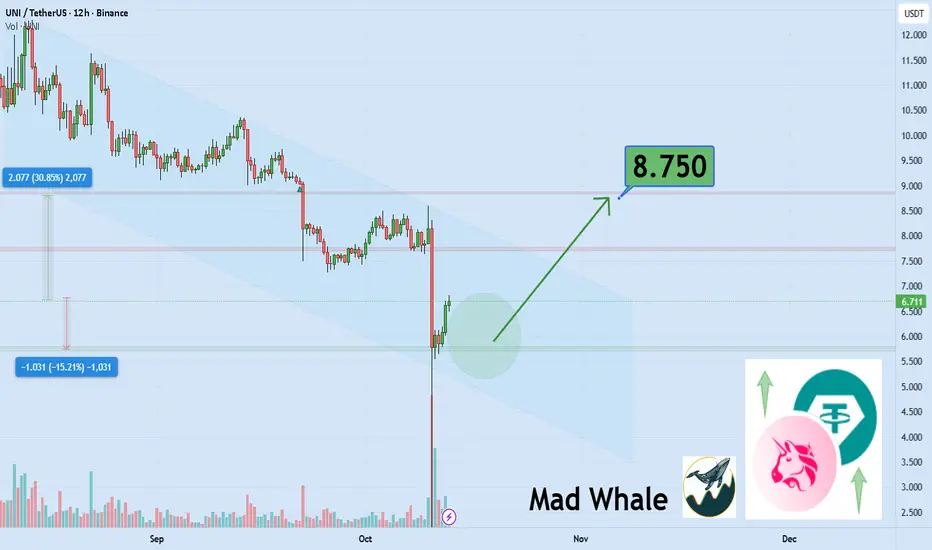
support area for Uni explosion of at least 30% gain to 8.75$hi
the support and resistances on the chart are based on the previous data and weekly candlesticks if BINANCE:UNIUSDT holds this last support the potential of 30% gain is logical toward 8.75$
UNI USDT LONG SIGNAL---
📢 Trade Signal: UNI/USDT
Type: Long
Entry: 7.466
---
🎯 Take-Profit Targets
TP1: 7.598
TP2: 7.830
TP3: 8.100
TP4: —
TP5: —
TP6: —
---
🛑 Stop-Loss
SL. 7.30
---
⏱ Timeframe
15m
---
⚖️ Risk/Reward
3.50
---
💥 Suggested Leverage
5× .10
---
🧠 Technical Outlook
UNI is for

UNIUSDT - The Best Going to Retest!The coin skyrocketed 45% in a single daily candle right after breaking out of the red rectangle.
That rectangle represents a major support zone on the chart — so as long as it’s pulling back, it’s likely just retesting that zone before starting a new bullish leg upward.
This area lines up with the

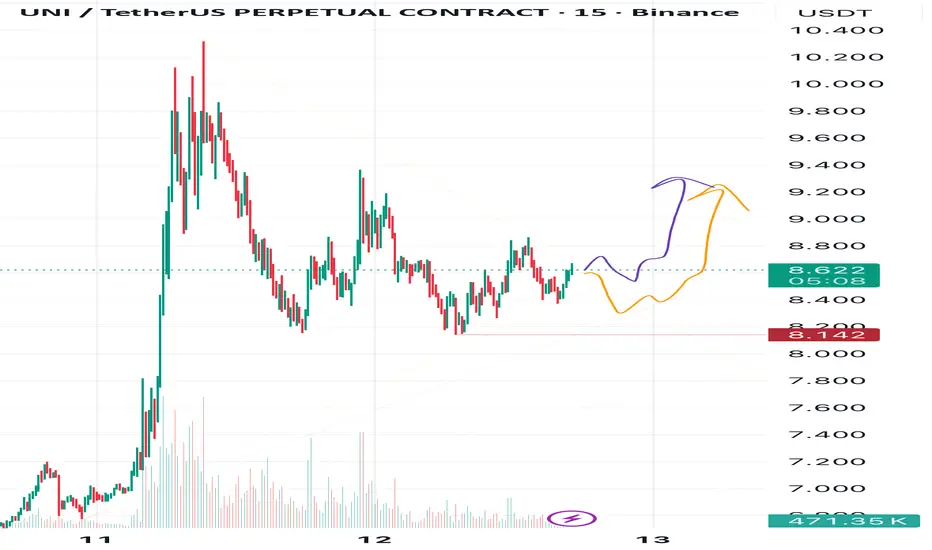
UNI Rising Soon — Triangle in TuneThe situation in UNI right now looks almost identical to what I recently showed in my post about NEAR.
We’re seeing a corrective triangle, and a breakout to the upside seems likely.
As always, I see two possible scenarios — shown by the orange and purple arrows on my chart.
🎯 Targets:
• Target 1:
UNI — Third Time’s the Charm?Wrapping up today with one more setup — UNI looks ready for a move lower. We’ve got a clean break of the trendline, structure turning bearish, and confluence across multiple signals pointing south.
I’m entering on the Fair Value Gap retracement, right after a one-candle pullback — keeping it tight

See all ideas
Summarizing what the indicators are suggesting.
Oscillators
Neutral
SellBuy
Strong sellStrong buy
Strong sellSellNeutralBuyStrong buy
Oscillators
Neutral
SellBuy
Strong sellStrong buy
Strong sellSellNeutralBuyStrong buy
Summary
Neutral
SellBuy
Strong sellStrong buy
Strong sellSellNeutralBuyStrong buy
Summary
Neutral
SellBuy
Strong sellStrong buy
Strong sellSellNeutralBuyStrong buy
Summary
Neutral
SellBuy
Strong sellStrong buy
Strong sellSellNeutralBuyStrong buy
Moving Averages
Neutral
SellBuy
Strong sellStrong buy
Strong sellSellNeutralBuyStrong buy
Moving Averages
Neutral
SellBuy
Strong sellStrong buy
Strong sellSellNeutralBuyStrong buy
Displays a symbol's price movements over previous years to identify recurring trends.
Frequently Asked Questions
The current price of UNI / UST (UNI) is 6.26820000 USDT — it has fallen −1.04% in the past 24 hours. Try placing this info into the context by checking out what coins are also gaining and losing at the moment and seeing UNI price chart.
UNI / UST price has fallen by −15.97% over the last week, its month performance shows a −0.26% decrease, and as for the last year, UNI / UST has decreased by −41.85%. See more dynamics on UNI price chart.
Keep track of coins' changes with our Crypto Coins Heatmap.
Keep track of coins' changes with our Crypto Coins Heatmap.
UNI / UST (UNI) reached its highest price on May 3, 2021 — it amounted to 44.95800000 USDT. Find more insights on the UNI price chart.
See the list of crypto gainers and choose what best fits your strategy.
See the list of crypto gainers and choose what best fits your strategy.
UNI / UST (UNI) reached the lowest price of 0.07903000 USDT on Oct 10, 2025. View more UNI / UST dynamics on the price chart.
See the list of crypto losers to find unexpected opportunities.
See the list of crypto losers to find unexpected opportunities.
The safest choice when buying UNI is to go to a well-known crypto exchange. Some of the popular names are Binance, Coinbase, Kraken. But you'll have to find a reliable broker and create an account first. You can trade UNI right from TradingView charts — just choose a broker and connect to your account.
Crypto markets are famous for their volatility, so one should study all the available stats before adding crypto assets to their portfolio. Very often it's technical analysis that comes in handy. We prepared technical ratings for UNI / UST (UNI): today its technical analysis shows the sell signal, and according to the 1 week rating UNI shows the strong sell signal. And you'd better dig deeper and study 1 month rating too — it's sell. Find inspiration in UNI / UST trading ideas and keep track of what's moving crypto markets with our crypto news feed.
UNI / UST (UNI) is just as reliable as any other crypto asset — this corner of the world market is highly volatile. Today, for instance, UNI / UST is estimated as 8.01% volatile. The only thing it means is that you must prepare and examine all available information before making a decision. And if you're not sure about UNI / UST, you can find more inspiration in our curated watchlists.
You can discuss UNI / UST (UNI) with other users in our public chats, Minds or in the comments to Ideas.