Last chance for SPX500USD to go upHi traders,
Last week SPX500USD dropped, went corrective up and dropped again.
The pattern changed. Now it could become an (orange) wave 4 Triangle (if it doesn't break the grey arrow) or it finished a Zigzag.
So next week we could see more (corrective or impulsive) upside for this pair.
Let's see what the market does and react.
Trade idea: Wait for a small correction down on a lower timeframe. After a change in orderflow to bullish you could trade longs.
This shared post is only my point of view on what could be the next move in this pair based on my technical analysis.
But I react and trade on what I see in the chart, not what I've predicted or expect.
Don't be emotional, just trade your plan!
Eduwave
Trade ideas

SPX500: Risk-On Sentiment Builds as Bulls Eye 6733SPX500 | Technical Overview
Global markets are riding a risk-on wave after a sudden jump in U.S. rate-cut expectations, triggered by dovish comments from several Federal Reserve officials.
However, gains may cool in Europe as FX markets remain alert to possible Bank of Japan yen intervention.
Geopolitics also added to market sentiment:
U.S. President Donald Trump described relations with China as “extremely strong” after his call with President Xi — reinforcing a short-term risk-on environment.
Technical Outlook
SPX500 is expected to retest the pivot zone near 6670–6705 before attempting another bullish extension.
Bullish Scenario:
After retesting the pivot, the price may push upward toward 6733, and if momentum holds, extend to 6771 and 6800.
Bearish Scenario:
A 1H candle close below 6670 will activate bearish pressure toward 6635, with further downside potential toward 6578.
Overall structure remains bullish as long as the price trades above the pivot zone.
Support: 6670 · 6635 · 6578
Resistance: 6733 · 6771 · 6800

S&P 500 Surges to Pivotal Resistance- Decision time for BullsThe S&P 500 has rallied nearly 3% off the monthly low and is approaching the first major test of the late-October downtrend. Resistance is eyed at 50% retracement of the decline at 6715 and is backed closely by the 61.8% retracement at 6764. A breach / daily close above the August trendline is needed to suggest a more significant low is in place with subsequent objectives eyed at the monthly open at 6842. Key resistance remains unchanged at 6911/986.
Support rests with the October low at 6500 and losses below this threshold would threaten resumption of the near-term downtrend with the next major technical consideration seen at 6408/21- a region defined by the 1.618% extension of the October decline and the 23.6% retracement of he yearly range. Look for a larger reaction there IF reached.
Bottom line: The S&P 500 is approaching downtrend resistance early in the week and the outlook remains tilted to the downside while within this formation. Look for a reaction into 6715 for guidance in the days ahead. From a trading standpoint, losses would need to be limited to the monthly low-day close / weekly open at 6574 IF price is heading for a breakout here with a breach above 6764 needed to fuel the next leg.

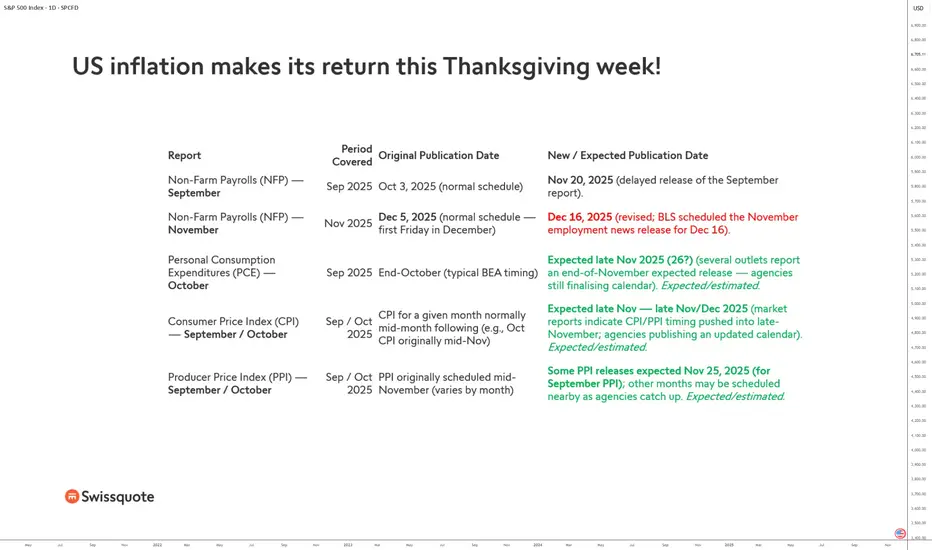
US inflation makes its return this Thanksgiving week!For several weeks, financial markets have been operating with reduced visibility. The reason: the latest U.S. shutdown, which paralyzed part of the federal administration and caused an exceptional delay in the publication of numerous major macroeconomic statistics. Yet these figures, usually released according to a precise schedule, form the analytical backbone for investors and for the Federal Reserve (Fed). The situation should finally normalize during this Thanksgiving week, with a long-awaited catch-up, particularly regarding PCE inflation, the Fed’s preferred inflation indicator.
One of the most notable delays concerns the Non-Farm Payrolls (NFP) series. The September report, originally scheduled for October 3, was only released last Thursday. The November report, normally published in early December, will not appear until December 16—after the Fed’s December 10 meeting. These delays are due to the need for U.S. statistical agencies to rebuild their data and validation processes after several weeks of forced shutdown.
But the central focus of market attention remains the PCE (Personal Consumption Expenditures) index for October, a key figure for anticipating the Fed’s monetary stance at its December 10 meeting. This report was expected at the end of October under the standard Bureau of Economic Analysis (BEA) timeline. Now, several converging sources indicate a release expected this week, likely on November 25 and 26, as agencies finalize their revised calendar. It is therefore during Thanksgiving week that investors will finally receive these crucial numbers.
The uncertainty does not end there. Consumer Price Index (CPI) and Producer Price Index (PPI) reports for September and October have also been delayed. Markets now anticipate publication “late November to early December,” giving agencies time to fully adjust their distribution processes.
Some components of the PPI, particularly for September, may be released as soon as November 25, with remaining figures following shortly after.
This major catch-up comes at a decisive moment. With the Fed set to decide on December 10 about a potential adjustment to its monetary policy, every inflation data point carries considerable weight. The PCE numbers, in particular, will provide a clearer snapshot of price dynamics during the autumn, and therefore of the central bank’s room for maneuver should it consider a 0.25% rate cut.
DISCLAIMER:
This content is intended for individuals who are familiar with financial markets and instruments and is for information purposes only. The presented idea (including market commentary, market data and observations) is not a work product of any research department of Swissquote or its affiliates. This material is intended to highlight market action and does not constitute investment, legal or tax advice. If you are a retail investor or lack experience in trading complex financial products, it is advisable to seek professional advice from licensed advisor before making any financial decisions.
This content is not intended to manipulate the market or encourage any specific financial behavior.
Swissquote makes no representation or warranty as to the quality, completeness, accuracy, comprehensiveness or non-infringement of such content. The views expressed are those of the consultant and are provided for educational purposes only. Any information provided relating to a product or market should not be construed as recommending an investment strategy or transaction. Past performance is not a guarantee of future results.
Swissquote and its employees and representatives shall in no event be held liable for any damages or losses arising directly or indirectly from decisions made on the basis of this content.
The use of any third-party brands or trademarks is for information only and does not imply endorsement by Swissquote, or that the trademark owner has authorised Swissquote to promote its products or services.
Swissquote is the marketing brand for the activities of Swissquote Bank Ltd (Switzerland) regulated by FINMA, Swissquote Capital Markets Limited regulated by CySEC (Cyprus), Swissquote Bank Europe SA (Luxembourg) regulated by the CSSF, Swissquote Ltd (UK) regulated by the FCA, Swissquote Financial Services (Malta) Ltd regulated by the Malta Financial Services Authority, Swissquote MEA Ltd. (UAE) regulated by the Dubai Financial Services Authority, Swissquote Pte Ltd (Singapore) regulated by the Monetary Authority of Singapore, Swissquote Asia Limited (Hong Kong) licensed by the Hong Kong Securities and Futures Commission (SFC) and Swissquote South Africa (Pty) Ltd supervised by the FSCA.
Products and services of Swissquote are only intended for those permitted to receive them under local law.
All investments carry a degree of risk. The risk of loss in trading or holding financial instruments can be substantial. The value of financial instruments, including but not limited to stocks, bonds, cryptocurrencies, and other assets, can fluctuate both upwards and downwards. There is a significant risk of financial loss when buying, selling, holding, staking, or investing in these instruments. SQBE makes no recommendations regarding any specific investment, transaction, or the use of any particular investment strategy.
CFDs are complex instruments and come with a high risk of losing money rapidly due to leverage. The vast majority of retail client accounts suffer capital losses when trading in CFDs. You should consider whether you understand how CFDs work and whether you can afford to take the high risk of losing your money.
Digital Assets are unregulated in most countries and consumer protection rules may not apply. As highly volatile speculative investments, Digital Assets are not suitable for investors without a high-risk tolerance. Make sure you understand each Digital Asset before you trade.
Cryptocurrencies are not considered legal tender in some jurisdictions and are subject to regulatory uncertainties.
The use of Internet-based systems can involve high risks, including, but not limited to, fraud, cyber-attacks, network and communication failures, as well as identity theft and phishing attacks related to crypto-assets.
Bear Case for DecemberBear Case for December.
Looking for the sell off to continue.
Decent R/R with a clear "stop" level above us.

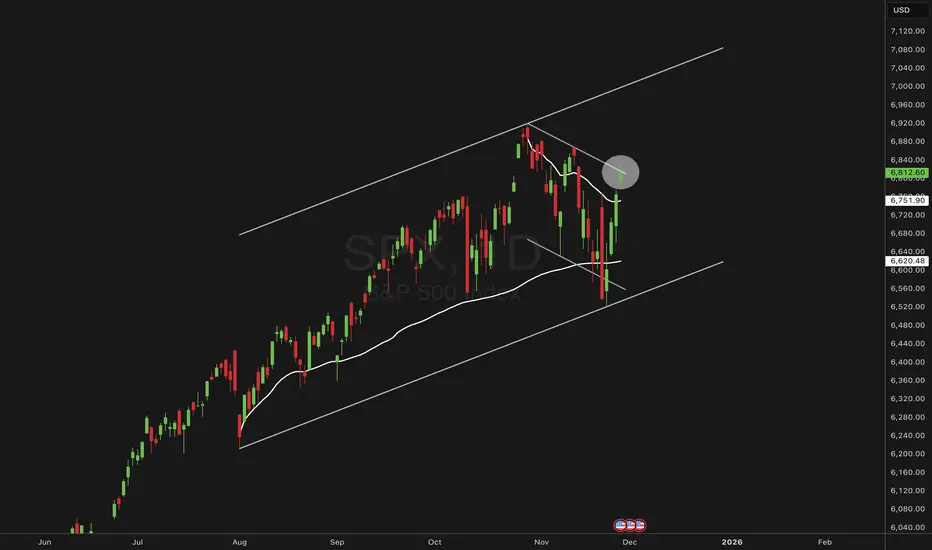
SPX | Testing the Upper Flag Line After AVWAP Shifts The index has steadied as broader sentiment firms, with markets leaning on softer inflation trends and a more patient Federal Reserve tone. That backdrop has helped risk appetite rotate back into equities after the recent pullback.
Technical Lens:
The chart shows SPX rebounding cleanly from the lower boundary of its broader bullish channel, which also aligns with the anchored VWAP drawn from the August 2025 swing low. That confluence provided a strong reaction zone. Price has since pushed through the anchored
VWAP set from the 29 October high, suggesting momentum is shifting back towards the upper side of the structure. The index now sits just beneath the upper boundary of the short-term bull flag, and this zone becomes an important area to monitor as it acts as the immediate ceiling.
Scenarios:
If the upper flag line gives way, the move could open room for continuation along the channel towards the next structural resistance zones.
If the flag line holds, the market may consolidate or retest the mid-channel levels, with the prior AVWAPs acting as nearby reference points.
Catalysts:
US GDP revisions, PCE inflation data and major tech earnings later this week may be the triggers that decide whether the index pushes through or pauses here.
Takeaway:
This upper flag boundary is the key inflection point for SPX, with the anchored VWAP shifts helping define the directional bias.
S&P 500 – Upside TargetDow Jones & S&P 500 – Testing Key Support After a One-Month Decline
Both the Dow Jones and the S&P 500 have pulled back over the past month and are now approaching a significant support area. This zone continues to attract the attention of investors, indicating that demand remains strong despite recent weakness.
Based on the current order flow and buying interest seen in the market, the broader long-term trend for both indices still appears bullish.
S&P 500 – Upside Target
For the S&P 500, the first major upside target is located near 7000, and there is a strong possibility that price could reach this level within the next month if buying pressure continues.
Sasha Charkhchian

SPX Gann boxSPX is currently turning bearish and its second motive wave of maximum 3 or 4 motive ways down according to wave count. We finished 1st wave of second bigger wave and its consolidation and are now in 2nd wave of 2nd bigger wave. Gann Box gives us time and price targets relative to length and duration of the first wave for SPX second wave down.
i highlited upcoming fibs and strong horizontal resistance. Astonishingly they fit perfectly together.


US500 Bullish Structure: Pullback → Breakout Continuation📈 SPX500/US500 Bullish Breakout Setup | Swing Trade Opportunity 🎯
🔥 Market Overview
Asset: S&P 500 Cash CFD (SPX500/US500)
Trade Type: Swing Trade (Medium-term)
Bias: BULLISH ✅
Current Price: ~$6,614 (Nov 20, 2025)
📊 Trade Setup & Technical Analysis
🎯 Strategy Confirmation
✅ Weighted Moving Average Pullback pattern confirmed
✅ Price consolidating near key resistance zone
✅ Bullish structure intact above major support levels
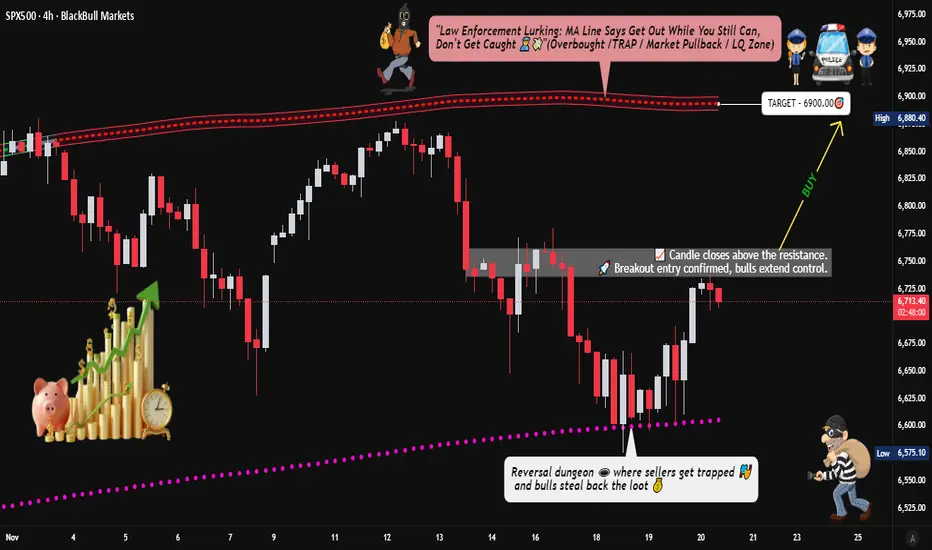
🚀 Entry Strategy
Breakout Entry: Enter AFTER confirmed breakout above $6,750 resistance
Wait for price to close above $6,750 with strong volume
Avoid premature entries; confirmation is key
Multiple position sizing recommended after breakout validation
🛑 Stop Loss Considerations
Suggested SL: $6,630 area
⚠️ IMPORTANT: This is a reference level only. Adjust your stop loss based on:
Your personal risk tolerance
Account size and position sizing
Trading strategy requirements
Trade at your own risk – customize stops to fit YOUR plan
🎯 Target Zones
Primary Target: $6,900-$6,950 zone
📌 Key Resistance Factors at Target:
Moving Average confluence acting as resistance barrier
Potential overbought conditions expected
Historical supply zone overlap
Risk of bull traps in this region
⚠️ Profit-Taking Strategy:
Consider scaling out near $6,900
Lock partial profits before $6,950
Trail stops for remaining position
This is YOUR trade – take profits when YOUR strategy signals
💰 Related Assets to Monitor
📉 Correlated US Indices
NASDAQ 100 (NAS100/US100) 📱
Tech-heavy index; leads SPX during risk-on moves
Correlation: ~85-90% positive
Key Level: Watch $21,000 breakout zone
DOW JONES 30 (US30) 🏭
Blue-chip indicator; confirms broad market strength
Correlation: ~80-85% positive
Key Level: $44,500 resistance critical
RUSSELL 2000 (US2000) 🏢
Small-cap indicator; risk sentiment gauge
Correlation: ~70-75% positive
Key Level: $2,400 breakout = bullish confirmation
💵 Dollar Correlation
US DOLLAR INDEX (DXY/USDX) 💵
Correlation: ~60-70% INVERSE (negative)
Dollar weakness = SPX strength typically
Key Level: Watch $106.50 support; break = SPX boost
🌍 Global Risk Assets
VOLATILITY INDEX (VIX) ⚡
Correlation: ~80% INVERSE (fear gauge)
VIX below $15 = bullish SPX environment
VIX spike above $20 = caution signal
GOLD (XAUUSD) 🥇
Correlation: Variable ~30-40% (flight to safety indicator)
Gold weakness + SPX strength = risk-on confirmed
📋 Risk Disclosure
⚠️ CRITICAL REMINDERS:
I am NOT providing financial advice
These levels are reference points only
YOU must determine your own entry, stop loss, and take profit levels
Trade with money you can afford to lose
Market conditions change rapidly – adapt accordingly
Past performance does not guarantee future results
🎓 Professional Risk Management:
Never risk more than 1-2% of capital per trade
Use proper position sizing calculators
Set alerts for key levels, don't watch charts 24/7
Have a written trading plan before entering
🔔 Action Plan Checklist
✅ Monitor price action near $6,750
✅ Confirm breakout with volume and candle close
✅ Set alerts for correlated assets (DXY, VIX, NAS100)
✅ Calculate position size based on YOUR risk tolerance
✅ Define exit strategy BEFORE entry
✅ Review market news and economic calendar
💬 Final Thoughts
This setup offers a risk-defined swing trade opportunity on the S&P 500 with clear technical levels. The weighted moving average pullback pattern provides structural support for the bullish thesis, while the $6,750 breakout level offers a defined entry trigger.
Remember: Markets are unpredictable. This analysis is educational and reflects technical observations only. YOUR trading decisions are YOUR responsibility.
🙏 Trade Safe, Trade Smart
If this analysis helps you, drop a like 👍 and follow for more setups! Let's build wealth together responsibly.
#SPX500 #SP500 #US500 #SwingTrade #Breakout #TechnicalAnalysis #StockMarket #Trading #ForexTrading #IndexTrading #BullishSetup #TradingView #MarketAnalysis
S&P 500 to print final move to 6500It goes without saying, this bull market has been the most hated I’ve ever known. Retail traders attempts to go “short” on every leg up resulted in quick squeezes. Every 1% to 4% correction brought renewed calls for the end of all things. Including time I believe. There is a reason why 90% of market participants fail in trading. Emotions.
The last four long ideas published by Without Worries are linked below. Read the comments in each to get an impression of the distain retail traders have for this bull market. The Cup and Handle idea for example, published on November 9th 2023. Many reading the idea were understandably skeptic. I tell you that to tell you this... The idea was much more than a chart pattern. The idea included studies from Dollar index and more importantly market sentiment.
So lets focus on those two in a little more detail.
** Market sentiment **
The market sentiment in November last was incredibly bearish. The Put/Call ratio was sky rocketing, in other words retail traders were all “short” on the market. That was a mistake. Guess what? They're doing it again.
Weekly Put/Call ratio
If you follow my practices you’ll know one of our golden rules, we never never long into active resistance. Just don’t. Don’t even think about it.
On the above weekly Put/Call chart we can see retail traders are betting heavily with both feet for a market correction as the Put/Call ratio shows a strong demand for “Short” contracts. We can see RSI is actively rallying into resistance. Oh dear…
** The dollar index **
The dollar has entered a bull market. Or so it appears. On the 2-day chart below price action has printed a Life Cross with the index trading above the 2-day/200 sma.
However on closer inspection just as in late 2022 and indeed late 2023, both price action and RSI support have failed. This will be a short lived bull market, for now.
Support and resistance is the ultimate cheat code. It has been integral to the previous ideas shared. It amazes how many continue to dismiss the importance of practicing this simple concept. Look left.
2-day DXY
** The conclusion **
On the above monthly chart several technical developments have occurred. Together with market sentiment and dollar index structure, the combination provides a powerful message.
The red arrows highlight each significant market top over the last 10 years when sentiment was incredibly bullish. The blue arrows record sentiment at extreme bearish levels.
Here’s the interesting part, when sentiment was this bearish price action was already at the lower half of the rising channel. There is not an instance when a rise from lower to higher half of the channel with confirmation of support (we’ve confirmed) did not result in a resistance test at the top of the channel.
The resistance is now between 6500 and 6700.
Is it possible the market collapses like many retail traders are now calling for? Sure.
Is it probable? No.
Ww
** previous S&P 500 ideas **
S&P 500 - Cup and Handle
S&P 500 - Why everyone is wrong
S&P 500 - Why everyone is wrong - Part II
S&P 500 to 6000

S&P500 close to confirming the new Bear Cycle.The S&P500 index (SPX) broke below its 1D MA50 again yesterday (even closed the day below) and is showing clear signs of weakness at least for the short-term.
This can't be ignored as it may be transferred to the long-term time-frames where the market has been forming a Bearish Divergence on its 1W RSI since October 27. RSI Lower Highs against the market's Higher Highs.
This is similar to the November 15 2021 1W RSI Bearish Divergence, which led to one last quick rally and 1.5 month later the Bull Cycle topped and the 2022 inflation crisis Bear Cycle started.
The signal was given by a weekly closing below the 1D MA100 (red trend-line), which has been the market's natural Support in the past 5 months and also during every major Bullish Leg of the Bull Cycle.
As a result, if the index closes a 1W candle below its 1D MA100, we will call the start of a new Bear Cycle, potentially aiming for the 1W MA200 (orange trend-line), which is where the 2022 Bear Cycle bottomed after a -27.62% correction. Our Target Zone for the next long-term buying will be 5300 - 5000, assuming the top is already in. If not, the -27.62% decline will be re-adjusted to the new top.
---
** Please LIKE 👍, FOLLOW ✅, SHARE 🙌 and COMMENT ✍ if you enjoy this idea! Also share your ideas and charts in the comments section below! This is best way to keep it relevant, support us, keep the content here free and allow the idea to reach as many people as possible. **
---
💸💸💸💸💸💸
👇 👇 👇 👇 👇 👇

Past Resistance = Future Support: Winter 2025-2026 Rally Coming!Past Resistance = Future Support: Winter 2025-2026 Rally Coming!
This video discusses technical reasons why a winter rally is forthcoming; and why market fears are only that; 'pivots' toward the growth of the US economy and new all time highs.

S&P 500 Reversal Roadmap: Second Bottom Forming at PRZ?As I expected in the previous idea , the S&P 500 index has indeed reached its targets after breaking through the Support lines .
Currently, the S&P 500 is approaching the Support zone($6,580_$6,490) , Potential Reversal Zone (PRZ) , and the 100_SMA(Daily) .
There’s a possibility of forming a second bottom and a descending channel in the S&P 500, suggesting that the second bottom could form near the PRZ .
From an Elliott Wave perspective, it seems that the S&P 500 is completing the microwave 5 of the microwave C of the main wave Y .
I expect that, after entering the PRZ or approaching the 100_SMA(Daily) , the S&P 500 will resume its upward movement and potentially rise to around $6,664 .
Note: The S&P 500 currently has a significant impact on the markets, especially cryptocurrencies like Bitcoin( BINANCE:BTCUSDT ). Therefore, a potential rise in the S&P 500 could positively influence Bitcoin as well.
First Target: $6,664
Second Target: $6,723
Stop Los(SL): $6,499
Please respect each other's ideas and express them politely if you agree or disagree.
S&P 500 Index Analyze (SPX500USD), 1-hour time frame.
Be sure to follow the updated ideas.
Do not forget to put a Stop loss for your positions (For every position you want to open).
Please follow your strategy and updates; this is just my Idea, and I will gladly see your ideas in this post.
Please do not forget the ✅' like '✅ button 🙏😊 & Share it with your friends; thanks, and Trade safe.

Brace for Impact (I hope I am wrong)This market is reminiscent of the action before the 2020 crash. Above is now and below is 2020 covid crash. The charts are self explanatory so not much for me to say.
This is not a financial advice but for entertainment only. Please do your research!

SPX500 ShortHello traders,
I am expecting the SPX500 to see a potential 20% correction. Current sentiment appears mixed while valuations remain elevated, which increases downside risk. This view also aligns with the technical setup:
On the weekly timeframe, price is respecting a well-defined channel.
On the daily timeframe, a double-top pattern has just formed, suggesting possible trend exhaustion.
Not financial advice, just sharing my market perspective.

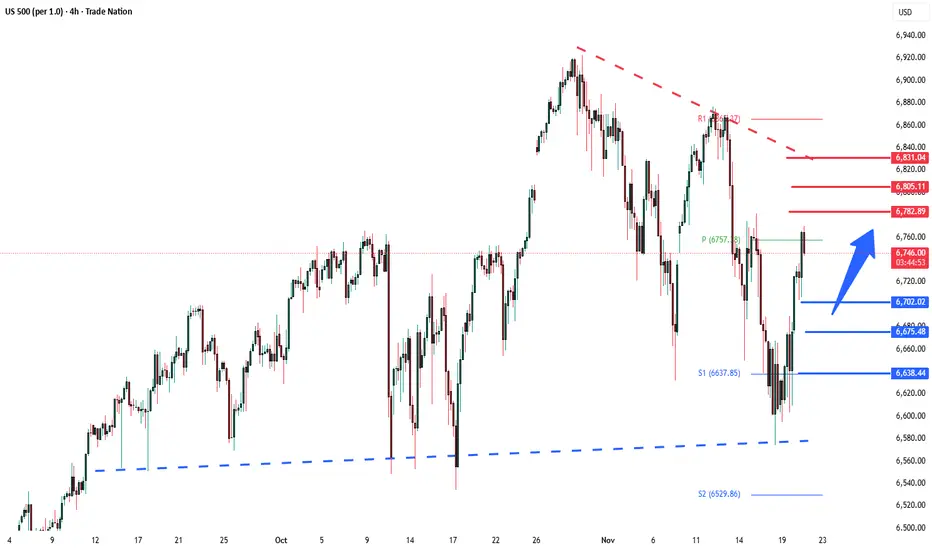
S&P500 Key Trading LevelsKey Support and Resistance Levels
Resistance Level 1: 6780
Resistance Level 2: 6805
Resistance Level 3: 6830
Support Level 1: 6700
Support Level 2: 6675
Support Level 3: 6638
This communication is for informational purposes only and should not be viewed as any form of recommendation as to a particular course of action or as investment advice. It is not intended as an offer or solicitation for the purchase or sale of any financial instrument or as an official confirmation of any transaction. Opinions, estimates and assumptions expressed herein are made as of the date of this communication and are subject to change without notice. This communication has been prepared based upon information, including market prices, data and other information, believed to be reliable; however, Trade Nation does not warrant its completeness or accuracy. All market prices and market data contained in or attached to this communication are indicative and subject to change without notice.
SPX500 Breakdown Warning: Major Supports— Bigger Crash Ahead?The S&P 500 index ( SP:SPX ) has become increasingly significant recently, and it has a notable impact on cryptocurrency markets, especially Bitcoin ( BINANCE:BTCUSDT ). Therefore, analyzing the S&P 500 not only benefits its own market but also enhances our understanding of related markets.
Fundamental Analysis:
Volume confirms distribution, while the ongoing U.S. government shutdown delays critical data (CPI, PPI), fueling uncertainty and risk-off sentiment. Fed’s hawkish pause on rate cuts and tech sector rotation (TSLA -6%( NASDAQ:TSLA ), NVDA -3.5%( NASDAQ:NVDA )) reinforce bearish momentum. Also, YTD performance now -3.2% in November — on pace for the worst monthly drop since 2008 (-7.5%
Technical Analysis:
From a technical perspective, the S&P 500 index is breaking the Support zone($6,773_$6,710) and moving near the Support lines and 50_SMA(Daily) . Given recent data, there’s a possibility that these supports may break.
Additionally, according to Elliott Wave Theory , we can expect more corrective waves ahead.
I expect the SPX500 index to decline to $6,633 after the support cluster is broken in the first step.
First Target: $6,633
Second Target: $6,583
Stop Los(SL): $6,815
Please respect each other's ideas and express them politely if you agree or disagree.
S&P 500 Index Analyze (SPX500USD), 4-hour time frame.
Be sure to follow the updated ideas.
Do not forget to put a Stop loss for your positions (For every position you want to open).
Please follow your strategy and updates; this is just my Idea, and I will gladly see your ideas in this post.
Please do not forget the ✅' like '✅ button 🙏😊 & Share it with your friends; thanks, and Trade safe.

SPY in consolidationNothing to report as yet. Looks like a correction, nothing telling me it's a bottom. We could have some drop and pop type moves, so be careful. Gold looks like it will go higher so far. Oil probably goes lower to test it's lows. BTC hit 82k target but could easily fall to 73k. MJ stocks look interesting around here, so I'm wondering if there will be news to legalize soon.

SPX500 – Key Levels After 3.5% Drop | Bearish Below 6578SPX500 | OVERVIEW
U.S. index futures declined as Nasdaq and S&P500 faced renewed selling pressure, with tech names — including Nvidia — continuing to weaken after Thursday’s sharp drop.
Concerns over stretched valuations remain a key driver of the pullback.
SPX500 – Market Outlook | Bearish Below 6578
SPX500 and Nasdaq futures fell again as tech stocks remain under pressure following Thursday’s selloff. Market sentiment continues to weaken due to concerns over stretched valuations.
Below 6578: Bearish continuation toward 6510 → 6425
Above 6578 (1H close): Short-term correction toward 6610 → 6635
Pivot: 6578
Support: 6510 · 6425
Resistance: 6610 · 6635
SPX500 stays bearish as long as price remains below the pivot. A break above 6578 would only allow a short correction, not a trend reversal.
previous idea:

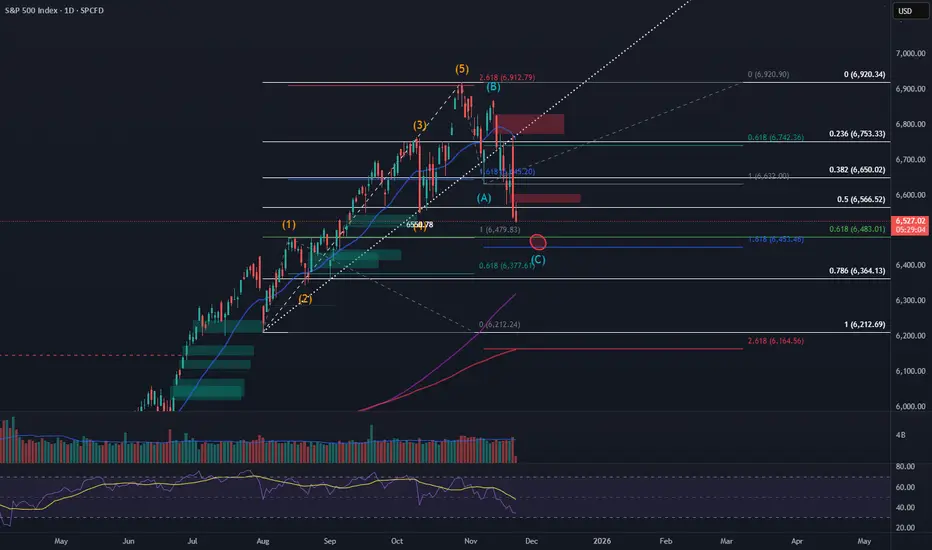
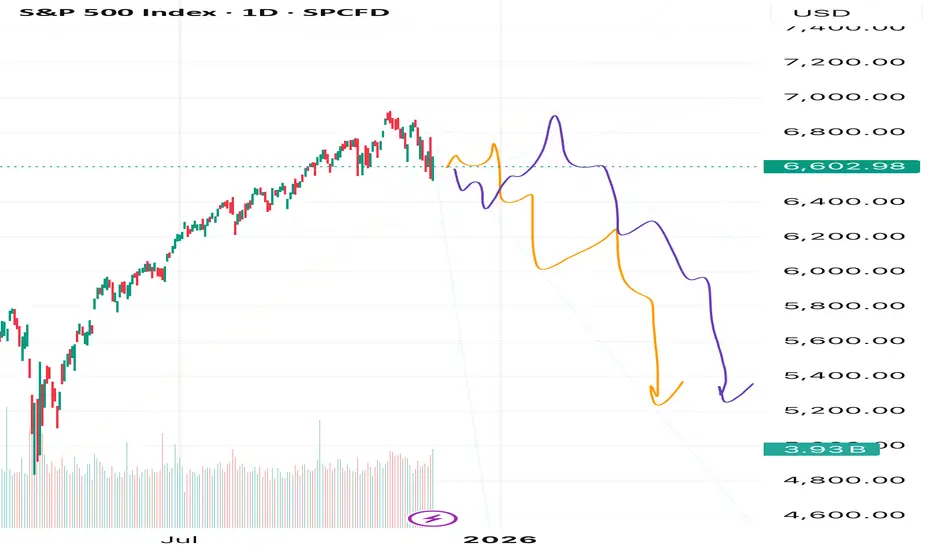
A Historic Shift in the S&P 500 Is BeginningFriends, in my view, the unstoppable rally in the S&P 500 has finally come to an end. The market has completed a massive five-wave structure with an extended fifth wave — and now we’re witnessing a historic moment as an exceptionally large correction begins.
As always, I’m watching two possible scenarios: the orange path and the purple path. But despite their differences, both point to the same outcome — my target at 5200. And that’s only the first target out of several.
Make sure to follow and subscribe, so you don’t miss the upcoming updates and deeper breakdowns.
This is just my personal market outlook — not financial advice. More updates coming soon.
SPY - likely lower into next weekCorrection of yesterday's strong down move is likely close to being over here. Gold also looks like it will drop and probably hard. Oil, probably lower. BTC lower.

SPX Corrective Wave C Approaching Key Fibonacci ConfluenceThe S&P 500 appears to be completing an A–B–C corrective structure following the recent top. Price is currently breaking below wave (A) and moving toward a strong confluence zone at the 0.618–1.618 Fibonacci levels. This area aligns with prior demand, trendline support, and measured targets, making it a potential reversal zone for wave (C). Watching for bullish reaction or confirmation before considering upside continuation.