De-Globalization and Globalization: Role in the Trade Market1. What Is Globalization?
Globalization refers to the increasing interconnectedness of countries through trade, capital flows, technology, labor mobility, and communication networks. It removes barriers between nations by promoting:
Free trade agreements
Cross-border investments
Multinational corporations expanding globally
Technology transfer and innovation diffusion
Movement of goods, services, and people
Key Drivers of Globalization
Trade Liberalization: Reduction of tariffs and quotas by organizations like WTO.
Advances in Technology: Internet, logistics, digital payments, AI.
Global Supply Chains: Production spread across multiple countries.
Capital Mobility: Foreign direct investment (FDI), foreign portfolio investment (FPI).
Transportation Efficiency: Low-cost shipping, aviation growth.
Benefits of Globalization
Lower cost of goods and services.
Higher economic growth for emerging markets.
Access to global markets for domestic producers.
Innovation through global competition.
Greater consumer choices.
Challenges of Globalization
Job losses in industries exposed to global competition.
Income inequality within countries.
Over-dependence on global supply chains.
Faster transmission of economic crises.
Despite these challenges, globalization dominated world trade through the 1990s and early 2000s, shaping a highly interconnected economic landscape.
2. What Is De-Globalization?
De-globalization refers to the process of reducing global interdependence. It involves countries restricting trade, limiting foreign investments, reshoring manufacturing, and prioritizing domestic production over global integration.
The shift began with economic nationalism and strengthened due to several global events:
Key Causes of De-Globalization
Geopolitical Tensions:
US–China trade war, Russia-Ukraine conflict, Middle-East instability.
Supply-Chain Vulnerabilities:
COVID-19 exposed heavy reliance on foreign manufacturing.
Protectionism:
Rising tariffs, import bans, and industrial subsidies.
National Security Concerns:
Restrictions on semiconductor exports, defense technologies, and data.
Energy and Food Security Risks:
Nations prioritize domestic reserves to avoid shortages.
Characteristics of De-Globalization
Regionalization of trade (Asia-centric, EU-centric, US-centric blocs).
Friend-shoring and near-shoring instead of global sourcing.
Declining share of global trade in GDP.
Stricter FDI regulations.
Rise of self-reliance policies—e.g., India’s Atmanirbhar Bharat.
Impact of De-Globalization
Higher manufacturing costs.
Slower global GDP growth.
Volatile commodity and currency markets.
Strategic competition between major economies.
De-globalization does not mean an end to global trade—it indicates a restructuring toward secure and region-based trade networks.
3. Role of Globalization in the Trade Market
Globalization has been the backbone of the modern trade market for 30+ years. Its influence can be identified in multiple areas:
(a) Expansion of International Trade
Countries specialized based on comparative advantage:
China in manufacturing
India in IT services
Middle East in oil
USA in technology and finance
This specialization increased global efficiency and lowered production costs.
(b) Growth of Multinational Corporations (MNCs)
Companies like Apple, Toyota, Samsung, and Unilever built supply chains across continents, boosting cross-border trade and investments.
(c) Deep Supply Chains
Products became globally integrated.
Example: A smartphone may involve design in the US, chips from Taiwan, assembly in China, and software from India.
Such supply-chain integration increased trade volume significantly.
(d) Increased Capital Flows
Globalization enabled investors to diversify by investing in foreign stocks, bonds, and real estate. It boosted foreign direct investment (FDI) and global liquidity.
(e) Boost to Emerging Markets
Countries like India, China, Vietnam, and Indonesia benefitted from export-led growth, attracting foreign companies and creating millions of jobs.
(f) Lower Prices & Higher Consumer Choice
Global competition reduced product costs, giving consumers access to global brands at affordable prices.
4. Role of De-Globalization in the Trade Market
De-globalization has introduced new dynamics that reshape how global trade functions.
(a) Rise of Protectionism
Countries impose tariffs to protect local industries.
Examples:
US tariffs on Chinese steel and electronics
India’s import restrictions on certain electronics to promote local manufacturing
This reduces global trade flows and pushes countries toward self-reliance.
(b) Reshoring Manufacturing
Companies move factories closer to home markets to avoid supply disruptions.
This impacts trade routes and reduces dependency on distant suppliers.
(c) Regional Trade Blocs
ASEAN, EU, USMCA, and African Continental Free Trade Area (AfCFTA) are forming tighter regional trading networks.
Trade becomes more regionalized rather than global.
(d) Geopolitical Trade Wars
Strategic competition, especially US–China, impacts:
Semiconductor exports
Technology transfer
Patents and IP laws
Digital trade regulations
Such restrictions create uncertainty in global trade.
(e) Commodity & Energy Security
Nations stockpile oil, gas, and minerals to ensure autonomy.
This leads to price volatility and new trade corridors like India importing discounted oil from Russia.
5. Combined Impact on Global Trade Markets
The world is entering a hybrid phase—neither fully globalized nor fully de-globalized.
Key Trends Shaping the Future
Shift from globalization to regionalization but not complete isolation.
Digital globalization continues through data, software, AI, and digital payments.
Supply-chain diversification reduces over-reliance on any single country.
Strategic industries (chips, defense, energy) remain highly protected.
Developing countries like India, Vietnam, and Mexico gain new manufacturing opportunities.
Winners in This Transition
Countries offering supply-chain stability
Nations with strong digital and technology ecosystems
Economies able to balance both global and domestic trade strategies
Losers
Countries dependent on single-market exports
Economies heavily reliant on cheap manufacturing
Nations vulnerable to geopolitical conflicts
Conclusion
Globalization and de-globalization are not absolute states but two ends of a spectrum continually shaping the world economy. Globalization promoted trade expansion, innovation, economic growth, and international cooperation. De-globalization emerged as a corrective phase to address vulnerabilities exposed by global tensions, supply-chain crises, pandemics, and national security threats.
The modern trade market is now characterized by a blend of globalization’s connectivity and de-globalization’s strategic caution. Countries are trading more selectively, focusing on trusted partners, secure supply chains, and balanced economic policies. Going ahead, the world is likely to embrace “smart globalization,” where nations seek benefits of global trade while protecting their strategic interests.
Trade ideas
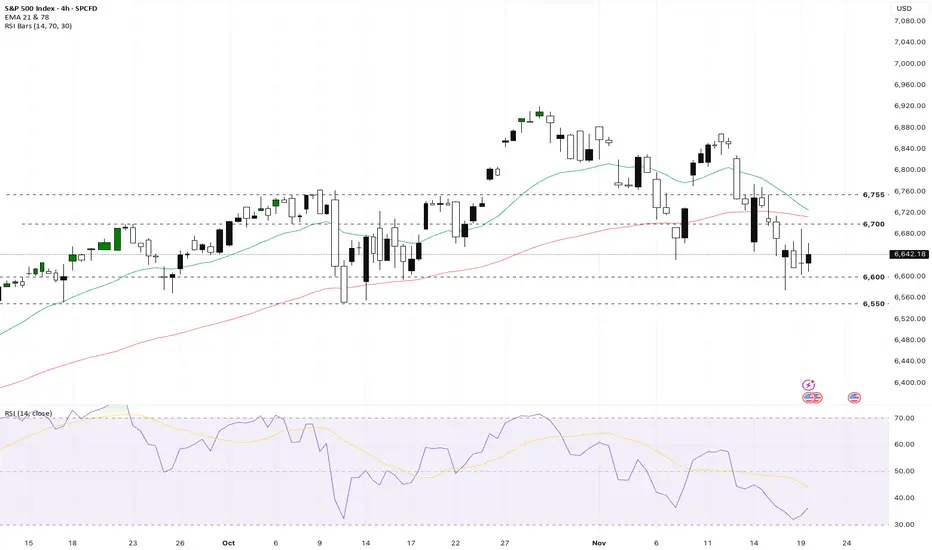
S&P 500 — Double Top Setup by FRLThe market remains in an uptrend, but FRL highlights a critical moment.
Price is testing the origin of the last impulse — the key FRL level that separates continuation from reversal.
A confirmed close below this level will complete the double-top formation and shift the trend into a corrective phase.
If confirmation comes, the natural FRL target lies at the 0.618 retracement, which aligns with the 200-day SMA — a strong confluence support.
Previous similar FRL setup (fully played out):
Nasdaq 100: Double Top or Double Bottom? (FRL Setup)

US500 Post-Nvidia Earnings: A Cautiously Optimistic RevivalThe release of Nvidia's robust quarterly earnings will serve as a critical pivot point for the US500, temporarily dispelling acute market anxieties that led to a recent four day losing streak. The overall outlook shifts from one of pre-earnings jitteriness and valuation concerns to cautious optimism driven by fundamental strength in the dominant tech sector.
Fundamental Analysis: AI Momentum Validated
The core of the market's positive reaction lies in the fundamental validation of the Artificial Intelligence (AI) mega-trend, which Nvidia remains the central, high-beta bellwether for.
Robust Financial Performance: Nvidia is expected to deliver a significant beat, reporting Q3 revenue of $54.9 billion, a staggering 57% year-over-year increase and providing bullish Q4 guidance of $62.2 billion in projected revenue, alongside strong EPS.
Sector Wide Relief: These numbers directly address the market's key worry, whether the elevated valuations of tech stocks, particularly those linked to AI, were justified. The massive revenue and growth trajectory from the AI chip leader suggests that the capital expenditure cycle in data centers and AI infrastructure remains incredibly strong.
The Valuation Dilemma: While the results provide support, the broader US500's valuation remains elevated at approximately 25 times earnings. This suggests that while the growth engine of AI/Tech is firing on all cylinders, the market's pricing leaves little room for error. The fundamental analysis suggests that the current rally must be consistently backed by strong economic data or further aggressive growth from the largest companies.
Technical Analysis: Battle at Resistance
The price action of the US500 suggests a recovery is underway, but key technical hurdles must be overcome to confirm a re-establishment of the medium-term uptrend.
Recovery and Support: The index successfully recovered from multi-day losses, with immediate support forming near 6,600. This area, combined with the technical floor from the recent pullback at 6,574, is now viewed as the crucial dip-buying zone for bulls seeking trend stability.
Overhead Resistance: The immediate technical challenge for the US500 is the resistance 6,700. A decisive breakout above this level is mandatory to trigger fresh buying momentum and signal a potential move toward testing recent all-time highs.
Volatility Remains High: The recent spike in the Volatility Index (VIX), which touched 22, highlights that despite the positive catalyst, the market structure remains highly volatile. Traders are still anticipating sizable moves, indicating that the index is not yet in a period of calm, sustained advance. The overall medium-term uptrend is intact above key support but is vulnerable to renewed profit-taking.
Sentiment Analysis & Outlook: Relief vs. Lingering Risk
Market sentiment has shifted from anxiety to a sense of relief and renewed optimism, but deep seated macro risks prevent euphoria.
The AI Bubble Fear Eases: Nvidia's expected strong performance has temporarily quieted concerns about an imminent "AI bubble" or a broader market correction led by tech weakness. Momentum stocks, especially semiconductors and megacap tech, are enjoying a strong tailwind.
Macro Risks on the Horizon: The market's focus will quickly pivot to non-tech catalysts, specifically interest rates and the highly anticipated delayed jobs report later this week. Any downside surprise from this key economic data could immediately negate the tech-driven positive sentiment.
Near-Term Outlook: The outlook is for cautious stabilization and the potential for modest further gains. For the US500 to sustain a rally and target new highs, it must achieve two things:
Technical Confirmation: Sustain above the 6,600 support and successfully break the 6,700 resistance.
Macroeconomic Alignment: The upcoming economic data must not present a surprise that forces the market to re-evaluate the Federal Reserve's policy path.
Nvidia has bought the market time and provided a strong catalyst. The US500 is breathing a sigh of relief, but the path forward remains highly sensitive to macro news flow and the resilience of the AI trade outside of this singular earnings report.
This analysis is by Terence Hove, Senior Financial Markets Strategist at Exness
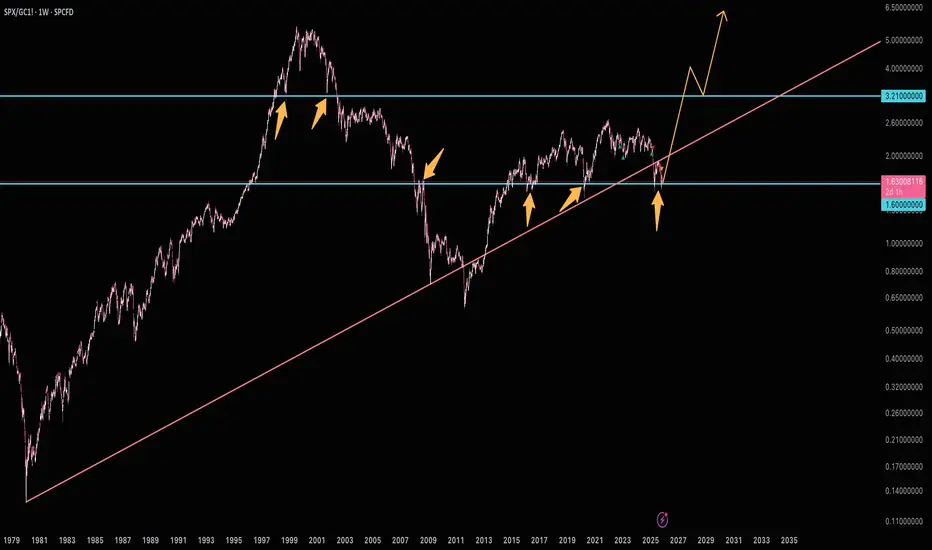
Stocks set to significantly outperformStocks are back on major support and are set to significantly outperform. It's a good idea to be out of gold or USD and pile into stocks for a real increase in value. Shorting gold isn't a bad idea either.
Ignore the bubble talk. When there's a real bubble you'll go out to eat and hear the table next to you talking about stocks.
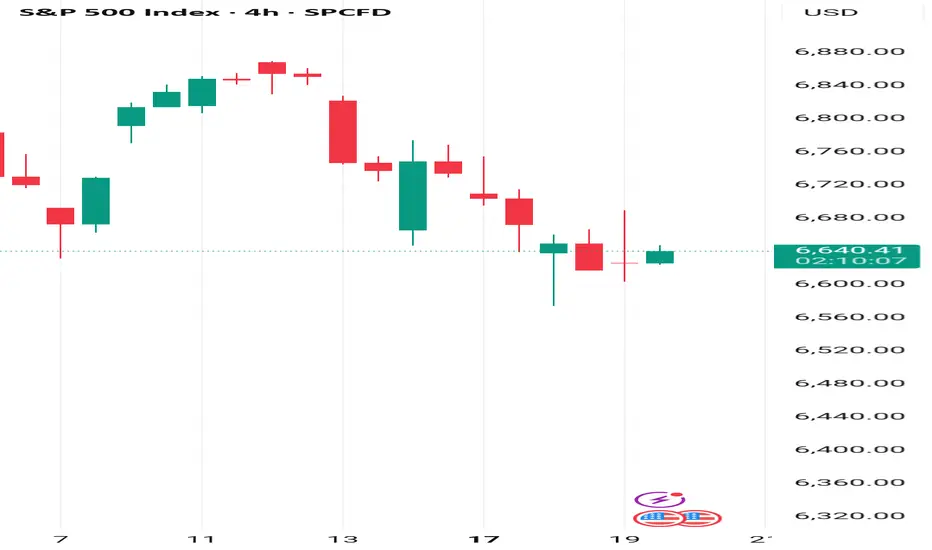
Wednesday 19 November: Forex thoughts Today's 4 HR S&P opening candle (for me) epitomises the trading week so far. Periods of positivity and periods of negativity, with neither action particularly having any 'juice' behind it. It feels like we are 'waiting for something' (NFP?).
Currently, correlations are out of the window and it's difficult.
Sentiment for the JPY remains subdued (rate hike pushed back, if there will be one at all). Which makes the JPY very shortable. But getting the timing correct is easier said than done.
The GBP continues to be remarkably resilient and the AUD continues to under perform its fundamentals.
As things stand, I wouldn't like to hazard a guess at the outcome or reaction to any of the upcoming events (FOMC, NVIDIA, NFP). So, I'm content to observe and form a fresh opinion post NFP.
Yesterday's trade stopped out very quickly, I realise it was bold and unconventional but given the underlying negativity at the time, I still don't think it was the worst idea in the world.
Maybe you have a different interpretation of the week's events so far?
DECODED ANALYSIS S&P 500 INDEX DECODED ANALYSIS S&P 500 INDEX
Historical Chart Study from1871 to Present.
Based on the decoded multiple yearly candle structure, the S&P 500 grand cycle confirms that its final (last yearly pattern) is forming in a downtrend.
In comparison, the Dow Jones Industrial Average formed its final (last yearly pattern) in an uptrend in 1974.
For the S&P 500 to maintain its structure, the index must move above $6,993.
Key Resistance Levels noted:$6,993
Additional Resistances: $7,256, $7,362, $7,633
Resistances noted for year 2030 at $10,396, $10,740
Support Levels:
Upper Supports: $5,903, $4,871, $3,947, $3,688, $3,590, $3,385
Main Yearly Pattern Support: $2,476
Multiple skipped supports detected, with the lowest noted at $3.25
Disclaimer:
This analysis is for educational purposes only.
Always conduct your own research DYOR.

Cognitive Bias VS PrejudgmentCognitive Bias is how you or your brain process or interpret information. What you strongly believe in. (Influenced by beliefs, expectations, emotions, and shortcuts).
Prejudgment could be things that are "most of time true, but not always". Learned truths that can be false. (Prejudgment is treating a general rule as always true).
... markets move based on Supply-Demand dynamic, structural positioning and "least resistance". Markets follow the economy. And there are merits to using quant statistics.
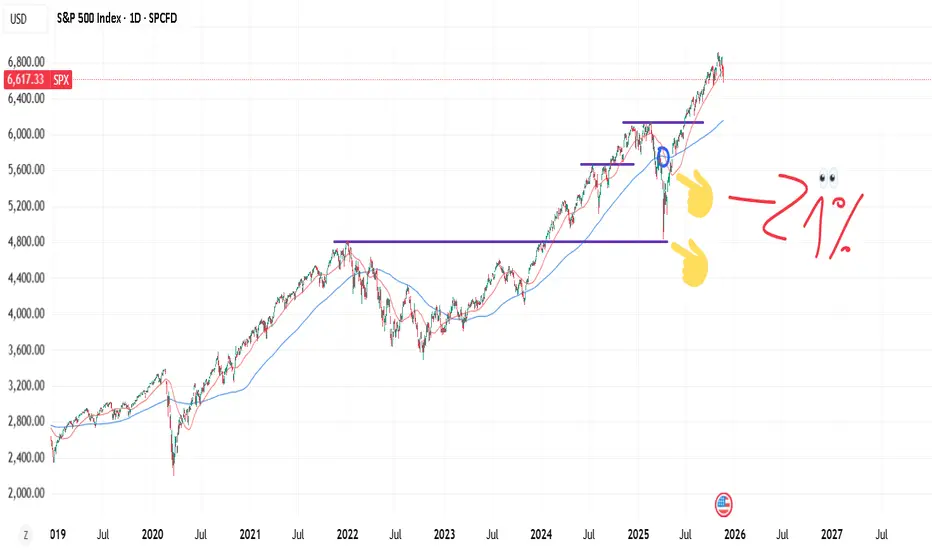
Prejudgment: (Based on DOW theory or Tudor Jones upsloping 200dma) - there is less risk buying strong bull markets. When DOW is broken, price bellow 200dma - it means bear market. In practice this was a statistical scarce spot where big money is made.
-20% is usually a good indicator as well as bottom for the top1% stocks? as well in bitcoin, that wouldn't fall that much.
Prejudgment: Stocks follow the economy (true), tariffs pose risks to economy ie cause recession, hence a bear market.
Statistically, based on like previous 6 years, every sharp drop gets re-filled instantly. ie the V shape recoveries. mirroring 2020. There was a positional imbalance.
Cognitive Bias: trending near the bottom ---> affirms your fears of crash. or bubble talks. Prices follow S-D dynamic, not charts.
Another one is believing that most people are in fear. Which equates a crash.
cognitive biases in short -- you favor or over emphasize the importance of near term events over longterm proven statistics. Markets repeat over and over again, in same psychological patterns.
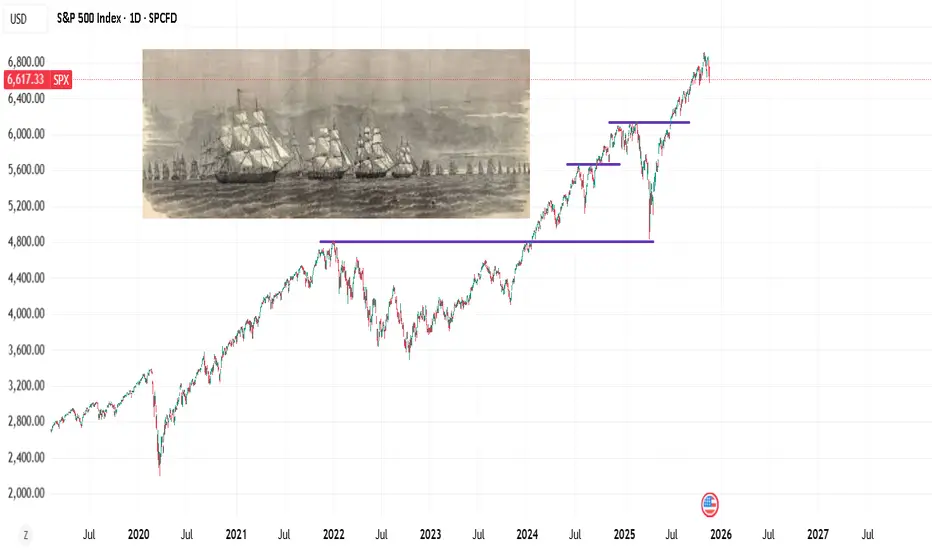
Old Ship Fleet: uncertainty and risk.In the old days, buying a trading ship posed risks due to natural disasters. Later on, people could have option to buy lets say a 10% share in a fleet of 10 trading ships. When one ship goes down, it doesn't ruin your "portfolio".
I think the concept about not putting all eggs in one basket fits well into risk taking.
Then you have some investors claim, you put all your eggs into one basket - and guard the basket.
The ship fleet works as a syllogism about uncertainty. Math (probability of disaster on statistical basis). And risk taking.
Eggs in one basket is a syllogism about losing everything. But not uncertainty or risk-taking per se.
-> In competitive spaces, with only few or one winner. With exponential, explosive returns -- diversifying or putting eggs in separate baskets make no sense. "Fortune favors the bald" is a better way to describe it.
but it says nothing about mathematical side of uncertainty or risk taking. Hence the "old ship fleet".

the PopLooks like a reversal here. A break below the lows and I'm incorrect. Everything is popping. Watch Oil for a break up above the 18ma soon.

S&P 500 falls below 6K - key levels to watchAs highlighted the possibility yesterday, the S&P 500 has now fallen to a fresh multi-week low. The old low at 6631 is now the most important level to watch in terms of upside resistance. Above that 6638, yesterday's low, will come into focus ahead of 6650/5 area.
On the downside, the mid-October lows of 6533 and 6500 are the next areas of interest for the bears. Will we get there? Perhaps if NVidia earnings disappoint tomorrow night.
By Fawad Razqzada, market analyst with FOREX.com

Possible drop and popIf we breakdown at open be careful of a rally to recover 6650 support. Oil is at it's 18ma, needs to get over it to be bullish. Gold maybe rally to 4100 area before further downside. BTC could go a bit lower but again I think it will bounce sooner rather than later.

Artificial Intelligence & Tech Stocks Rally1. The Rise of AI as an Economic Catalyst
AI has shifted from being a futuristic concept to a real-world productivity enhancer. It now influences every major industry: financial services, healthcare, manufacturing, retail, cybersecurity, logistics, and more. Technologies such as deep learning, natural language processing, and autonomous systems have prompted companies worldwide to accelerate their digital transformation.
The introduction of large language models (LLMs), AI chips, robotics, and automation has created a new economic cycle driven by data, computing power, and algorithmic intelligence. As a result, companies directly involved in AI development—along with those supplying the hardware and cloud platforms—have become market favorites.
Investors increasingly view AI as the next “industrial revolution” capable of reshaping global productivity, profitability, and innovation. This belief has driven massive capital inflows into tech stocks, especially those perceived as leaders in AI research and commercialization.
2. Key Drivers Behind the AI-Fueled Tech Rally
A. Explosive Growth of Generative AI
The launch of advanced generative AI systems dramatically accelerated interest in AI stocks. Major companies quickly integrated generative AI into search engines, productivity tools, customer support, and software development workflows. This rapid adoption strengthened the revenue outlook for tech giants and reinforced investor confidence.
B. Demand for High-Performance Computing & AI Chips
Semiconductor companies, particularly those producing AI GPUs and specialized accelerators, have emerged as the backbone of the AI revolution. The massive need for computational power has pushed chip manufacturers to record valuations. Cloud service providers and hyperscale data centers are investing billions to upgrade their infrastructure to handle AI workloads.
C. Cloud Expansion & Software AI Integration
Tech firms integrating AI into their existing cloud and software offerings have seen rising subscription revenue and improved customer retention. The “AI upgrade cycle”—where businesses adopt AI features as part of cloud services—has enhanced long-term earnings visibility for cloud companies.
D. Automation & Productivity Gains
AI-driven automation is helping businesses improve productivity while reducing costs. Companies that demonstrate measurable efficiency gains from AI adoption are rewarded by investors, who view this as margin-expansion potential. As firms show better earnings due to AI-enabled efficiencies, market optimism increases.
E. Global Government Support
Governments worldwide are prioritizing AI policy, infrastructure, and innovation funding. This includes national AI strategies, incentives for semiconductor manufacturing, and investment in digital public infrastructure. These initiatives create favorable environments for AI-driven business growth, further strengthening investor sentiment.
3. Major Sectors Benefiting from the AI Rally
1. Semiconductor & Chip Manufacturing
AI requires enormous computing power, leading to unprecedented demand for GPUs, neural processing units (NPUs), and specialized chips. Semiconductor companies have seen massive revenue growth due to AI training and inference workloads.
2. Cloud Computing Platforms
AWS, Microsoft Azure, Google Cloud, and others are increasingly viewed as the “AI backbone” because they host AI models and provide infrastructure. Cloud giants benefit from scalable subscription revenue and enterprise AI spending.
3. Software as a Service (SaaS)
SaaS companies integrating AI into CRM, automation, analytics, and productivity tools are experiencing an upgrade cycle. New AI features allow them to charge premium subscription fees, boosting profitability.
4. Cybersecurity
AI-powered cybersecurity systems detect threats faster and manage huge volumes of data. With rising cybercrime, demand for AI-based security tools continues to expand.
5. Robotics & Automation
AI is powering industrial robotics, warehouse automation, and autonomous machinery. The increased demand for efficiency in logistics and manufacturing fuels revenue growth for automation firms.
6. Consumer Technology
AI is enhancing smartphones, smart home systems, wearables, and personal digital assistants. Tech companies adding AI capabilities have seen surging demand for next-generation devices.
4. Why Investors Are Bullish on AI's Long-Term Outlook
A. Multi-Trillion Dollar Market Potential
AI’s total addressable market (TAM) is expected to surpass trillions of dollars over the next decade. Analysts predict long-term growth across nearly every industry, making AI one of the largest commercial opportunities in history.
B. Continuous Innovation & Rapid Deployment
AI models and systems improve continuously. Every new innovation—smarter models, faster chips, more efficient algorithms—creates new commercial opportunities. This rapid pace of change fuels sustained investor enthusiasm.
C. Enterprise Adoption at Massive Scale
Companies across sectors are integrating AI into operations, decision-making, and customer experience. Enterprise adoption is one of the biggest drivers of long-term revenue growth for AI suppliers and service providers.
D. Network Effects & Data Advantages
Companies with massive data pools, extensive user bases, and strong computational capacity benefit from network effects. This creates “winner-take-most” dynamics favoring tech giants—which attract substantial investor capital.
5. Risks & Challenges to the AI Tech Rally
While the AI-driven rally is strong, it is not without risks:
1. Overvaluation Concerns
Some tech stocks have reached extremely high valuations. If earnings growth fails to match expectations, corrections may occur.
2. Supply Chain Constraints
AI hardware requires complex semiconductor supply chains. Shortages in advanced chips could impact production and revenue.
3. Regulatory & Ethical Uncertainty
Governments are increasing oversight over AI data use, privacy, and safety. Regulatory risks can affect growth prospects.
4. High Capital Expenditure
AI infrastructure—data centers, chips, cloud systems—is extremely expensive. Some companies may face profitability pressures due to high capex.
5. Competitive Intensity
AI markets are highly competitive. New entrants, rapid innovations, or pricing pressures could disrupt market leaders.
6. Future Outlook of AI & Tech Stocks
The long-term outlook for AI and tech remains highly positive. Over the next decade, AI is expected to shape global economic growth, productivity, and technological innovation. Key trends include:
Expansion of generative AI across enterprise workflows
Surge in demand for AI chips, data centers, and cloud computing
Growing adoption in healthcare, finance, logistics, education, and retail
AI-powered robotics reshaping manufacturing
Increased global investment in digital and computational infrastructure
Despite market volatility or occasional corrections, AI’s economic impact is expected to grow significantly, making AI and tech stocks central to modern global portfolios.

Megaphone Broadening Top Likely on SPXOver the last few months, the market has been increasingly difficult to trade as it searches for direction. Stop losses were triggered for longs on Oct 10, and shorts were equally liquidated on the run up beginning Oct 27th. What has formed is a broadening top, confirmed by two points of touch on each side of the pattern.
Broadening patterns can go in both directions, but supporting information suggests this is the end of the bull market:
On the weekly chart, there is a MACD cross.
There is a clearly defined 5 wave structure from the October 2022 bottom. It is a textbook example of Elliot Wave Theory.
Multiple analysts have shown that stock valuations are near historical extremes. It is highly likely that the market is in an AI bubble.
How am I trading this? I have sold all long positions. I am swinging puts that I will close out at the bottom of the megaphone. Once a breakout occurs, a pullback is highly likely to follow, even going so far as to return inside the pattern (60% of the time). If a pullback does occur, I'll load up on long dated puts to profit off a potential bear market.

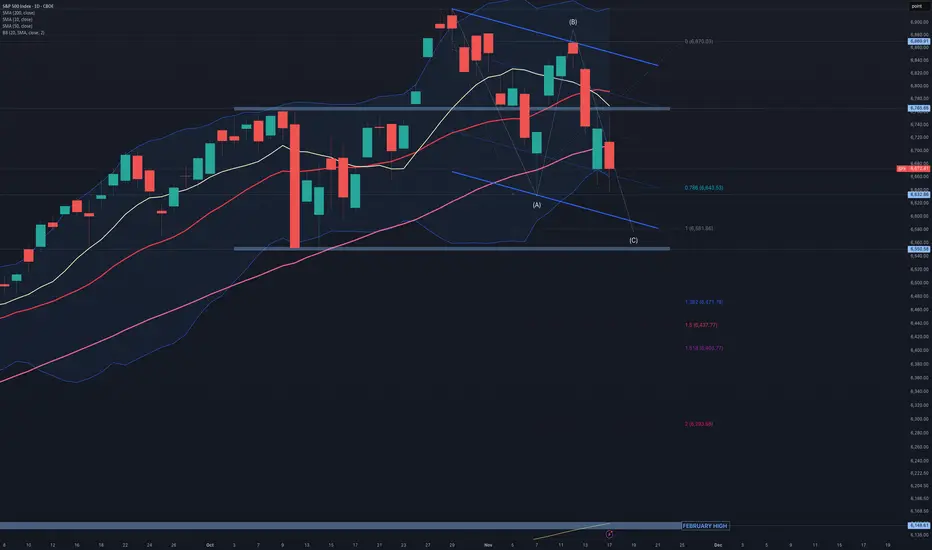
$SPX:Bearish technical indicators are accumulating:SPX: Bearish technical indicators are accumulating:
1) A sell signal on the MACD.
2) The RSI14 is at 42.
3) There has been a break below the 10, 20, and 50-period simple moving averages.
4) There is an inability to break above the horizontal resistance at 6765.
It is evident that the bullish momentum that followed the extremely bearish candlestick on October 10th has stalled, resulting in sideways trading with a slight downward trend. However, there is no immediate cause for concern since an underlying pressure is currently halting the decline.
At this point, we could expect a bullish flag pattern to emerge, which will be confirmed by the market's reaction to NVDA's results next Wednesday. The lower limit of the anticipated flag aligns with a 1x1 extension for wave (C). If the situation worsens and the flag is broken, it may transform into a zig-zag pattern, with extension targets for wave (C) indicated on the chart. Consider viewing this as an opportunity to enter a long position.
String rejection from support. pull back S&p500 LongStrong rejection from support. A good pullback expected in FRED:SP500

US500 - BEARISHEvening all!
Keeping it simple and short, the dollar is undervalued, and everything (indexes, crypto, precious metals) all melting up at the same time - im anticipating an end to 2025 that see's the dollar rise, and the melt up, melt down!
For US 500 - Target/draw on liquidity is the Weekly STL overall.

$SPX 1H – Bear Flag (Nov 17) $SP:SPX #SPX SP:SPX
After the dump off the late-October supply zone, SPX has formed a rising parallel channel that looks like a classic bear flag on the 1H. The pole is the leg from ~6,82x into the mid-6,64x flush; the flag is now a cleaner channel anchored off the post-spike higher lows and multiple swing highs.
Check 1h charts from Nov 13 and Nov 14
Price is currently riding the lower rail of the flag near 6,70x. A decisive 1H close below the channel and 6,70x would confirm a breakdown, opening room toward the 6,65x–6,64x demand zone and a potential measured-move extension. If instead we bounce and reclaim the upper rail (~6,77x–6,78x) and hold above it, the bear-flag idea weakens and this turns into a deeper mean-reversion squeeze rather than immediate continuation. #SPX

SPX 500: Stocks look heavy US stocks are testing their session lows with major indices looking heavy amid the unwinding of carry trades...
Concerns about Japan’s growing debt are intensifying. The government seems to be trying to have it both ways—implementing a massive fiscal stimulus package worth 17 trillion yen while opposing monetary policy normalization by the Bank of Japan. This conflicting stance has led to a sharp decline in the yen and bond prices, pushing Japanese yields higher. Markets now worry that the government is mishandling the economy, demanding higher returns to compensate for what they perceive as rising risk in holding Japanese debt.
So why does this matter for US stocks? The turbulence in Japanese markets may be triggering a carry trade unwind, similar to what happened in the summer of 2024. In a carry trade, investors borrow funds from countries with very low interest rates—like Japan—and invest them in higher-yielding assets such as stocks, gold, or cryptocurrencies denominated in stronger currencies like the U.S. dollar. As Japanese yields climb, the cost of maintaining these trades rises. With yields now becoming uncomfortably high, traders are being forced to reduce leveraged positions across markets, including US stocks.
By Fawad Razaqzada, market analyst with FOREX.com

SPX weekly overview🔺 Chart Summary – Symmetrical Triangle + Key Levels
chart clearly shows a large symmetrical triangle forming on the SPX 1-hour timeframe:
1. Triangle Structure
Upper trendline (descending): Connecting the lower highs from the recent peak.
Lower trendline (ascending): Connecting higher lows from the last big dip.
Price is currently squeezing toward the apex, meaning volatility may contract before a bigger breakout move.
Resistance Levels
6750–6760 zone: Immediate resistance; price is struggling here.
6830–6860 zone: Major resistance cluster from previous swing highs.
Above that: Trendline resistance will be the next barrier.
Support Levels
6700–6710 zone: Very important short-term support.
6640–6650 zone: Stronger support; matches previous reaction lows.
6580–6600: Deeper support and bottom of the triangle approach.
4. Market Implication
Bullish: Break above the descending trendline + close above 6760 opens path toward 6830–6860.
Bearish: Break below the ascending trendline + close under 6640 opens path toward 6580 and further.
5. Overall View
The index is coiling inside a tightening triangle, meaning a major move is likely soon. Right now, SPX is in neutral-to-slightly-bearish territory until it reclaims the 6750–6760 zone.

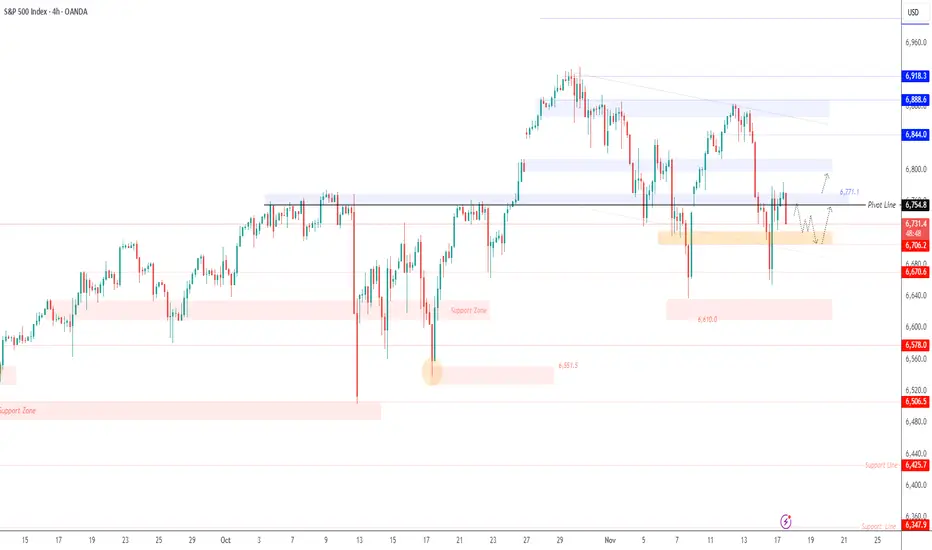
SPX500 | Key Levels Ahead of Nvidia EarningsSPX500 | Overview
U.S. stock futures edge higher as investors await Nvidia’s earnings report and delayed government data, which could provide clues about the economy and the Federal Reserve’s next policy steps.
Technically:
The SPX500 remains in a neutral-to-bearish zone, with direction depending on the upcoming 4H candle close.
A close below 6755 would confirm a bearish continuation toward 6706 and 6670.
However, a 4H close above 6769 would shift momentum to a bullish trend, targeting 6813 and 6838.
Pivot Line: 6754
Support: 6706 · 6670 · 6637
Resistance: 6770 · 6813 · 6838

SPX into Monday 17th NovemeberPrice rcoiling into resistance after a sell off that got a tad oversold.Lets see if the bulls have some power.?
