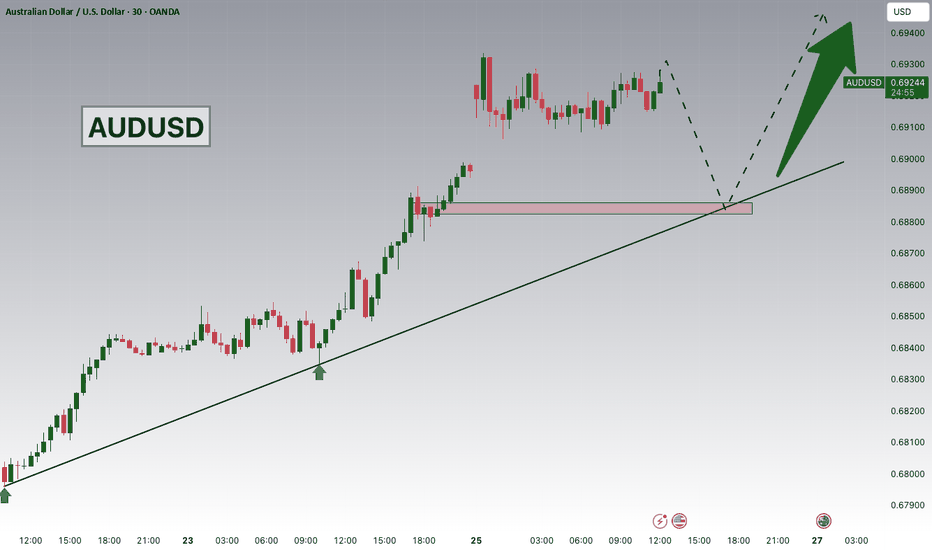
AUDUSD Strong Bullish Momentum!Hey traders, in today's trading session we are monitoring AUDUSD for a buying opportunity around 0.68800 zone, AUDUSD is trading in an uptrend and currently is in a correction phase in which it is approaching the trend at 0.68800 support and resistance area.
Trade safe, Joe.
U.S. Dollar / Australian Dollar
No trades
Related currencies
AUD-USD Free Signal! Sell!
Hello,Traders!
AUDUSD strong bullish drive taps a higher-timeframe supply. Price is likely to retest the supply zone to rebalance inefficiency before a bearish reaction toward sell-side liquidity.
--------------------
Entry: 0.6905
Stop Loss: 0.6946
Take Profit: 0.6840
Time Frame: 12H
-----------
AUD/USD: 90% of Traders Are Short… and Price Keeps RallyingAUD/USD has completed a clean and impulsive breakout above a major daily supply zone, which is now acting as structural support. This move marks a clear regime shift from the previous consolidation phase into a trend continuation environment.
From a price action perspective, the daily chart shows a
AUDUSD Buy Setup | 0.69800 Support + Bullish Gold Prices!Hey Traders,
In today’s trading session, we are closely monitoring AUDUSD for a potential buying opportunity around the 0.69800 zone. AUDUSD remains in a well-established bullish trend and is currently undergoing a healthy corrective pullback, approaching a key trendline confluence and the 0.69800
AUDUSD Outlook | Uptrend Holds as Gold Supports AUD!Hey Traders,
In today’s trading session, we are closely monitoring AUDUSD for a potential buying opportunity around the 0.67600 zone. AUDUSD remains in a well-established uptrend and is currently undergoing a healthy corrective pullback, approaching a key trendline confluence and the 0.67600 suppor
AUDUSD - When Structure Meets RealityAUDUSD is now retesting a strong technical intersection:
the weekly resistance marked in green is lining up perfectly with the upper bound of the weekly rising channel in blue.⚔️
On top of that, price is sitting in an over-bought zone after an extended push higher.
As long as this intersection ho
AUDUSD – Higher Timeframe Setup (D1)Price is trading into a major HTF resistance / supply zone (~0.69871) that previously acted as strong distribution. The recent move up looks corrective, forming lower highs inside a broader bearish structure. Liquidity is likely resting above this zone (“stops”), which often gets swept before a stro
AUD/USD SHORT FROM RESISTANCE
Hello, Friends!
We are now examining the AUD/USD pair and we can see that the pair is going up locally while also being in a uptrend on the 1W TF. But there is also a powerful signal from the BB upper band being nearby, indicating that the pair is overbought so we can go short from the resistanc
AUD/USD SENDS CLEAR BEARISH SIGNALS|SHORT
Hello, Friends!
We are now examining the AUD/USD pair and we can see that the pair is going up locally while also being in a uptrend on the 1W TF. But there is also a powerful signal from the BB upper band being nearby, indicating that the pair is overbought so we can go short from the resistanc
See all ideas
Summarizing what the indicators are suggesting.
Oscillators
Neutral
SellBuy
Strong sellStrong buy
Strong sellSellNeutralBuyStrong buy
Oscillators
Neutral
SellBuy
Strong sellStrong buy
Strong sellSellNeutralBuyStrong buy
Summary
Neutral
SellBuy
Strong sellStrong buy
Strong sellSellNeutralBuyStrong buy
Summary
Neutral
SellBuy
Strong sellStrong buy
Strong sellSellNeutralBuyStrong buy
Summary
Neutral
SellBuy
Strong sellStrong buy
Strong sellSellNeutralBuyStrong buy
Moving Averages
Neutral
SellBuy
Strong sellStrong buy
Strong sellSellNeutralBuyStrong buy
Moving Averages
Neutral
SellBuy
Strong sellStrong buy
Strong sellSellNeutralBuyStrong buy
Displays a symbol's price movements over previous years to identify recurring trends.
Frequently Asked Questions
The current rate of USDAUD is 1.4174 AUD — it has decreased by −0.37% in the past 24 hours. See more of USDAUD rate dynamics on the detailed chart.
The value of the USDAUD pair is quoted as 1 USD per x AUD. For example, if the pair is trading at 1.50, it means it takes 1.5 AUD to buy 1 USD.
The term volatility describes the risk related to the changes in an asset's value. USDAUD has the volatility rating of 0.16%. Track all currencies' changes with our live Forex Heatmap and prepare for markets volatility.
The USDAUD showed a −4.35% fall over the past week, the month change is a −5.28% fall, and over the last year it has decreased by −11.69%. Track live rate changes on the USDAUD chart.
Learn how you can make money on rate changes in numerous trading ideas created by our community.
Learn how you can make money on rate changes in numerous trading ideas created by our community.
USDAUD is a major currency pair, i.e. a popular currency paired with USD.
Currencies are usually traded through forex brokers — choose the one that suits your needs and go ahead. You can trade USDAUD right from TradingView charts — just log in to you broker account. Check out the list of our integrated brokers and find the best one for your needs and strategy.
When deciding to buy or sell currency one should keep in mind many factors including current geopolitical situation, interest rates, and other. But before plunging into a deep research, you can start with USDAUD technical analysis. The technical rating for the pair is sell today, but don't forget that markets can be very unstable, so don't stop here. According to our 1 week rating the USDAUD shows the strong sell signal, and 1 month rating is sell. See more of USDAUD technicals for a more comprehensive analysis.


