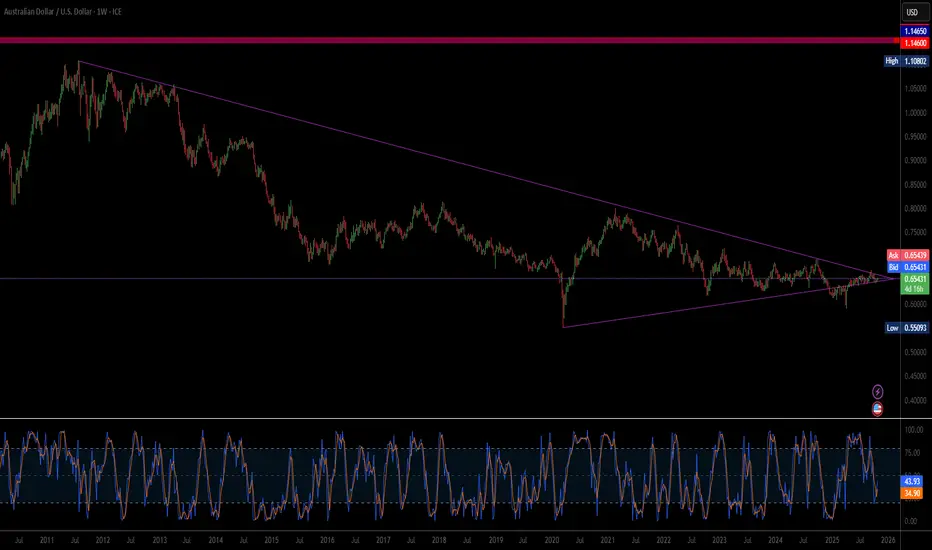
AUD/USD Breakout Bullish continuation AUD/USD price had been consolidating for a while, buyers were slowly building pressure, forming higher lows.
Each new push from buyers showed more strength, and each rejection from sellers grew weaker, momentum was clearly shifting.
Finally, buyers broke with conviction, showing strong bullish inte
Related currencies

AUDUSD Rebounds Strongly: Double Bottom Signals Bullish ReversalAUDUSD Rebounds Strongly: Double Bottom Signals Bullish Reversal
AUDUSD has formed a Double Bottom Pattern around the 0.6460 support zone — a classic bullish reversal signal.
The pair has since broken above a minor resistance, confirming short-term bullish momentum.
Currently trading near 0.6550,

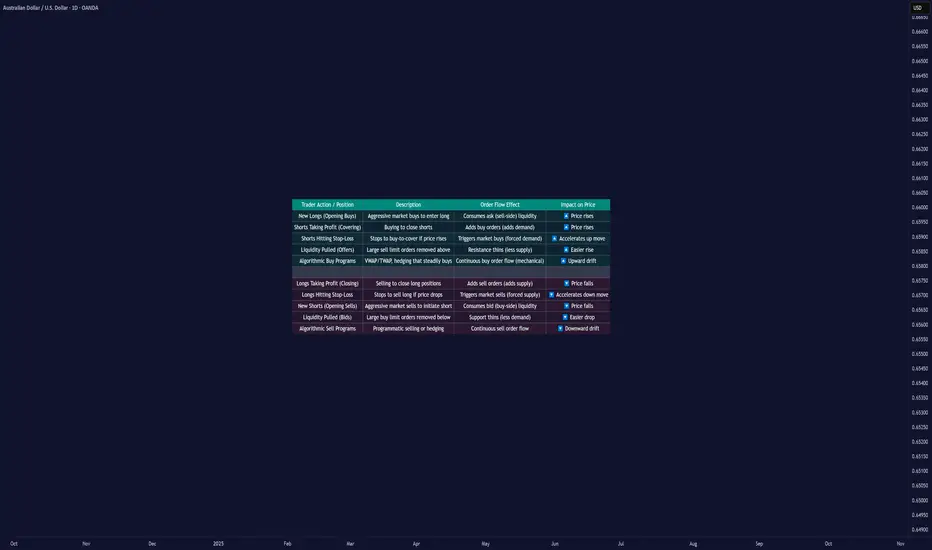
Why Prices Move Up or Down: Order Flow and Liquidity█ Why Prices Move Up or Down: Understanding Order Flow and Liquidity
Most traders are told that prices rise because “there are more buyers than sellers,” and that prices fall because “there are more sellers than buyers.” But that’s not how markets actually work. In every transaction, there’s alwa
Is Geopolitical Re-Alignment the New AUD Catalyst?The Australian Dollar's (AUD) sharp surge against the US Dollar (USD) is driven by a powerful synergy of geopolitical de-escalation and structural economic realignment. Near-term momentum stems from optimism surrounding an imminent US-China trade deal. As a primary commodity exporter and a financial
Lingrid | AUDUSD Major Resistance Short SetupThe price perfectly fulfilled my previous idea . FX:AUDUSD is currently testing the upper boundary of its consolidation zone near 0.6624 after breaking out of an ascending triangle pattern. Price action is interacting with both the downward trendline and the newly formed upward trendline, signali

AUDUSD – Monday Gap Fill Setup (Institutional Play)This week opened with a Gap Up relative to last Friday’s close (~0.65122).
A Gap Up typically suggests that price may retrace downward to fill the imbalance left behind over the weekend — as long as structure confirms the continuation move.
How the Setup Developed
1. Friday Close was marked as the G

AUDUSD → Attempt to reverse the trend to bullish FX:AUDUSD is forming a correction after breaking through the resistance of the downward channel. The market needs a trading range or consolidation above 0.6526.
The dollar is consolidating but is not ready to continue growing. Pressure on the currency is emerging ahead of the Fed meeting. This

AUDUSD Eyes 0.6500 as Softer CPI and Weak Jobs Data Weigh on USDHey Traders,
In the coming week, we’re monitoring AUDUSD for a potential buying opportunity around the 0.65000 zone. The pair remains in a broader uptrend, with the current pullback shaping up as a healthy correction toward key structural support.
Structure:
Price continues to respect its ascendin

AUDUSD Breakout and Potential Retrace!Hey Traders, in today's trading session we are monitoring AUDUSD for a selling opportunity around 0.65800 zone, AUDUSD was trading in an uptrend and currently is in a correction phase in which it is approaching the retrace area at 0.65800 support and resistance area.
Trade safe, Joe.

AUD/USD chart Pattern...AUD/USD chart with Ichimoku Cloud and a downward channel breakout setup.
Here’s what I can observe:
---
🔍 Technical Setup:
Pair: AUD/USD
Timeframe: 3H
Pattern: Downtrend channel breakout to the upside
Indicators: Ichimoku Cloud, showing bullish Kumo breakout
Current price: ≈ 0.6599
Breakou

See all ideas
Summarizing what the indicators are suggesting.
Oscillators
Neutral
SellBuy
Strong sellStrong buy
Strong sellSellNeutralBuyStrong buy
Oscillators
Neutral
SellBuy
Strong sellStrong buy
Strong sellSellNeutralBuyStrong buy
Summary
Neutral
SellBuy
Strong sellStrong buy
Strong sellSellNeutralBuyStrong buy
Summary
Neutral
SellBuy
Strong sellStrong buy
Strong sellSellNeutralBuyStrong buy
Summary
Neutral
SellBuy
Strong sellStrong buy
Strong sellSellNeutralBuyStrong buy
Moving Averages
Neutral
SellBuy
Strong sellStrong buy
Strong sellSellNeutralBuyStrong buy
Moving Averages
Neutral
SellBuy
Strong sellStrong buy
Strong sellSellNeutralBuyStrong buy
Displays a symbol's price movements over previous years to identify recurring trends.
Frequently Asked Questions
The current rate of USDAUD is 1.5273 AUD — it has increased by 0.12% in the past 24 hours. See more of USDAUD rate dynamics on the detailed chart.
The value of the USDAUD pair is quoted as 1 USD per x AUD. For example, if the pair is trading at 1.50, it means it takes 1.5 AUD to buy 1 USD.
The term volatility describes the risk related to the changes in an asset's value. USDAUD has the volatility rating of 0.35%. Track all currencies' changes with our live Forex Heatmap and prepare for markets volatility.
The USDAUD showed a −0.50% fall over the past week, the month change is a 1.04% rise, and over the last year it has increased by 0.55%. Track live rate changes on the USDAUD chart.
Learn how you can make money on rate changes in numerous trading ideas created by our community.
Learn how you can make money on rate changes in numerous trading ideas created by our community.
USDAUD is a major currency pair, i.e. a popular currency paired with USD.
Currencies are usually traded through forex brokers — choose the one that suits your needs and go ahead. You can trade USDAUD right from TradingView charts — just log in to you broker account. Check out the list of our integrated brokers and find the best one for your needs and strategy.
When deciding to buy or sell currency one should keep in mind many factors including current geopolitical situation, interest rates, and other. But before plunging into a deep research, you can start with USDAUD technical analysis. The technical rating for the pair is sell today, but don't forget that markets can be very unstable, so don't stop here. According to our 1 week rating the USDAUD shows the sell signal, and 1 month rating is neutral. See more of USDAUD technicals for a more comprehensive analysis.