AUD/USD 2-hour chart Pattern..AUD/USD 2-hour chart
---
📊 Chart Overview
Pair: AUD/USD
Timeframe: 2-hour
Current Price: Around 0.6490
Support Zone: Around 0.6460 – 0.6470 (small consolidation area below price)
Indicators: Ichimoku Cloud + Trendline Break
Bias: Bullish correction after a breakout from downtrend line
---
🎯 Target Levels
1. 🎯 Target Point 1 (Short-Term Target):
Price Zone: 0.6530 – 0.6540
This matches my first blue “Target Point” on the chart.
It’s the first major resistance level above the cloud and likely a take-profit zone for early longs.
Expect some price reaction or pullback around this area.
2. 🎯 Target Point 2 (Extended Target):
Price Zone: 0.6600 – 0.6610
This is my second (upper) “Target Point” on the chart.
It aligns with a previous high and represents the completion of a bullish swing projection if momentum continues.
---
🧭 Summary Table
Target Type Price Level Notes
🎯 TP1 0.6530 – 0.6540 First resistance / partial profit zone
🎯 TP2 0.6600 – 0.6610 Extended bullish target (strong resistance area)
🛑 Support / Stop Area 0.6460 – 0.6470 Key support / invalidation zone
Trade ideas

AUD/USD: Buy Opportunity, Forecast for Continued Rise!The AUD/USD pair has shown strong signs of upward movement in recent days. This is especially true in the context of strong economic data from Australia, particularly core inflation, and the expectation that the RBA will not cut interest rates in the short term, which has strengthened the AUD. Additionally, the market continues to maintain confidence in Australia's monetary policies.
The 4-hour chart shows that the AUD/USD pair is in a clear uptrend, breaking through previous resistance levels and staying above the rising trendline. The pair is now approaching the resistance at 0.66500; if this level is broken, the price could continue to rise towards 0.66800 or higher in the short term. The nearest support level is 0.65800, where the price is creating a new bottom and maintaining the upward trend.
Conclusion: With strong economic data and support from solid resistance levels, AUD/USD is likely to continue rising in the short term. Traders can consider buying near the 0.65800 support zone with a target towards 0.66500.

AUD/USD Snaps 5-Day Winning Streak At ResistanceThe less-dovish-than-expected FOMC meeting overshadowed Australia’s hot CPI report, sending AUD/USD lower after a five-day winning streak. Price action printed a bearish pinbar around the 0.66 handle, aligning with the October VPOC and monthly pivot point — a confluence that triggered profit-taking among bulls.
On the hourly chart, a bullish pinbar and doji have formed around the weekly R2 pivot, with RSI deeply oversold. A minor intraday bounce in Asia looks likely, though sellers could fade rallies toward 0.6573 (weekly R1) or 0.6528 (gap support).
If a retracement lower unfolds, I’ll be watching for signs of a swing low on the daily chart — a potential springboard for the next leg higher in the Australian dollar towards its 200-week EMA.
Matt Simpson, Market Analyst at City Index and Forex.com

Falling towards major support?The Aussie (AUD/USD) is falling towards the pivot which is an overlap support that aligns with the 50% Fibonacci retracement and could bounce to the major resistance.
Pivot: 0.6530
1st Support: 0.6484
1st Resistance: 0.6619
Disclaimer:
The above opinions given constitute general market commentary, and do not constitute the opinion or advice of IC Markets or any form of personal or investment advice.
Any opinions, news, research, analyses, prices, other information, or links to third-party sites contained on this website are provided on an "as-is" basis, are intended only to be informative, is not an advice nor a recommendation, nor research, or a record of our trading prices, or an offer of, or solicitation for a transaction in any financial instrument and thus should not be treated as such. The information provided does not involve any specific investment objectives, financial situation and needs of any specific person who may receive it. Please be aware, that past performance is not a reliable indicator of future performance and/or results. Past Performance or Forward-looking scenarios based upon the reasonable beliefs of the third-party provider are not a guarantee of future performance. Actual results may differ materially from those anticipated in forward-looking or past performance statements. IC Markets makes no representation or warranty and assumes no liability as to the accuracy or completeness of the information provided, nor any loss arising from any investment based on a recommendation, forecast or any information supplied by any third-party.

AUDUSD Daily: Bearish
Wait for confirmation in 1hr timeframe
TP 1:4
Executing the same strategy every day, no matter what.

Bullish Gartley
1. Entry Zone
The ideal entry zone for a BUY order is the Potential Reversal Zone (PRZ) between 0.6485 and 0.6505. The current price of 0.64994 is perfectly within this zone, offering a potential entry.
2. Stop Loss
To protect against the pattern failing, a stop loss should be placed just below the X point of the pattern.
Stop Loss: Below 0.64433 (the X point). A logical level would be 0.6435.
3. Profit Targets (Take Profit Levels)
Targets are based on Fibonacci retracements of the entire CD leg or the XA leg.
TP1: 0.65500 (Previous resistance)
TP2: 0.66000 (Key level, often a 0.618 retracement of AD)
TP3: 0.66500 (Equal to the X point or a significant resistance level)
Summary of the Corrected Trade Plan
Component Level / Action
Pattern Bullish Gartley
Bias Buy
Entry Zone 0.6485 - 0.6505
Stop Loss (SL) 0.6435
Take Profit 1 (TP1) 0.65500
Take Profit 2 (TP2) 0.66000
Take Profit 3 (TP3) 0.66500
if you think it's a good idea please 🚀 boost


AUDUSD: Major Resistance.Hello everyone,
Lets take a sight on AUDUSD, the pair is presently at the resistance zone. in regards to the structure the price have respected this level for several times, qualifying it as the major resistance. we assume this as opportunity to short.
However we look forward for a clear confirmation.
Key Points;
A confirmed retracement below the resistance would set off downward movement to 0.6482 as potential target.
Thanks for reading.

AUDUSD - Elliott Wave >TheoryAUDUSD - Elliott Wave >Theory
The Idea is based on Elliott wave theory
We probably finished the ABC and we can have a potential Long signal for 3 wave..

AUD/USD Breakout Bullish continuation AUD/USD price had been consolidating for a while, buyers were slowly building pressure, forming higher lows.
Each new push from buyers showed more strength, and each rejection from sellers grew weaker, momentum was clearly shifting.
Finally, buyers broke with conviction, showing strong bullish intent.
That breakout confirms buyer dominance and signals the potential start of a new impulsive move higher.

AUDUSD – corrective math in motion.Price retraces into the prior order block that broke structure, completing a textbook ABC correction inside a premium zone. Liquidity pools just above IDM hint at a sweep before continuation toward 0.63.
Strengths :
Confluence between wave symmetry, premium retracement, and liquidity structure. Clear invalidation point above IDM keeps risk defined.
Weaknesses :
AUD fundamentals (RBA policy shifts, USD softness) could disrupt structure-based setups. No confirmed momentum shift yet on lower timeframes — patience required.
SmellyTaz — decoding chaos .

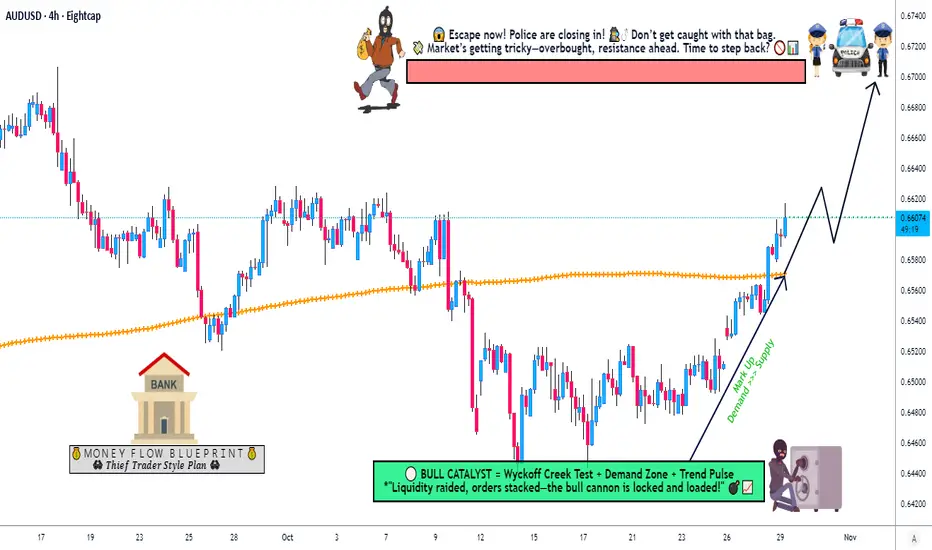
Is the Aussie Dollar Ready for a Strong Upside Push?🎯 AUD/USD: The Great Heist Setup | 200 SMA Breakout in Play! 💰
📊 Market Overview
The Aussie Dollar is making moves, ladies and gents! We've got a confirmed bullish breakout above the 200 Simple Moving Average — and you know what that means... it's time to plan our strategic entry! 🚀
🎭 The "Thief Strategy" Breakdown
🔍 Asset Analysis
Pair: AUD/USD (Aussie Dollar vs. US Dollar)
Market Type: Forex
Trade Style: Swing/Day Trade
Setup: Capital Flow Blueprint
📈 Technical Outlook
✅ Bullish bias confirmed with price breaking and holding above the 200 SMA
✅ Momentum building as buyers step in
✅ Higher timeframe structure supporting upside potential
🎯 Entry Strategy: "The Layering Heist"
The Thief Strategy uses multiple limit orders (layering technique) to scale into positions like a pro! Here's the blueprint:
💎 Multi-Layer Entry Zones:
Layer 1: 0.65400
Layer 2: 0.65600
Layer 3: 0.64800
Layer 4: 0.66000
Note: You can add more layers based on your capital allocation and risk appetite. Scale in smart, scale out smarter! 😎
🛡️ Risk Management
⛔ Stop Loss: 0.65200
Disclaimer: This is the Thief's SL level for reference. However, OG Thieves — set your own stop loss based on YOUR risk tolerance. Your capital, your rules! 🎲
🎯 Take Profit Target: 0.67000
Why 0.67000? This level acts as:
🚧 Strong resistance zone ("Police Barricade")
📊 Potential overbought territory
Historical trap zone — secure profits before the reversal!
Disclaimer: This is a suggested TP level. Trail your stops, scale out partially, or set your own target. Take money when you make money — it's your game! 💵
🔗 Correlated Pairs to Watch
Keep an eye on these related markets for confluence:
OANDA:NZDUSD — Commodity currency cousin, often moves in tandem with AUD
OANDA:AUDJPY — Risk-on sentiment gauge
OANDA:AUDCAD — Inter-commodity pair correlation
USD Index ( TVC:DXY ) — Inverse correlation with AUD/USD
Gold ( OANDA:XAUUSD ) — Aussie correlates with gold due to mining exports
💡 Pro Tip: If USD weakens broadly and gold rallies, AUD/USD typically benefits!
🔑 Key Points Summary
✨ Bullish breakout above 200 SMA = momentum shift
✨ Layering strategy allows better average entry price
✨ Risk-to-reward favors bulls with clear targets
✨ Watch DXY weakness and gold strength for confirmation
✨ Resistance at 0.67000 — bank profits before reversal zones!
✨ If you find value in my analysis, a 👍 and 🚀 boost is much appreciated — it helps me share more setups with the community!
#AUDUSD #ForexTrading #SwingTrading #DayTrading #ThiefStrategy #200SMA #Breakout #TechnicalAnalysis #ForexSignals #AussieDollar #LayeringStrategy #RiskManagement #ForexSetup #TradingIdeas #PriceAction
Australian Dollar Rises Above $0.660Australian Dollar Rises Above $0.660
According to the AUD/USD chart today, the Australian dollar has climbed to its highest level in three weeks. The currency’s strength stems from the following factors:
→ Australia’s monthly consumer price index (CPI) came in stronger than expected. According to Forex Factory, annual inflation reached 3.5%, compared with analysts’ forecasts of 3.1%. This marks the highest reading since July 2024, pointing to renewed inflationary pressure.
→ As a result, traders have significantly reduced bets on further monetary easing. Data from Trading Economics shows that the probability of the Reserve Bank of Australia keeping its interest rate unchanged at 3.6% at its 4 November meeting is now close to 90%.
Technical Analysis of the AUD/USD Chart
Since mid-September, movements in the AUD/USD pair have formed a descending channel (shown in red), built on a series of lower highs and lows starting from point A.
However, note that in mid-October:
→ the price dipped below the lower boundary;
→ the RSI indicator entered oversold territory;
→ candles displayed large bodies;
→ an inverted head and shoulders reversal pattern emerged.
From a Smart Money Concept perspective, it is reasonable to assume that within the area marked by the purple rectangle, Smart Money was accumulating sellers’ liquidity to build long positions.
Following this, the Australian dollar showed strong momentum as the price broke through:
→ resistance at 0.6520 near the channel’s median (forming a bullish gap in the process);
→ the upper boundary of the red channel around 0.6565.
Building on this view → the price now appears to be moving towards a liquidity zone, where Smart Money could find sufficient buy-side liquidity. This area may lie above the 0.6630 level, which previously acted as resistance in early October.
It is also possible that today’s Federal Reserve decision (the Federal Funds Rate announcement scheduled for 21:00 GMT+3) will help this scenario play out.
This article represents the opinion of the Companies operating under the FXOpen brand only. It is not to be construed as an offer, solicitation, or recommendation with respect to products and services provided by the Companies operating under the FXOpen brand, nor is it to be considered financial advice.

AUDUSD H4 | Potential Bearish Reversal from Key Resistance LevelAUD/USD is rising towards the sell entry which is a pullback resistance that aligns with he 78.6% retracement and the 78.6% Fibonacci projection and could reverse from this level to the downside.
Sell entry is at 0.6636, which is a pullback resistance that aligns with the 78.6% retracement and the 78.6% Fibonacci projection.
Stop loss is at 0.6684, which is a swing high resistance.
Take profit is at 0.6559, which is a pullback support.
Stratos Markets Limited (tradu.com ):
CFDs are complex instruments and come with a high risk of losing money rapidly due to leverage. 68% of retail investor accounts lose money when trading CFDs with this provider. You should consider whether you understand how CFDs work and whether you can afford to take the high risk of losing your money.
Stratos Europe Ltd (tradu.com ):
CFDs are complex instruments and come with a high risk of losing money rapidly due to leverage. 70% of retail investor accounts lose money when trading CFDs with this provider. You should consider whether you understand how CFDs work and whether you can afford to take the high risk of losing your money.

Uptrend It is expected that a trend change will take place within the current resistance range and we will witness the beginning of a correction.

AUD/USD Down Trend breakout bullish from key support zone📉 AUD/USD Technical Update 📈
🔥 Pair: AUD/USD
🕓 Timeframe: 4H
The downtrend has broken ✅ and price is showing strong bullish confirmation from the support zone around 0.65500 💪
Currently, buyers are stepping in with momentum 🚀
🎯 Technical Targets:
First Target: 0.66500
Second Target: 0.66800
⚙️ Setup: Buy on bullish confirmation above support
💡 Tip: Always apply proper risk management — protect your capital first!
#️⃣ Like | Comment | Share to support and stay updated on the next moves 💬📊

AUDUSD → Attempt to reverse the trend to bullish FX:AUDUSD is forming a correction after breaking through the resistance of the downward channel. The market needs a trading range or consolidation above 0.6526.
The dollar is consolidating but is not ready to continue growing. Pressure on the currency is emerging ahead of the Fed meeting. This may support the growth of the Australian dollar.
The currency pair is entering a distribution phase after consolidation. The breakout of 0.6526 triggered a break of the downward channel resistance. An attempt to change the trend is forming. If the bulls keep the price above 0.6526, this could trigger further growth.
Resistance levels: 0.6567, 0.661
Support levels: 0.6526, 0.6493
At the moment, an attempt to change the trend has been initiated. Consolidation and distribution are a good sign, but above the previously broken trend line, a trading range should form, which will confirm the fact of a change in the local trend.
Best regards, R. Linda!

Hot CPI Kills Hopes of an RBA CutAustralia's Q3 inflation figures have just dropped, and all surprised to the upside. Not only does this kill hopes of a cut next week — and likely for the rest of the year — but it also suggests the RBA may have already reached the terminal rate of this cutting cycle. I take a quick look at the figures, AUD/USD, and the ASX 200.
Matt Simpson, Market Analyst at City Index and Forex.com.

AUDUSD FRGNT Daily Forecast - Q4 | W44 | D29| Y25 |📅 Q4 | W44 | D29| Y25 |
📊 AUDUSD FRGNT Daily Forecast
🔍 Analysis Approach:
I’m applying Smart Money Concepts, focusing on:
Identifying Points of Interest on the Higher Time Frames (HTFs) 🕰️
Using those POIs to define a clear trading range 📐
Refining those zones on Lower Time Frames (LTFs) 🔎
Waiting for a Break of Structure (BoS) for confirmation ✅
This method allows me to stay precise, disciplined, and aligned with the market narrative, rather than chasing price.
💡 My Motto:
"Capital management, discipline, and consistency in your trading edge."
A positive risk-to-reward ratio, paired with a high win rate, is the backbone of any solid trading plan 📈🔐
⚠️ Losses?
They’re part of the mathematical game of trading 🎲
They don’t define you — they’re necessary, they happen, and we move forward 📊➡️
🙏 I appreciate you taking the time to review my Daily Forecast.
Stay sharp, stay consistent, and protect your capital
— FRNGT 🚀
OANDA:AUDUSD

Digital Assets and Central Bank Digital Currencies (CBDCs)Introduction
The digital revolution has transformed nearly every aspect of modern life — from communication to commerce — and finance is no exception. One of the most profound shifts underway in the global financial landscape is the emergence of digital assets and Central Bank Digital Currencies (CBDCs). These innovations represent the next phase of money’s evolution, where technology and monetary policy converge to redefine how value is stored, transferred, and governed.
While digital assets like cryptocurrencies have emerged from the private sector and decentralized communities, CBDCs represent the formal entry of sovereign governments into the digital money ecosystem. Together, they are reshaping the foundations of the global financial system. This essay explores the nature, development, benefits, risks, and future implications of digital assets and CBDCs, highlighting their distinct roles and their potential to coexist in the financial architecture of the 21st century.
Understanding Digital Assets
Digital assets are electronic representations of value, ownership, or rights that are stored and transacted using digital systems, often based on blockchain or distributed ledger technology (DLT). These assets can represent various forms of value — including cryptocurrencies, security tokens, non-fungible tokens (NFTs), and stablecoins.
The key characteristics of digital assets include:
Digitization: Unlike traditional assets that require physical representation (such as cash or gold), digital assets exist purely in digital form.
Blockchain Technology: Many digital assets operate on decentralized blockchain networks, ensuring transparency, security, and immutability.
Programmability: Digital assets can include smart contracts, allowing automated execution of financial agreements without intermediaries.
Decentralization: Most cryptocurrencies operate without central authorities, relying instead on peer-to-peer verification mechanisms.
Among digital assets, Bitcoin — launched in 2009 — remains the most prominent. It introduced the idea of a decentralized currency not controlled by any government or institution. Following Bitcoin’s success, thousands of other cryptocurrencies emerged, each with unique features and purposes.
Types of Digital Assets
Digital assets can be broadly classified into several categories:
Cryptocurrencies:
Cryptocurrencies like Bitcoin (BTC) and Ethereum (ETH) function as decentralized digital money. They rely on blockchain networks to verify transactions and maintain transparency. Their value is typically determined by market supply and demand rather than by central banks.
Stablecoins:
Stablecoins are designed to minimize price volatility by being pegged to traditional assets like the U.S. dollar, gold, or a basket of currencies. Examples include Tether (USDT) and USD Coin (USDC). They bridge the gap between fiat currency stability and blockchain efficiency.
Security Tokens:
These represent ownership in real-world assets such as stocks, real estate, or bonds, but are traded digitally. Security tokens bring traditional financial instruments into the blockchain ecosystem, offering greater liquidity and accessibility.
Utility Tokens:
These grant access to specific blockchain-based platforms or services. For example, using BNB to pay for transaction fees on Binance.
Non-Fungible Tokens (NFTs):
NFTs represent unique digital items — such as art, collectibles, or intellectual property — that cannot be exchanged on a one-to-one basis like regular tokens.
Central Bank Digital Currencies (CBDCs): Concept and Design
While cryptocurrencies are decentralized and privately created, Central Bank Digital Currencies (CBDCs) are government-issued digital currencies representing a nation’s official currency in electronic form. A CBDC is essentially a digital version of fiat money — issued, regulated, and backed by a country’s central bank.
CBDCs aim to combine the efficiency and innovation of digital payment systems with the stability and trust of traditional central banking. Unlike private cryptocurrencies, CBDCs are legal tender, meaning they must be accepted for all debts, public and private, within the issuing country.
Types of CBDCs
CBDCs can be categorized into two primary forms:
Retail CBDCs:
Intended for use by the general public for everyday transactions — such as payments, savings, and remittances. They function much like digital cash.
Wholesale CBDCs:
Designed for financial institutions and interbank settlements, enhancing efficiency in large-scale payments and cross-border transfers.
Technological Architecture
CBDCs can adopt either a centralized ledger system or a distributed ledger (blockchain).
Centralized systems allow the central bank to maintain complete control over issuance and transactions.
Distributed ledger systems increase transparency and resilience but require sophisticated cybersecurity measures.
Some countries may adopt hybrid models, combining the advantages of both systems to ensure security, privacy, and efficiency.
The Rise of CBDCs: Global Landscape
CBDC development has accelerated rapidly. According to the Bank for International Settlements (BIS), over 130 countries, representing more than 95% of global GDP, are exploring or developing CBDCs.
Leading CBDC Projects
China: The Digital Yuan (e-CNY) is one of the most advanced CBDCs, currently in large-scale pilot testing across major cities.
Europe: The European Central Bank (ECB) is progressing toward launching the Digital Euro to enhance payment efficiency and sovereignty.
India: The Reserve Bank of India (RBI) introduced the e₹ (Digital Rupee) pilot program for wholesale and retail use, focusing on reducing cash dependency.
Bahamas: The Sand Dollar became the world’s first fully operational CBDC in 2020, designed to improve financial inclusion.
Nigeria: The eNaira aims to facilitate faster payments and expand access to digital financial services.
This global momentum reflects the recognition that CBDCs could transform not only domestic payments but also international trade and monetary policy transmission.
Benefits of Digital Assets and CBDCs
1. Financial Inclusion
Digital assets and CBDCs can extend financial services to the unbanked population, particularly in developing countries. With just a smartphone, individuals can access a digital wallet, enabling participation in the economy without needing a traditional bank account.
2. Efficiency and Cost Reduction
Digital currencies streamline payment systems by eliminating intermediaries, reducing transaction times, and lowering costs for both domestic and cross-border payments.
3. Transparency and Security
Blockchain technology provides immutable and traceable records of transactions, reducing fraud and enhancing trust. Governments can track illicit financial activities more effectively.
4. Monetary Policy Innovation
CBDCs offer central banks greater control over monetary policy. They can enable direct stimulus payments, programmable money for targeted spending, and more efficient interest rate transmission.
5. Enhanced Cross-Border Transactions
CBDCs and stablecoins could revolutionize global trade settlements by making cross-border payments faster, cheaper, and more transparent than traditional systems like SWIFT.
6. Reduction in Cash Handling
The digitization of money reduces the costs and logistical challenges of printing, transporting, and securing physical currency.
Challenges and Risks
Despite their potential, digital assets and CBDCs face significant hurdles:
1. Privacy Concerns
CBDCs could give governments access to vast amounts of personal financial data. Balancing transparency and individual privacy is a critical challenge.
2. Cybersecurity Risks
Digital currencies are susceptible to hacking, data breaches, and technical failures. Ensuring robust cybersecurity infrastructure is essential.
3. Financial Stability Risks
The widespread adoption of digital currencies could disrupt traditional banking systems by reducing deposits, affecting banks’ ability to lend.
4. Technological Infrastructure
Developing and maintaining secure digital ecosystems requires significant investment, especially in developing countries with limited digital infrastructure.
5. Interoperability
Without global standards, different CBDCs may not easily interact with one another, limiting their effectiveness in international trade.
6. Regulatory Uncertainty
The evolving regulatory environment for digital assets creates uncertainty for investors and institutions. Clear and consistent regulations are necessary to foster confidence.
CBDCs vs. Cryptocurrencies
While both CBDCs and cryptocurrencies exist digitally, their core philosophies diverge sharply.
Feature Cryptocurrencies CBDCs
Issuer Private or decentralized networks Central banks
Control Decentralized Centralized
Legal Tender No Yes
Volatility High Stable
Transparency Public blockchain Permissioned or restricted access
Purpose Alternative to traditional money Digital evolution of existing money
CBDCs may eventually coexist with cryptocurrencies, serving different purposes — CBDCs for stable, regulated payments and crypto assets for investment, innovation, or decentralized finance (DeFi).
Digital Assets and CBDCs: Impact on the Global Economy
The integration of digital currencies is expected to reshape global finance in several ways:
Redefining the Role of Banks:
Commercial banks might face reduced deposit bases if individuals hold CBDCs directly with central banks. This could alter the structure of credit markets and financial intermediation.
Enhancing Cross-Border Trade:
CBDCs can simplify foreign exchange and international remittances, potentially bypassing traditional intermediaries and reducing transaction times from days to seconds.
Geopolitical Influence:
Countries pioneering CBDC technology could gain strategic advantages in global finance. For example, China’s Digital Yuan could challenge the dominance of the U.S. dollar in international trade.
Acceleration of De-dollarization:
CBDCs could support the trend of de-dollarization by promoting local currency usage in international settlements, reducing dependence on the U.S. dollar.
Innovation in Financial Services:
The programmable nature of digital currencies can foster innovation in areas like automated taxation, welfare distribution, and smart contracts.
The Road Ahead: The Future of Digital Finance
The evolution toward a fully digital monetary ecosystem appears inevitable. However, achieving a balanced system that combines innovation, inclusion, and stability will require global cooperation.
Central banks, regulators, and private innovators must collaborate to establish interoperability frameworks, cybersecurity standards, and data privacy protections. Moreover, education and digital literacy will be critical to ensure equitable access to these new financial tools.
In the long run, the coexistence of digital assets, CBDCs, and traditional money will likely define a hybrid financial ecosystem — one that blends decentralization and regulation, efficiency and security, innovation and oversight.
Conclusion
Digital assets and Central Bank Digital Currencies (CBDCs) are more than technological innovations; they represent a paradigm shift in how value circulates across the globe. Digital assets, driven by decentralization and market innovation, have democratized finance and expanded access to wealth creation. Meanwhile, CBDCs offer the potential to modernize monetary systems, improve payment efficiency, and strengthen financial sovereignty.
As we move further into the digital era, the challenge lies not in choosing between these forms of money but in integrating them responsibly. The future of global finance will depend on striking the right balance between innovation and regulation, ensuring that digital currencies enhance — rather than disrupt — global financial stability. The next decade will likely witness a harmonized system where both private digital assets and public CBDCs coexist, shaping the foundation of a more inclusive, transparent, and efficient financial world.

Thoughts on the current narrative: Tuesday 28 October The overall positivity has continued, the AUD is currently the standout strong currency, thanks to US / CHINA de-escalation hopes and possibly anticipation of a high CPI print (due during the upcoming ASIAN session).
Barring a bout of JPY strength (possibly profit taking following positive rhetoric as Mr Trump visits Japan?).
The USD and JPY have remained weak following the weekly 'opening gap'.
Regarding 'opening gaps', I personally look at the chart as if it was a single candle, which generally leads to an inclination that a pullback is due sooner rather than later.
The GBP is in the douldrums thanks to fresh fiscal concerns. Combined with last week's 'soft CPI data' there is a very strong case for short GBP, particularly AUD GBP short. Although, I hasten to add that I would still 'long the GBP' as part of a 'risk on trade', if it had the most momentum at the time, such as GBP JPY long.
Currently, my view is to continue looking for 'risk on trades'. Ideally with 'at least' a cluster of 15 min swings (ideally 1hr swing), following a pullback. JPY or USD (arguably CHF) short. Vs AUD or whichever currency you favour in the moment.
Of course, there are a plethora of events to potentially change the narrative at any moment. Earnings season, FOMC, AUD CPI, BOJ. Along with the ongoing US / CHINA narrative. Thursday's European session in particular could be interesting following the FOMC, BOJ and tech earnings all reported within a few hours of each other.
Currently, considering the shutdown, I'm content with two trades per week. It's pleasingly surprising that although I've only placed one trade so far, I am thinking that I could have placed three. (2x risk on, 1x GBP)
AUDUSD Rebounds Strongly: Double Bottom Signals Bullish ReversalAUDUSD Rebounds Strongly: Double Bottom Signals Bullish Reversal
AUDUSD has formed a Double Bottom Pattern around the 0.6460 support zone — a classic bullish reversal signal.
The pair has since broken above a minor resistance, confirming short-term bullish momentum.
Currently trading near 0.6550, AUD/USD looks poised to continue higher toward the next key resistance levels and targets at:
0.6580
0.6615
If price sustains above 0.6520, this upward structure should remain intact.
However, a drop below 0.6460 would invalidate the pattern and signal renewed bearish pressure.
Overall, AUDUSD shows promising signs of recovery, with technical structure favoring further upside potential in the short term.
You may find more details in the chart!
Thank you and Good Luck!
❤️PS: Please support with a like or comment if you find this analysis useful for your trading day❤️

SHORT SIGNAL Price contacted 4h 🟤Supply zone, we're expecting the price to drop from this 🟤supply zone.
