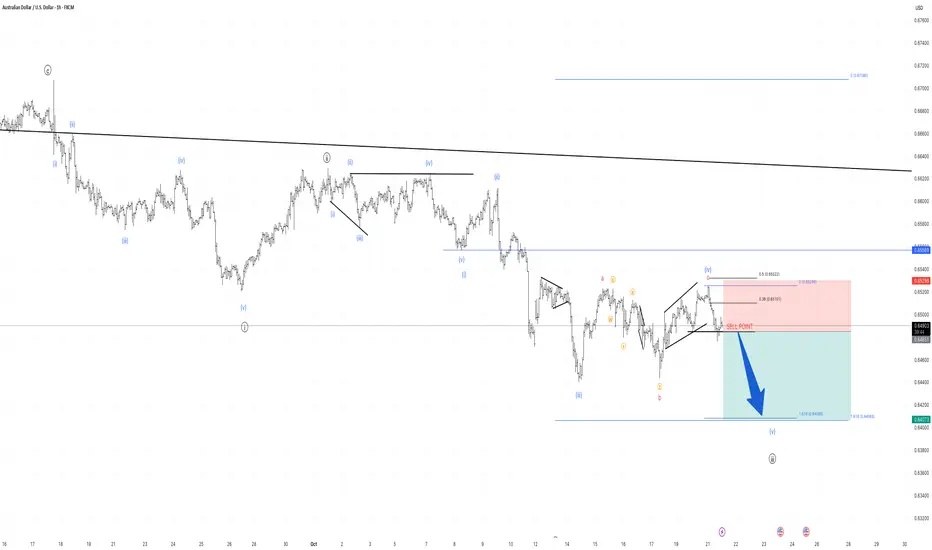
Bearish Outlook: Completion of Wave 5 Based on Elliott Wave and We're currently observing the end of Wave 3, based on Elliott Wave Principle, leading us to expect a downward shift towards Wave 5 completion. The bearish target is set at the 161.8% Fibonacci level, as measured from the height of Wave 3.
Despite a seemingly clear path to a bearish scenario, it's essential to incorporate risk management strategies and keep an eye on other contributing market factors, adjusting trade positions as necessary. Trade wisely and remember that market indicators are guides, not guaranteed predictions.
(Disclaimer: This analysis is intended for educational purposes; it's crucial to do your own research before making investment decisions.)
Trade ideas
AUDUSDBased on my interpretation, the market suggests price may trend lower. A solid retest of resistance, followed by a wick rejection, would signal a strong selling opportunity.


AUDUSD Will Go Higher! Buy!
Take a look at our analysis for AUDUSD.
Time Frame: 9h
Current Trend: Bullish
Sentiment: Oversold (based on 7-period RSI)
Forecast: Bullish
The price is testing a key support 0.648.
Current market trend & oversold RSI makes me think that buyers will push the price. I will anticipate a bullish movement at least to 0.655 level.
P.S
We determine oversold/overbought condition with RSI indicator.
When it drops below 30 - the market is considered to be oversold.
When it bounces above 70 - the market is considered to be overbought.
Like and subscribe and comment my ideas if you enjoy them!


Hedge Fund Secrets: Unveiling the Hidden World of High-FinanceIntroduction
Hedge funds represent one of the most mysterious and influential corners of global finance. Often surrounded by secrecy and elite status, they attract both admiration and controversy. While mutual funds are accessible to the average investor, hedge funds are designed for the wealthy—institutions, corporations, and high-net-worth individuals—who seek aggressive growth and diversification. The “secrets” of hedge funds lie not only in their strategies but also in their flexibility, risk-taking ability, and sophisticated financial engineering.
This essay explores the structure, functioning, strategies, and inner workings of hedge funds—uncovering the tactics and philosophies that make them powerful engines in the financial markets.
1. What Is a Hedge Fund?
A hedge fund is a private investment partnership that pools money from investors and employs a range of strategies to earn high returns, often regardless of market direction. Unlike mutual funds, hedge funds are lightly regulated and have more freedom in how they invest. They can use leverage (borrowed money), short selling, derivatives, and alternative assets such as real estate, commodities, cryptocurrencies, or private equity.
The term “hedge” comes from the original goal—to “hedge” against market risk by taking offsetting positions. However, modern hedge funds have evolved into aggressive return-seeking vehicles, willing to take large, calculated risks for potentially outsized profits.
2. The Secret Structure: Limited Partnership Model
Most hedge funds operate under a limited partnership (LP) structure:
The general partner (GP) manages the fund, makes investment decisions, and assumes full liability.
The limited partners (LPs) are the investors who provide the capital but have limited liability.
This structure allows hedge fund managers to maintain flexibility and control while protecting investors from excessive risk exposure. The GP typically earns a management fee (2%) of total assets and a performance fee (20%) of profits—known as the “2 and 20 rule.” This incentivizes managers to maximize returns.
This performance-based compensation is one of the fund’s “secrets to motivation.” It aligns the manager’s goals with the investors’—both profit when performance is strong. However, it also encourages risk-taking, as the rewards can be massive.
3. The Secret Ingredient: Flexibility and Freedom
Unlike mutual funds or pension funds, hedge funds have minimal investment restrictions. This flexibility is their biggest advantage. Hedge funds can:
Short sell stocks (bet on price decline)
Use leverage to amplify returns
Trade derivatives like options, futures, and swaps
Invest globally across asset classes
Move in and out of positions rapidly
This freedom allows hedge funds to profit in bull or bear markets. For instance, during the 2008 financial crisis, some hedge funds—like John Paulson’s—made billions by betting against the U.S. housing market using credit default swaps.
4. Hedge Fund Strategies: The Real Secrets
Hedge funds are not a single strategy—they are a collection of sophisticated investment techniques. Some of the most powerful and “secretive” strategies include:
A. Long/Short Equity
The classic hedge fund strategy. Managers buy undervalued stocks (long) and short overvalued ones (short). The goal is to profit from relative performance rather than overall market direction.
Example: If a manager expects Apple to outperform Samsung, they go long Apple and short Samsung, profiting from the spread regardless of whether the tech sector rises or falls.
B. Global Macro
This strategy exploits global economic trends—interest rates, currencies, commodities, and geopolitical events. Legendary investor George Soros famously used this approach when he “broke the Bank of England” in 1992, betting against the British pound and earning over $1 billion.
C. Event-Driven
Event-driven funds profit from corporate events such as mergers, bankruptcies, or restructurings. Merger arbitrage is common: buying shares of a company being acquired and shorting the acquirer to profit from the deal’s price spread.
D. Quantitative (Quant) Strategies
Quant funds use advanced algorithms, machine learning, and statistical models to find patterns in massive data sets. These funds rely on technology and mathematics rather than human judgment.
Firms like Renaissance Technologies (founded by Jim Simons) have built mathematical models that consistently outperform markets—a true “black box” secret of modern finance.
E. Distressed Securities
These funds buy the debt of companies in financial trouble, betting that they will recover or that assets can be sold for more than their current market value. This strategy requires deep expertise in corporate law, restructuring, and valuation.
F. Multi-Strategy
Large funds diversify across multiple strategies to balance risk and return. These “all-weather” funds can adapt quickly to changing market conditions.
5. Leverage: The Power and the Danger
One of the most closely guarded secrets of hedge funds is how they use leverage to amplify returns. By borrowing money, a hedge fund can increase its exposure to profitable trades. For instance, a 10% return on a $1 billion position becomes 20% if the fund borrows another $1 billion.
However, leverage also magnifies losses. Many hedge fund collapses—like Long-Term Capital Management (LTCM) in 1998—occurred because excessive leverage turned small losses into disasters. The secret lies in risk management discipline: knowing when to cut losses and when to increase exposure.
6. Risk Management: The Hidden Backbone
While hedge funds are often portrayed as reckless gamblers, successful ones are masters of risk management. They use advanced models to monitor:
Value at Risk (VaR): the maximum expected loss over a given period.
Beta: sensitivity to market movements.
Drawdown limits: maximum allowed decline before positions are cut.
Some hedge funds employ dedicated risk teams independent of portfolio managers. The secret here is not just in taking risks—but in knowing which risks are worth taking.
7. Information Edge: The Secret Weapon
Information is the lifeblood of hedge funds. Successful managers invest heavily in data analytics, market intelligence, and proprietary research. The best funds have access to alternative data—credit card transactions, satellite imagery, social media trends, and supply chain data—that help them detect market trends before others.
In essence, hedge funds compete on information asymmetry. The faster and more accurately they interpret data, the greater their advantage.
However, this “edge” must stay within legal limits. In the past, some hedge funds were caught in insider trading scandals, revealing the fine line between legitimate research and illegal access to non-public information.
8. The Psychology of Hedge Fund Managers
Another hidden secret lies in the psychological resilience of hedge fund managers. The job involves high pressure, rapid decision-making, and emotional control. Successful managers often possess:
Contrarian thinking: Going against market consensus.
Risk tolerance: Comfort with uncertainty and volatility.
Discipline: Following the model or thesis even under stress.
Adaptability: Changing strategies when markets shift.
In many ways, hedge fund management is as much an art as a science—combining intellect, intuition, and emotional stability.
9. Technology: The New Frontier
Modern hedge funds are deeply intertwined with technology and artificial intelligence. High-frequency trading (HFT), machine learning algorithms, and predictive analytics now dominate the industry. Algorithms can execute trades in microseconds, identifying inefficiencies humans cannot detect.
The secret advantage of top-tier funds like Two Sigma or Citadel lies in their data infrastructure—massive computing power, real-time analytics, and AI-driven prediction models. These technological tools enable them to extract tiny profits millions of times per day.
10. Secrecy and Regulation
Hedge funds are notoriously secretive about their strategies. Their competitive advantage depends on keeping algorithms, models, and data confidential. Unlike mutual funds, they are not required to disclose holdings publicly. Investors receive quarterly or annual reports, but details remain hidden to protect intellectual property.
However, after major scandals and financial crises, regulators have increased oversight. The U.S. Securities and Exchange Commission (SEC) now requires large hedge funds to register and disclose basic information about risk and leverage. Yet, compared to other financial institutions, they still enjoy considerable privacy.
11. Hedge Funds and Market Influence
Though they represent a small portion of total global assets, hedge funds have an outsized impact on financial markets due to their leverage and trading volume. They can:
Move markets through large positions.
Provide liquidity during volatile times.
Expose overvalued or fraudulent companies (through short selling).
Hedge institutional portfolios against systemic risks.
However, their power can also destabilize markets if excessive leverage or herd behavior occurs—as seen during the 2008 crisis or the GameStop short squeeze of 2021.
12. The Dark Side: Failures and Risks
Not all hedge funds are successful. Many close within a few years due to poor performance, high fees, or changing market conditions. Common causes of failure include:
Over-leverage: excessive borrowing leading to collapse.
Overconfidence: ignoring market signals.
Lack of liquidity: inability to exit positions in time.
Misaligned incentives: managers chasing bonuses over long-term success.
The hedge fund secret to survival is adaptability—those that continuously evolve with technology, regulation, and global trends endure.
13. The Future of Hedge Funds
The hedge fund industry is changing rapidly. Artificial intelligence, blockchain, and decentralized finance (DeFi) are reshaping investment strategies. Investors are demanding lower fees and greater transparency, pushing funds to prove their value.
Sustainability is also becoming important. New hedge funds now explore ESG (Environmental, Social, Governance) strategies, blending profitability with ethical investing.
The next generation of hedge funds will likely combine AI-driven insights, quantitative analytics, and global macro intelligence—a fusion of technology and human expertise.
Conclusion
Hedge funds remain one of the most fascinating institutions in modern finance. Their “secrets” are not mystical tricks but a blend of flexibility, innovation, information, and discipline. They thrive on uncovering inefficiencies in the global financial system, exploiting them with speed, intelligence, and precision.
At their best, hedge funds bring liquidity, innovation, and market efficiency. At their worst, they amplify volatility and risk. The truth lies in their dual nature—both as engines of progress and mirrors of financial ambition.
In the end, the ultimate hedge fund secret is mastery over uncertainty—turning chaos into opportunity through knowledge, technology, and courage.

AUDUSD Descending triangle breakout bullish move 📉 AUD/USD Technical Setup (1H Timeframe)
The pair has broken out of a descending triangle pattern 🔺 showing strong bullish momentum from the 0.6490 level 💪
🎯 Upside Targets:
1️⃣ 0.6520
2️⃣ 0.6570
3️⃣ 0.6600
Momentum remains bulls-in-control as long as price holds above 0.6490 support zone ⚡
💡 Watching for continuation moves toward upper resistance levels if buying pressure sustains.
#AUDUSD #Forex #PriceAction #TechnicalAnalysis #TradingSetup 💹

AudUsd Sell IdeaWIth AudUsd being in bearish range and bearish on higher time frames I''ll personally be looking to short the pair for a 1:3rr. If price can break and retest the level (blue box) I'm interested in then we would have a clean bearish flip with a respect of a major resistance level to continue the bearish trend. We'll see what happens.

Potential Reversal Ready To Flip AU On Its "Head"Price on OANDA:AUDUSD is almost complete with forming the Right and final Shoulder of the potential Inverted Head and Shoulders Pattern!
Once Price has visited the Neckline of the Pattern, it will be Confirmed and will suggest that Price is looking to head higher!!
Once Confirmed, we will want to wait for a Valid Breakout and a Retest to generate potential Long Opportunities to take up to the next Resistance @ .6620!

AUDUSD FREE SIGNAL|SHORT|
✅AUDUSD price will soon enter the supply zone and may show a corrective reaction. A short-term pullback could confirm the retest, aligning with the next downside target near 0.6500. Time Frame 2H.
SHORT🔥
✅Like and subscribe to never miss a new idea!✅

AUDUSD | 1H ChartAUDUSD | 1H Chart
Price has broken the last Lower High (LH), confirming a Market Structure Shift (MSS / CHoCH).
It also broke the neckline of a Double Bottom pattern.
Currently, price is retracing back to the neckline area — I’ll wait for it to reach the neck base for a potential buy entry targeting the next resistance zone.
🎯 Buy Target → 0.65240
OANDA:AUDUSD

AUDUSD Bullish Trade SetupTrend: Bearish
Divergence: Bullish
Reversal Pattern: Double Bottom
Bias: Bullish
Scenario:Entry at LH Break
Trade Plan
Stop Loss : 0.644
Entry Level: 0.65315
TP: 0.6635

AUDUSD Potential Sell SetupPrice approaching to previous Asian Session High combined with psychological level I’m expecting to price to go down. not financial advice
Entry: 0.65129
Stop Level: 0.65229
TP Level: 64700

AUDUSD Bearish oversold bounce back resistance at 0.6546The AUDUSD remains in a neutral trend, with recent price action showing signs of a corrective pullback within the broader uptrend.
Support Zone: 0.6475 – a key level from previous consolidation. Price is currently testing or approaching this level.
A bullish rebound from 0.6475 would confirm ongoing upside momentum, with potential targets at:
0.6546 – initial resistance
0.6575 – psychological and structural level
0.6590 – extended resistance on the longer-term chart
Bearish Scenario:
A confirmed break and daily close below 0.6475 would weaken the bullish outlook and suggest deeper downside risk toward:
0.6460 – minor support
0.6440 – stronger support and potential demand zone
Outlook:
Neutral bias remains intact while the AUDUSD trades around pivotal 0.6475 level. A sustained break below or above this level could shift momentum.
This communication is for informational purposes only and should not be viewed as any form of recommendation as to a particular course of action or as investment advice. It is not intended as an offer or solicitation for the purchase or sale of any financial instrument or as an official confirmation of any transaction. Opinions, estimates and assumptions expressed herein are made as of the date of this communication and are subject to change without notice. This communication has been prepared based upon information, including market prices, data and other information, believed to be reliable; however, Trade Nation does not warrant its completeness or accuracy. All market prices and market data contained in or attached to this communication are indicative and subject to change without notice.

SELL AUDUSD NOW - Profitable trade opportunity!Based on our deep analysis we can see that AUDUSD will head to the downside. Great time to SELL - it is currently in a MAJOR downtrend and is struggling to break past resistance levels. The next target is the support level to the downside. This is a great low risk high reward trade. SELL NOW!

AUDUSD - Signal#AUDUSD - Signal
H4 - Formation of a triangular structure in continuation of the 5th wave on D1 + rebound from the upper boundary. Stop behind the local maximum.
Entry: 0.64911
TP: 0.64416 - 0.64034 - 0.63570 - 0.63040
Stop: 0.65178

AUDUSD H4 | Heading Into 61.8% Fibonacci ResistanceBased on the H4 chart analysis, we could see the price rise to the sell entry which is a pullback resistance that aligns with the 61.8% Fibonacci retracement and could reverse from this level to the downside.
Sell entry is at 0.6548, which is a pullback resistance that lines up with the 61.8% Fibonacci retracement.
Stop loss is at 0.6621, which is a multi swing high resistance.
Take profit is at 0.6445, which is a multi swing low support.
High Risk Investment Warning
Trading Forex/CFDs on margin carries a high level of risk and may not be suitable for all investors. Leverage can work against you.
Stratos Markets Limited (tradu.com ):
CFDs are complex instruments and come with a high risk of losing money rapidly due to leverage. 65% of retail investor accounts lose money when trading CFDs with this provider. You should consider whether you understand how CFDs work and whether you can afford to take the high risk of losing your money.
Stratos Europe Ltd (tradu.com ):
CFDs are complex instruments and come with a high risk of losing money rapidly due to leverage. 66% of retail investor accounts lose money when trading CFDs with this provider. You should consider whether you understand how CFDs work and whether you can afford to take the high risk of losing your money.
Stratos Global LLC (tradu.com ):
Losses can exceed deposits.
Please be advised that the information presented on TradingView is provided to Tradu (‘Company’, ‘we’) by a third-party provider (‘TFA Global Pte Ltd’). Please be reminded that you are solely responsible for the trading decisions on your account. There is a very high degree of risk involved in trading. Any information and/or content is intended entirely for research, educational and informational purposes only and does not constitute investment or consultation advice or investment strategy. The information is not tailored to the investment needs of any specific person and therefore does not involve a consideration of any of the investment objectives, financial situation or needs of any viewer that may receive it. Kindly also note that past performance is not a reliable indicator of future results. Actual results may differ materially from those anticipated in forward-looking or past performance statements. We assume no liability as to the accuracy or completeness of any of the information and/or content provided herein and the Company cannot be held responsible for any omission, mistake nor for any loss or damage including without limitation to any loss of profit which may arise from reliance on any information supplied by TFA Global Pte Ltd.
The speaker(s) is neither an employee, agent nor representative of Tradu and is therefore acting independently. The opinions given are their own, constitute general market commentary, and do not constitute the opinion or advice of Tradu or any form of personal or investment advice. Tradu neither endorses nor guarantees offerings of third-party speakers, nor is Tradu responsible for the content, veracity or opinions of third-party speakers, presenters or participants.

AUD/USD Recovers, Are Gains Just Getting Started?Market Analysis: AUD/USD Recovers, Are Gains Just Getting Started?
AUD/USD is attempting a recovery wave from 0.6440.
Important Takeaways for AUD/USD Analysis Today
- The Aussie Dollar found support near 0.6440 and is now recovering against the US Dollar.
- There was a break above a key bearish trend line with resistance at 0.6490 on the hourly chart of AUD/USD.
AUD/USD Technical Analysis
On the hourly chart of AUD/USD, the pair dipped from well above 0.6600. The Aussie Dollar declined below 0.6500, but the bulls were active near 0.6440 against the US Dollar.
A low was formed near 0.6440, and the pair is now correcting losses. There was a move above the 23.6% Fib retracement level of the downward wave from the 0.6612 swing high to the 0.6440 low. There was also a break above a key bearish trend line with resistance at 0.6490.
The pair is now above 0.6500 and the 50-hour simple moving average. On the upside, immediate resistance is near the 50% Fib retracement at 0.6525.
The first major hurdle for the bulls could be 0.6545. A clear upside break above 0.6545 could send the pair toward 0.6610. The next area of interest on the AUD/USD chart is near 0.6650, above which the price could rise toward 0.6680. Any more gains might send the pair toward 0.6720.
On the downside, initial support is near 0.6490 or the 50-hour simple moving average. The key breakdown zone could be 0.6465 and 0.6440. Any more losses might send the pair toward 0.6400.
This article represents the opinion of the Companies operating under the FXOpen brand only. It is not to be construed as an offer, solicitation, or recommendation with respect to products and services provided by the Companies operating under the FXOpen brand, nor is it to be considered financial advice.

AUDUSD - Buy the dip at daily support!AUDUSD is still traveling inside a broader descending channel, but on the H1 we’ve carved a tight range/contracting structure.
Price is now approaching a daily support zone that aligns with the channel’s lower boundary and a local rising base—strong confluence for a bounce.
I’ll look for longs from the green support area after a clear H1 bullish reaction (wick rejections, bullish engulfing, or break–retest of the intraday lower-high line). If triggered, I’ll trail into the range highs first, then the upper orange boundary.
All Strategies Are Good; If Managed Properly!
~Richard Nasr.

Potential bearish drop off?The Aussie (AUD/USD) is reacting off the pivot which is an overlap resistance and could drop to the 1st support which acts as an overlap support.
Pivot: 0.6532
1st Support: 0.6400
1st Resistance: 0.6625
Disclaimer:
The above opinions given constitute general market commentary, and do not constitute the opinion or advice of IC Markets or any form of personal or investment advice.
Any opinions, news, research, analyses, prices, other information, or links to third-party sites contained on this website are provided on an "as-is" basis, are intended only to be informative, is not an advice nor a recommendation, nor research, or a record of our trading prices, or an offer of, or solicitation for a transaction in any financial instrument and thus should not be treated as such. The information provided does not involve any specific investment objectives, financial situation and needs of any specific person who may receive it. Please be aware, that past performance is not a reliable indicator of future performance and/or results. Past Performance or Forward-looking scenarios based upon the reasonable beliefs of the third-party provider are not a guarantee of future performance. Actual results may differ materially from those anticipated in forward-looking or past performance statements. IC Markets makes no representation or warranty and assumes no liability as to the accuracy or completeness of the information provided, nor any loss arising from any investment based on a recommendation, forecast or any information supplied by any third-party.

AUDUSD SELL 0.6593On the 4-hour chart, AUDUSD has stabilized and rebounded, and the short-term price is expected to continue to rise. Currently, attention can be paid to the resistance near 0.6593 above, which is a potential short position for a bearish bat pattern and is also within the previous supply zone.

AUD/USD Bulls Eye Mean Reversion HigherBearish volatility diminished last week, with AUD/USD printing a small bullish candle on the weekly chart. The daily chart suggests demand resides around 0.6450 with two lower spikes arriving on Tuesday and Friday, despite softer jobs figures from Australia reviving some hopes of a November RAB cut.
With prices having recovered back above the 200-day EMA and monthly S1 pivot, the bias is for mean reversion high on the daily chart towards trend resistance.
Bulls could seek dips towards the 200-day EMA in anticipation of a move towards the 0.6550 high-volume node (HVN) or bearish trendline.
Matt Simpson, Market Analyst at City Inde and Forex.com.

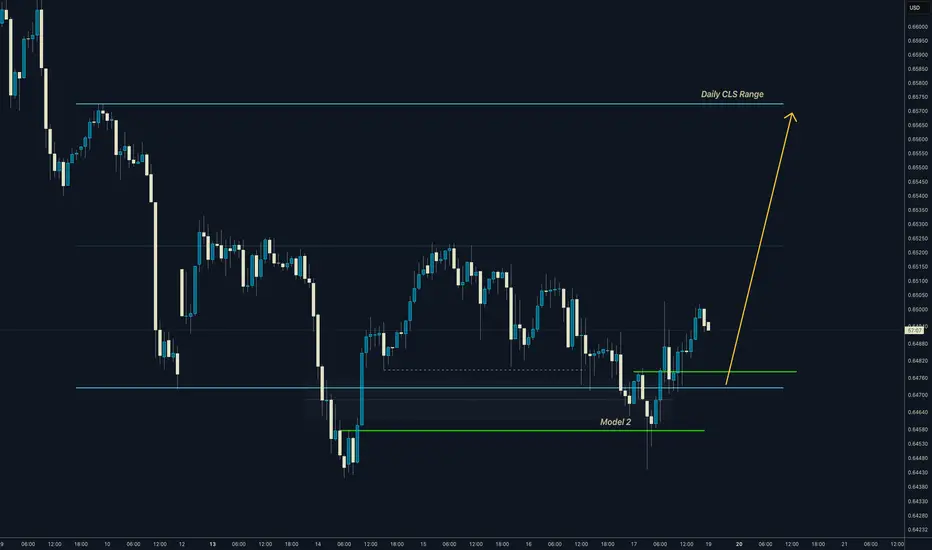
AUDUSD I Daily CLS Range I Model 2 Setup I Full range targetHi friends, new range created. As always we are looking for the manipulation in to the key level around the range. Don't forget confirmation switch from manipulation phase to the distribution phase to make the setup valid. Stay patient and enter only after change in order flow. If price reaches 50% of the range take partial or full close.
🧩 Complete proces and Strategy explained 👇 Click Below
🎯 Why your market approach also should be mechanical ?
NO Fixed Mechanical Trading Logic - You are guessing random patterns
NO Defined trading plan - Every trade different logic
NO Same logic in each trade - Not possible to backtest
NO Backtests on at least 300 trades - Not knowing Statistics
➡️ No Statistics ➡️ No Edge ➡️ Mindset ProblemS
🧠 Core of mindset problems
If you don't know your statistics on large enough data sample. You don't know your probabilities of win rate once the losing streak happen and it happens to every strategy. You will start doubting, hesitating to take next trade because you don't know statistics of your losses. In the end you will be doubting strategy and then jump to different one. You will be in the endless loop for years, looking for new better strategy. 👊 Your ultimate goal as a trader is not to be a generalist who knows 10 000 patterns. But rather create one system with narrowed criteria of each element of the trade to remove subjective and emotional decisions as much as possible and stick to this system no matter what. Practice it 10 000 times become a MASTER.
✨ Trading Mastery is reflection of your life
Have a longterm plan, No Alcohol & Drugs, Ignore others, Focus on your journey , Backtest regularly, Review your weeks, Journal mistakes, Exercise, Sleep well, Read books, Walks in nature (no phone) , Meditate, Reduce social media time, Spend time with family, Live Life.
Trading is hard, but not impossible. I believe in you 💪
David Perk aka Dave Fx Hunter