USD/CAD Trade Idea: Short Setup at 1.3811 ExplainedUSD/CAD is forming a strong short setup at 1.3811. A heavy volume cluster + small FVG signal that sellers built shorts before driving price lower. This confluence makes the level strong, and we should wait for a pullback to short from it. There’s also a weak low below, which price often targets—ideal for partial trailing.
Trade ideas

Bullish bounce off major support?The Loonie (USD/CAD) is reacting off the pivot, which acts as an overlap support and could bounce to the 1st resistance, which is an overlap resistance that is slightly below the 50% Fibonacci retracement.
Pivot: 1.3755
1st Support: 1.3568
1st Resistance: 1.4015
Disclaimer:
The above opinions given constitute general market commentary, and do not constitute the opinion or advice of IC Markets or any form of personal or investment advice.
Any opinions, news, research, analyses, prices, other information, or links to third-party sites contained on this website are provided on an "as-is" basis, are intended only to be informative, is not an advice nor a recommendation, nor research, or a record of our trading prices, or an offer of, or solicitation for a transaction in any financial instrument and thus should not be treated as such. The information provided does not involve any specific investment objectives, financial situation and needs of any specific person who may receive it. Please be aware, that past performance is not a reliable indicator of future performance and/or results. Past Performance or Forward-looking scenarios based upon the reasonable beliefs of the third-party provider are not a guarantee of future performance. Actual results may differ materially from those anticipated in forward-looking or past performance statements. IC Markets makes no representation or warranty and assumes no liability as to the accuracy or completeness of the information provided, nor any loss arising from any investment based on a recommendation, forecast or any information supplied by any third-party.

possibility of uptrend It is expected that a triangle pattern will form and then we will see the start of the upward trend. With the support trend line broken, the continuation of the downward trend is likely.

USDCAD 4HCurrently, USDCAD is positioned at a key support level. Based on the price reaction in this area, it is expected that the trend will gradually move upward, potentially reaching the 1.4000 level.


Long trade
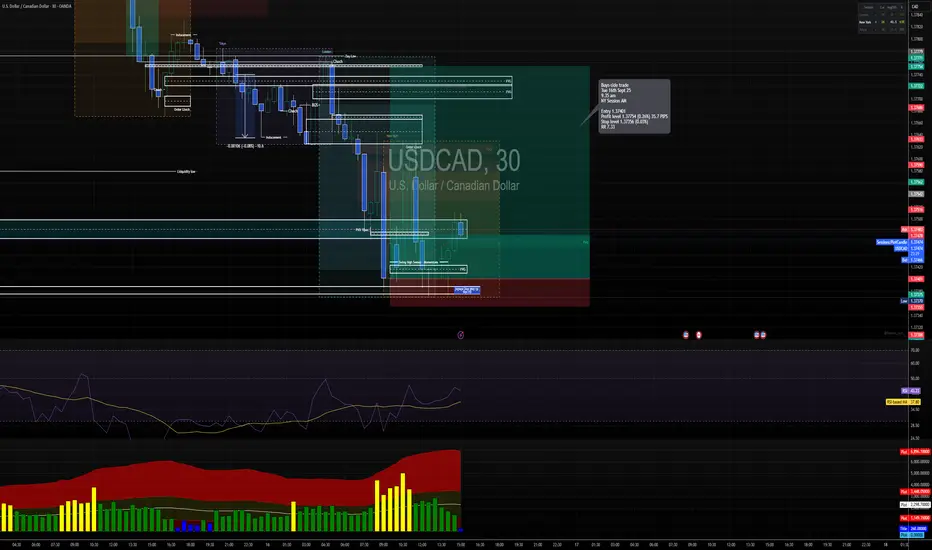
Trade 2
Type: Buyside trade 2
Date: Thurs 18th Sept 25
Session: NY Session AM
Entry: 1.34973
Profit level: 1.35273 (+0.20%) → 26.1 pips
Stop level: 1.34947 (-0.05%) → 2.6 pips
RR: 2.1
Narrative:
Following the earlier stop-out, a second entry was executed after confirmation of bullish structure. The market engineered liquidity below intra-day lows before running back into a bullish order block aligned with the 15m FVG. Entry was timed to coincide with the NY AM open drive

Lingrid | USDCAD Sideways Market Long Opportunity FX:USDCAD has been trading within a clear sideways channel after facing strong rejection from the resistance zone near 1.3925. Price has since formed a lower high and dipped into the 1.3764–1.3693 support region, where buyers are attempting to stabilize. A bounce from this demand area could fuel a recovery toward 1.3850, but the broader structure remains corrective unless price clears above the descending trendline.
⚠️ Risks:
A sustained break below 1.3765 would expose 1.3700 and the deeper support area.
Stronger crude oil prices could strengthen the CAD and weigh on USDCAD.
Unexpected hawkish Fed comments may disrupt the short-term rebound scenario.
If this idea resonates with you or you have your own opinion, traders, hit the comments. I’m excited to read your thoughts!

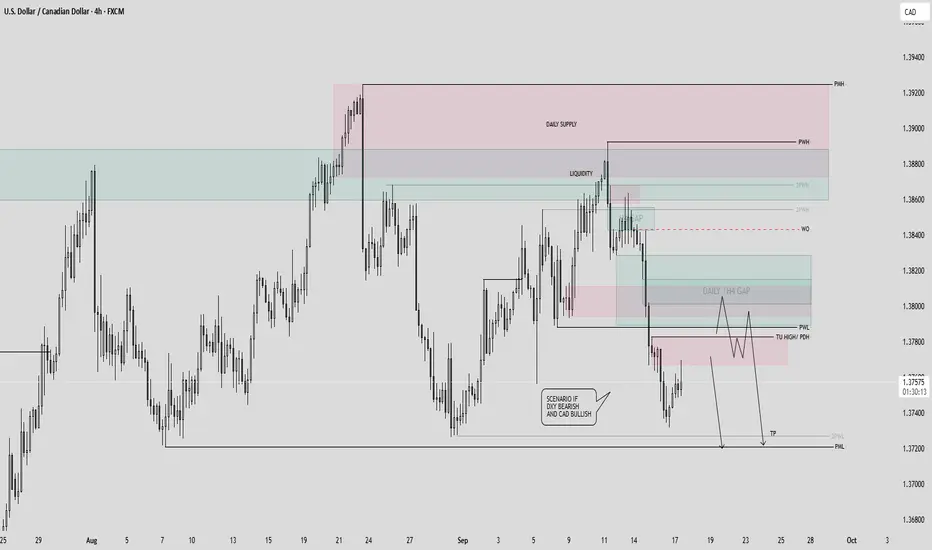
USDCAD SELL SETUP OPPORTUNITY IF PULLBACKHello traders I wish you a great WEDNESDAY, Here's my point of view about CMCMARKETS:USDCAD
TECHNICALLY:
HIGHER TIME FRAMES such as DAILY WEEKLY show a liquidity grab before a bearish momentum near the 2-3 previous weekly highs around the 1.38800. This liquidity grab was released last week on Thursday- Friday. Then price re-integrated and gave us a valid sell setup that was aligned with our strategy to sell at the H4 GAP RETEST. Right now, price is very over extended and we are all waiting for pullbacks. Either way, we all have to wait for FOMC to be released today & CAD rates released. This will invalidate or confirm our setup. Next target is the previous monthly low at 1.37250. I am interested to sell close the 1.3800O OR ABOVE THE PREVIOUS DAILY HIGH.
FUNDAMENTALLY
All eyes on today's FOMC! a change in the US DOLLAR SENTIMENT can invalidate the setup! However, if we stick with the same tone, then US will likely continue bearish!
You may find more details in the chart!
Thank you and Good Luck! MAKE SURE TO STAY STRICT WITH YOUR RISK MANAGEMENT!
PS: Please support with a like or comment if you find this analysis useful for your trading day.
USDCAD short at current market price USDCAD is at POI now.
the risk is reasonable in my opinion and i'm short from here.
or else, zoom-in in lower time frame for reversal confirmation.
for H1 timeframe confirmation, yu can wait for the nearest support to be broken.
Good Luck

Buy USD/CAD at low of sideways rangeUSD/CAD has been trading sideways so a straight forward trade, buy at low / profit at high until something changes.
Buy Limit : 1.3756 bottom of range
Stop : 1.3699 under bottom of range
Profit : 1.3870 top of range
Risk 1 : 2 stop is 57 pips

USDCAD Pullback SetupPrice is now moving into the FVG + VWAP upper resistance band.
This area looks heavy, and I’m expecting sellers to step in.
📉 My expectation → a pullback move down towards 1.37538.
Watching how price reacts from this zone will give more confirmation.

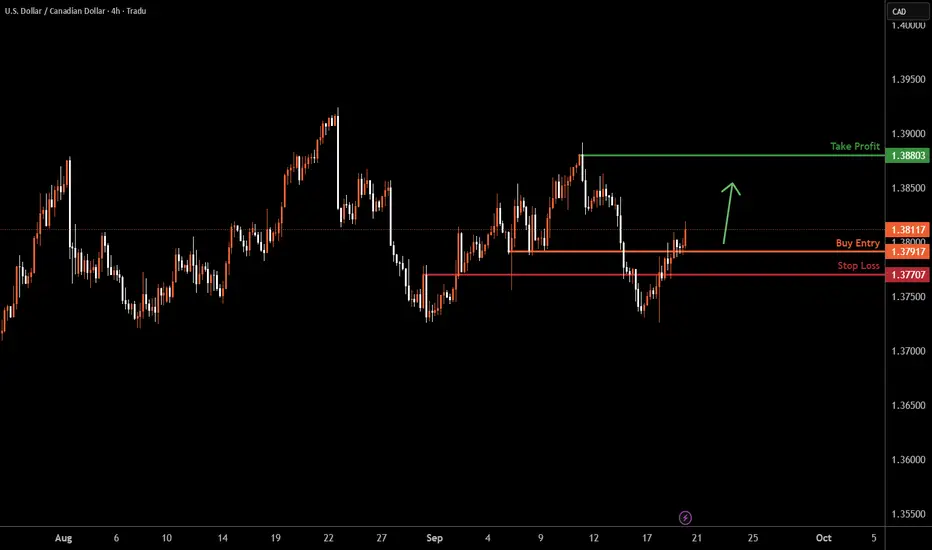
USDCAD H4 | Bullish reversalUSD/CAD has bounced off the buy entry which is an overlap support and could rise from this leve to the upside.
Buy entry is at 1.3791, which is a pullback support.
Stop loss is at 1.3770, whichis a pullback support.
Take profit is at 1.3880, which acts as a swing high resistance.
High Risk Investment Warning
Trading Forex/CFDs on margin carries a high level of risk and may not be suitable for all investors. Leverage can work against you.
Stratos Markets Limited (tradu.com ):
CFDs are complex instruments and come with a high risk of losing money rapidly due to leverage. 65% of retail investor accounts lose money when trading CFDs with this provider. You should consider whether you understand how CFDs work and whether you can afford to take the high risk of losing your money.
Stratos Europe Ltd (tradu.com ):
CFDs are complex instruments and come with a high risk of losing money rapidly due to leverage. 66% of retail investor accounts lose money when trading CFDs with this provider. You should consider whether you understand how CFDs work and whether you can afford to take the high risk of losing your money.
Stratos Global LLC (tradu.com ):
Losses can exceed deposits.
Please be advised that the information presented on TradingView is provided to Tradu (‘Company’, ‘we’) by a third-party provider (‘TFA Global Pte Ltd’). Please be reminded that you are solely responsible for the trading decisions on your account. There is a very high degree of risk involved in trading. Any information and/or content is intended entirely for research, educational and informational purposes only and does not constitute investment or consultation advice or investment strategy. The information is not tailored to the investment needs of any specific person and therefore does not involve a consideration of any of the investment objectives, financial situation or needs of any viewer that may receive it. Kindly also note that past performance is not a reliable indicator of future results. Actual results may differ materially from those anticipated in forward-looking or past performance statements. We assume no liability as to the accuracy or completeness of any of the information and/or content provided herein and the Company cannot be held responsible for any omission, mistake nor for any loss or damage including without limitation to any loss of profit which may arise from reliance on any information supplied by TFA Global Pte Ltd.
The speaker(s) is neither an employee, agent nor representative of Tradu and is therefore acting independently. The opinions given are their own, constitute general market commentary, and do not constitute the opinion or advice of Tradu or any form of personal or investment advice. Tradu neither endorses nor guarantees offerings of third-party speakers, nor is Tradu responsible for the content, veracity or opinions of third-party speakers, presenters or participants.
Bearish reversal off 61.8% Fibonacci resistance?USD/CAD is rising towards the resistance level, which is an overlap resistance that aligns with the 61.8% Fibonacci retracement and could reverse from this level to our take profit.
Entry: 1.3831
Why we like it:
There is an overlap resistance that aligns with the 61.8% Fibonacci retracement.
Stop loss: 1.3879
Why we like it:
There is a pullback resistance.
Take profit: 1.3729
Why we like it:
There is a pullback support level.
Enjoying your TradingView experience? Review us!
Please be advised that the information presented on TradingView is provided to Vantage (‘Vantage Global Limited’, ‘we’) by a third-party provider (‘Everest Fortune Group’). Please be reminded that you are solely responsible for the trading decisions on your account. There is a very high degree of risk involved in trading. Any information and/or content is intended entirely for research, educational and informational purposes only and does not constitute investment or consultation advice or investment strategy. The information is not tailored to the investment needs of any specific person and therefore does not involve a consideration of any of the investment objectives, financial situation or needs of any viewer that may receive it. Kindly also note that past performance is not a reliable indicator of future results. Actual results may differ materially from those anticipated in forward-looking or past performance statements. We assume no liability as to the accuracy or completeness of any of the information and/or content provided herein and the Company cannot be held responsible for any omission, mistake nor for any loss or damage including without limitation to any loss of profit which may arise from reliance on any information supplied by Everest Fortune Group.

USDCAD OVERVIEWUSDCAD has bounced after testing the long-term trendline support. Price is now retesting the 1.3817 – 1.3795 resistance zone.
🔼 Bullish case: Break and hold above 1.3817 could trigger continuation towards 1.3860+.
🔽 Bearish case: Rejection at this resistance may pull price back into supports at 1.3768 and 1.3739.
📌 The trendline remains a key pivot – holding above keeps bias bullish, a break below flips momentum bearish.
⚠️ For educational purposes only, not financial advice

USDCAD – Medium-Term H1 OutlookUSDCAD – Medium-Term H1 Outlook
USDCAD is maintaining a steady corrective uptrend, supported by sustained strength in the US Dollar. This broader USD momentum continues to benefit the pair in the medium term.
The recently filled gap has led to a minor pullback, but this reaction creates an attractive opportunity for long positions at current levels. From a structural perspective, the Point of Control (POC) on the Volume Profile aligns well with a liquidity-driven retracement zone, reinforcing this as a favourable entry for trend-following trades.
Trading Plan (H1)
Buy Entry: 1.3760 – 1.3770
Stop Loss: 1.3730
Take Profit: 1.3795 – 1.3820 – 1.3850 – 1.3875
I will continue to monitor the market and share updates as price action unfolds. Wishing you successful trades with this scenario.

USDCAD Analysis – Market Recovery and Bullish OutlookUSDCAD Analysis – Market Recovery and Bullish Outlook
USDCAD Market Report
USDCAD is emerging from a completed downside leg into a constructive recovery cycle. The prior bearish momentum created imbalance, but recent order flow shows that liquidity has been absorbed, allowing buyers to regain control. The transition reflects a clean structural shift, where corrective pressure is evolving into directional expansion.
The sequence of price action highlights disciplined progression: accumulation at lower levels, controlled impulsive candles, and measured volatility. This behavior signals that the market is not in exhaustion but in the early stages of a potential bullish leg. The rotation from decline into expansion suggests renewed confidence from larger market participants.
Looking ahead, the pair remains positioned for continuation. The rhythm of correction followed by orderly advancement underlines a resilient structure, with market dynamics favoring sustained upside development in the medium term.

USD/CAD: Range-Bound with Recovery Attempt from Key SupportUSD/CAD continues to trade within a defined sideways channel, following a strong rejection near the 1.3925 resistance zone. The recent formation of a lower high has pushed price into the 1.3764–1.3693 support area, where buyers are attempting to hold the line.
A bounce from this demand zone could lead to a short-term recovery toward 1.3850, but the overall structure remains corrective. A clear break above the descending trendline would be needed to shift the momentum back in favor of the bulls and confirm a broader reversal.
Head & Shoulders Confirmed – USDCAD Bearish Move🎯 Target (TP):
Measure from head to neckline = ~200 pips.
First Target: 1.3680
Extended Target: 1.3600 (near rising trendline support)
---
🛑 Stop Loss (SL):
Place above right shoulder = 1.3830
---
📍 Support Levels:
1.3720 (minor support, just broken)
1.3680 (measured target)
1.3600 (major support / trendline)
📍 Resistance Levels:
1.3830 (right shoulder / SL zone)
1.3900 (strong resistance)
---
📝 Dialogue for Clients (Share Post):
"📉 USDCAD (4H) has formed a clear Head & Shoulders pattern. Price broke the neckline, indicating bearish momentum.
✅ Target: 1.3680 → 1.3600
⛔ Stop Loss: 1.3830
📍 Support: 1.3720 / 1.3680 / 1.3600
📍 Resistance: 1.3830 / 1.3900
Bearish setup in play, manage risk wisely. 🔑"

Long Trade
30min TF overview
Pair: USDCAD
Direction: Buyside Trade
Date: Tuesday, 16th September 2025
Time: 9:35 AM
Session: New York Session AM
Entry Timeframe: 30m TF
Trade Parameters
Entry: 1.37407
Profit Level: 1.37764 (+0.26%) ≈ 35.7 pips
Stop Level: 1.37348 (–0.01%)
Risk-to-Reward (RR): 7.35
Narrative & Rationale
Buyside entry taken after liquidity sweep and confirmation of bullish order flow shift (CHOCH). Entry located within the discount zone, aligned with OB and FVG support areas.
Tight stop placement beneath accumulation lows reflects a precision entry model.
Targeting continuation into NY session highs and imbalance fill (FVG above).
RSI rebound confirms momentum shift, with volume surge suggesting institutional order flow participation.
Demand Zone and price level 1.37407 equal to (Mon 1st Sept 25) - 8.00 am OB Zone.
USDCAD Trade IdeaBias: Bullish (continuation of uptrend).
Current Context:
Price has not broken the previous low, keeping the bullish structure intact.
Currently retracing to fill the imbalance / unmitigated order block (OB).
Key Observations:
As long as price respects the order block area, the uptrend bias remains valid.
This zone should act as a potential demand area for continuation to the upside.
Trade Scenarios:
Long Opportunity:
Wait for reversal confirmations (CHoCH, bullish BOS, liquidity sweep, or strong rejection wicks) inside the OB/demand zone.
Entry from OB → targeting previous highs / next liquidity pool.
Invalidation:
If price breaks and closes below the identified low/OB, bullish bias is invalidated → wait for new structure to form.

USD/CAD - Forecast🚨 USD/CAD – Key Levels in Play 🚨
🕰 Weekly View:
Price is trapped inside a 1.36 – 1.40 swing range.
Break above 1.40 → clean run into 1.44 – 1.46 supply.
Fail here → liquidity below 1.34 – 1.35 becomes the target.
📉 Daily Structure:
We’re moving inside a parallel channel, sitting mid-range at 1.38 – 1.39. Liquidity is building under 1.37 — sellers might want to grab that first.
⏱ 8H Play:
Rejection spotted at 1.38 – 1.385 supply.
➡️ Short-term pullback toward 1.37 demand looks likely.
➡️ If buyers defend that, we could see another push into 1.39 – 1.40.
📌 Outlook:
Short-term pullback 🔽 → Mid-term bullish if 1.37 holds.
Break under 1.37? Bears take control toward 1.35.
Follow for more

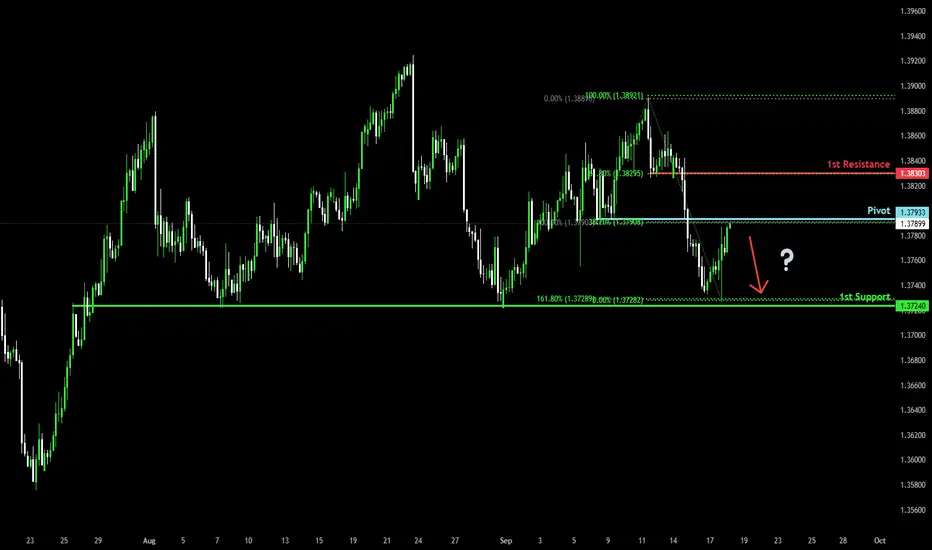
Could the Loonie reverse from here?The price is rising towards the pivot which acts as a pullback resistance that aligns with the 38.2% Fibonacci retracement and could reverse to the 1st support.
Pivot: 1.3793
1st Support: 1.3724
1st Resistance: 1.3830
Disclaimer:
The above opinions given constitute general market commentary, and do not constitute the opinion or advice of IC Markets or any form of personal or investment advice.
Any opinions, news, research, analyses, prices, other information, or links to third-party sites contained on this website are provided on an "as-is" basis, are intended only to be informative, is not an advice nor a recommendation, nor research, or a record of our trading prices, or an offer of, or solicitation for a transaction in any financial instrument and thus should not be treated as such. The information provided does not involve any specific investment objectives, financial situation and needs of any specific person who may receive it. Please be aware, that past performance is not a reliable indicator of future performance and/or results. Past Performance or Forward-looking scenarios based upon the reasonable beliefs of the third-party provider are not a guarantee of future performance. Actual results may differ materially from those anticipated in forward-looking or past performance statements. IC Markets makes no representation or warranty and assumes no liability as to the accuracy or completeness of the information provided, nor any loss arising from any investment based on a recommendation, forecast or any information supplied by any third-party.
USDCAD 1H longCurrently I'm in this trade 2 buy orders long,
2 limit buy orders still open
Price is still at a good place to step in imo.
Tomorrow high impact news for the CAD and USD so I expect some fireworks!
The plan is simple as always:
The price is already extended, clean drop down.
Support level visible on the 4H
No big pullbacks happend yet or consollidation zones
RSI oversold
- So I buy on the way down every 20 pips a limit buy order
- I exit when I make 2R profit
Let's goo
btw... EURUSD and USDCHF are aslo looking juicy
