USDCAD Set To Fall! SELL!
My dear friends,
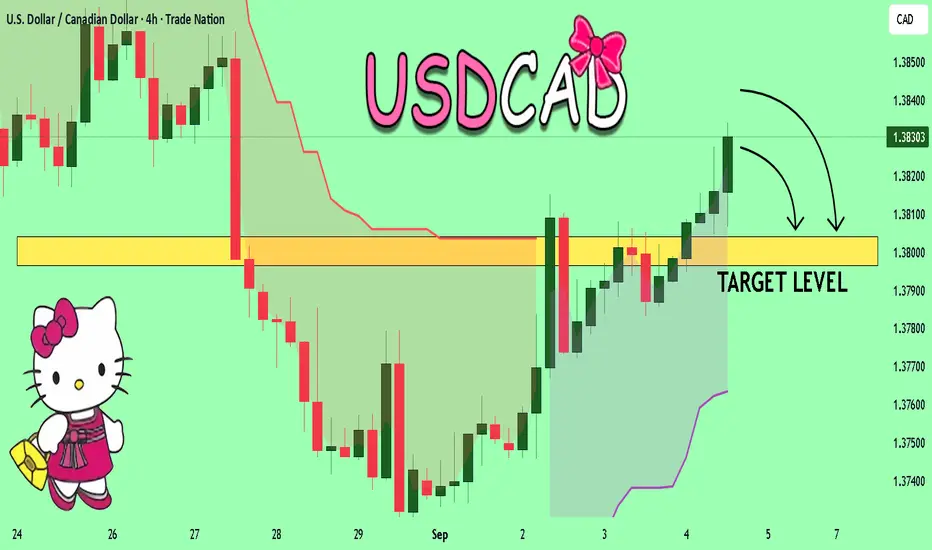
Please, find my technical outlook for USDCAD below:
The instrument tests an important psychological level 1.3832
Bias - Bearish
Technical Indicators: Supper Trend gives a precise Bearish signal, while Pivot Point HL predicts price changes and potential reversals in the market.
Target - 1.3804
About Used Indicators:
Super-trend indicator is more useful in trending markets where there are clear uptrends and downtrends in price.
Disclosure: I am part of Trade Nation's Influencer program and receive a monthly fee for using their TradingView charts in my analysis.
———————————
WISH YOU ALL LUCK
Trade ideas
USDCAD - BULLISH MOVE!Hello Traders!
The USDCAD price formed an inverted head and shoulders pattern.
Currently, the neckline is broken!
So, I expect a bullish move🚀
______________
TARGET: 1.38480🎯

USD/CAD SENDS CLEAR BEARISH SIGNALS|SHORT
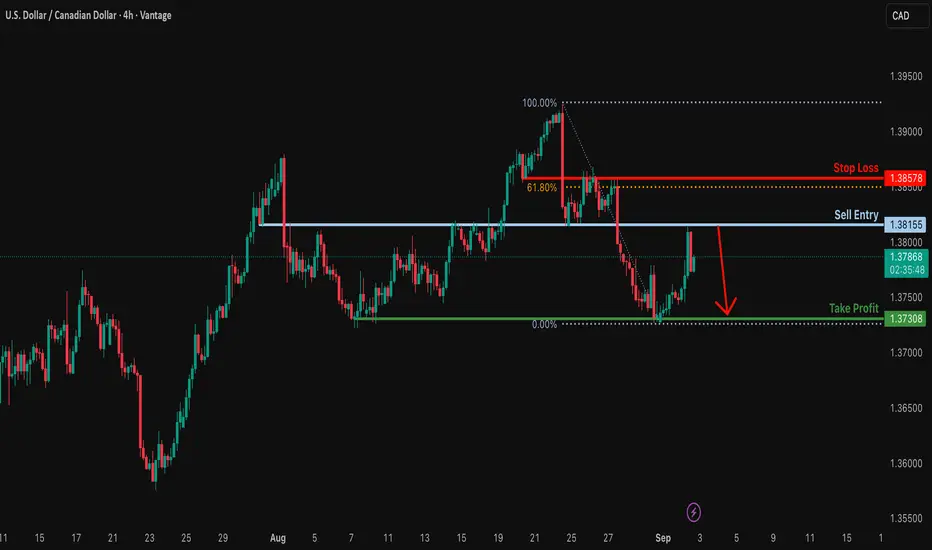
USD/CAD SIGNAL
Trade Direction: short
Entry Level: 1.382
Target Level: 1.369
Stop Loss: 1.391
RISK PROFILE
Risk level: medium
Suggested risk: 1%
Timeframe: 1D
Disclosure: I am part of Trade Nation's Influencer program and receive a monthly fee for using their TradingView charts in my analysis.
✅LIKE AND COMMENT MY IDEAS✅


USD/CAD steadies as traders weigh US jobs buildup and Canadian tMarket overview
USD/CAD is holding around 1.3810 on Thursday after a choppy week of data-driven swings. The dollar is consolidating following softer ISM manufacturing readings that highlighted weakness in US factory activity, while the services sector and labor market will take center stage heading into Friday’s nonfarm payrolls. Traders remain cautious ahead of ADP employment and ISM services today, which are expected to refine expectations for a September Fed rate cut.
The Canadian dollar is struggling to capitalize on firmer oil prices after OPEC’s signaling of potential output hikes weighed on the commodity earlier in the week. Domestic fundamentals remain mixed: Q2 productivity contracted at -1.0% q/q, underscoring competitiveness challenges, while today’s trade balance will be scrutinized for signs of improvement after July’s -5.86B deficit. Market positioning suggests CAD resilience depends on strong labor and trade readings later in the week, otherwise leaving USD/CAD range-bound near current levels.
Technical analysis
Current technical conditions and main scenario
The 4-hour chart shows USD/CAD bouncing off 1.3780 support and testing resistance at 1.3810. Price action has broken above a short-term descending trendline, signaling that momentum may be shifting. A sustained move above 1.3810–1.3820 would confirm a bullish breakout, targeting 1.3832 (200% Fibonacci extension) and potentially opening the door toward 1.3860 if follow-through builds.
Alternative scenario
If the pair fails to sustain above 1.3810 and dips back under 1.3798, a retracement toward 1.3780 support is possible. A decisive break beneath 1.3780 would undermine the bullish case and re-expose 1.3750 as the next downside target.

USDCAD Long (70% probability)Looking at the technical analysis in chart, USDCAD tested last demand zone.
I expect a push to the next supply level, and executed two long order on it.
First order is a swing trade, executed from the current price with a wide stop. The other, is a buy limit, with tight stop targeting next supply zone, as indicated on chart.

COMPLETION OF HEAD AND SHOULDERSLooking for opportunity to short USDCAD on completion of the right shoulder down to my demand zone that is support of my ascending structure.

Potentially bullish rise?The Loonie (USD/CAD) has bounced off the pivot and would rise to the 1st resistance that is slightly above the 61.8% Fibonacci retracement.
Pivot: 1.3779
1st Support: 1.3731
1st Resistance: 1.3858
Risk Warning:
Trading Forex and CFDs carries a high level of risk to your capital and you should only trade with money you can afford to lose. Trading Forex and CFDs may not be suitable for all investors, so please ensure that you fully understand the risks involved and seek independent advice if necessary.
Disclaimer:
The above opinions given constitute general market commentary, and do not constitute the opinion or advice of IC Markets or any form of personal or investment advice.
Any opinions, news, research, analyses, prices, other information, or links to third-party sites contained on this website are provided on an "as-is" basis, are intended only to be informative, is not an advice nor a recommendation, nor research, or a record of our trading prices, or an offer of, or solicitation for a transaction in any financial instrument and thus should not be treated as such. The information provided does not involve any specific investment objectives, financial situation and needs of any specific person who may receive it. Please be aware, that past performance is not a reliable indicator of future performance and/or results. Past Performance or Forward-looking scenarios based upon the reasonable beliefs of the third-party provider are not a guarantee of future performance. Actual results may differ materially from those anticipated in forward-looking or past performance statements. IC Markets makes no representation or warranty and assumes no liability as to the accuracy or completeness of the information provided, nor any loss arising from any investment based on a recommendation, forecast or any information supplied by any third-party.

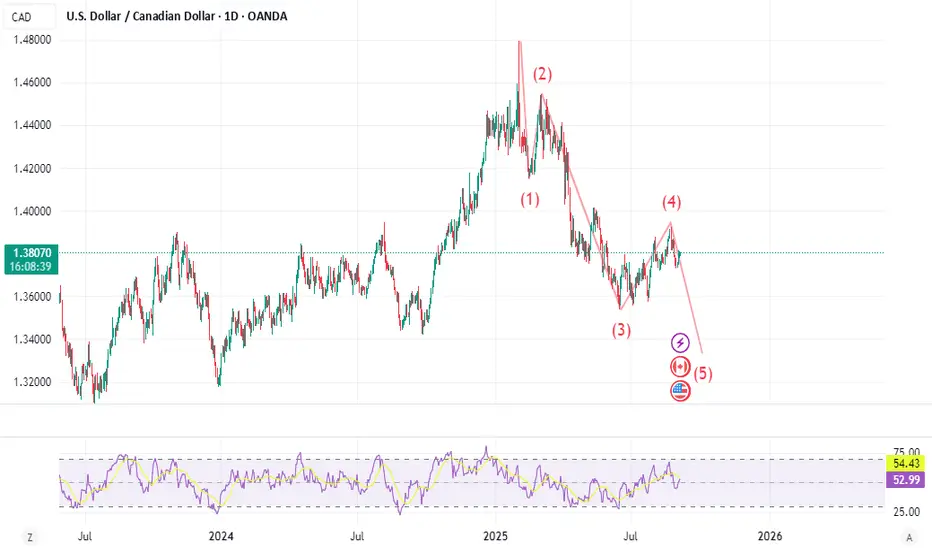
USDCAD DAILY FORECASTLooking at the moves from the chat D1, the wave 1 to 3 is completed, and giving us wave 4 already, so from here we are expecting a strong impulse move to complete wave 5.
USDCAD REVERSALPrinted bullish divergence
Break bearish trendline and then retest
reverse from demand zone
COT data also Short CAD which mean long USD


USDCAD Long TradeOANDA:USDCAD Long Trade
Entry: 1.37262 - 1.37430
TP-1: 1.37982
TP-2: 1.38140
This is good trade.
Don't overload your risk like Greedy gambler!!!
Be Disciplined Trader, what what you can afford.
Use proper risk management.
Disclaimer: Trading is risky, only idea, not advice.

Bulllish bounce off pullback support?USD/CAD is falling towards the support level, which is a pullback support that aligns with the 50% Fibonacci retracement and could bounce from this level to our take profit.
Entry: 1.3770
Why we like it:
There is a pullback support that aligns with the 50% Fibonacci retracement.
Stop loss: 1.3728
Why we like it:
There is a multi-swing low support.
Take profit: 1.3855
Why we like it:
There is a pullback resistance level that aligns with the 61.8% Fibonacci retracement.
Enjoying your TradingView experience? Review us!
Please be advised that the information presented on TradingView is provided to Vantage (‘Vantage Global Limited’, ‘we’) by a third-party provider (‘Everest Fortune Group’). Please be reminded that you are solely responsible for the trading decisions on your account. There is a very high degree of risk involved in trading. Any information and/or content is intended entirely for research, educational and informational purposes only and does not constitute investment or consultation advice or investment strategy. The information is not tailored to the investment needs of any specific person and therefore does not involve a consideration of any of the investment objectives, financial situation or needs of any viewer that may receive it. Kindly also note that past performance is not a reliable indicator of future results. Actual results may differ materially from those anticipated in forward-looking or past performance statements. We assume no liability as to the accuracy or completeness of any of the information and/or content provided herein and the Company cannot be held responsible for any omission, mistake nor for any loss or damage including without limitation to any loss of profit which may arise from reliance on any information supplied by Everest Fortune Group.

Usdcad Usdcad we hv market on a down trend on a 1 week and also on a 1 day so am expecting price to sell to de down side

USD/CAD – Pullback WatchReport from the War Room:
USD/CAD is pulling back into a marked support/resistance zone. The battlefield is clear, but the confirmation is not yet in place.
Structure: Price is pressing into the SR zone.
Momentum: Currently high, but needs alignment.
Volume: Still waiting for conviction.
Signal: Watching for a completed pullback with a strong engulfing candle to mark the entry.
⚔️ War Room Lesson:
A pullback is only complete when all three soldiers — Volume, Momentum, and Structure — stand together. Until then, we wait.
👉 Discipline wins more battles than impatience ever will.

USDCAD H4 | Bullish bounce offUSD/CAD has bounced off the buy entry which has been identified as a pullback support that lines up with the 50% Fibonacci retracement and could bounce from this level to the upside.
Buy entry is at 1.3770, which is a pullback support that lines up with the 50% Fibonacci retracement.
Stop loss is at 1.3729, which is a multi-swing low support.
Take profit is at 1.3855, which is an overlap resistance that laigns withthe 61.8% Fibonacci retracement.
High Risk Investment Warning
Trading Forex/CFDs on margin carries a high level of risk and may not be suitable for all investors. Leverage can work against you.
Stratos Markets Limited (tradu.com ):
CFDs are complex instruments and come with a high risk of losing money rapidly due to leverage. 65% of retail investor accounts lose money when trading CFDs with this provider. You should consider whether you understand how CFDs work and whether you can afford to take the high risk of losing your money.
Stratos Europe Ltd (tradu.com ):
CFDs are complex instruments and come with a high risk of losing money rapidly due to leverage. 66% of retail investor accounts lose money when trading CFDs with this provider. You should consider whether you understand how CFDs work and whether you can afford to take the high risk of losing your money.
Stratos Global LLC (tradu.com ):
Losses can exceed deposits.
Please be advised that the information presented on TradingView is provided to Tradu (‘Company’, ‘we’) by a third-party provider (‘TFA Global Pte Ltd’). Please be reminded that you are solely responsible for the trading decisions on your account. There is a very high degree of risk involved in trading. Any information and/or content is intended entirely for research, educational and informational purposes only and does not constitute investment or consultation advice or investment strategy. The information is not tailored to the investment needs of any specific person and therefore does not involve a consideration of any of the investment objectives, financial situation or needs of any viewer that may receive it. Kindly also note that past performance is not a reliable indicator of future results. Actual results may differ materially from those anticipated in forward-looking or past performance statements. We assume no liability as to the accuracy or completeness of any of the information and/or content provided herein and the Company cannot be held responsible for any omission, mistake nor for any loss or damage including without limitation to any loss of profit which may arise from reliance on any information supplied by TFA Global Pte Ltd.
The speaker(s) is neither an employee, agent nor representative of Tradu and is therefore acting independently. The opinions given are their own, constitute general market commentary, and do not constitute the opinion or advice of Tradu or any form of personal or investment advice. Tradu neither endorses nor guarantees offerings of third-party speakers, nor is Tradu responsible for the content, veracity or opinions of third-party speakers, presenters or participants.

USDCAD: Bearish. Buy The Dip?Welcome back to the Weekly Forex Forecast for the week of Sept 1 - 5th.
In this video, we will analyze the following FX market: USDCAD
Points of Interest:
- There are RELs (relative equal lows) at 1.3721 as a draw on liquidity
- Just underneath that, is a +FVG between 1.3716 and 1.3688.
I am looking for the reaction below those liquidity lows and the contact with the +FVG. If price presents a bullish CISD (market shift) only then will I entertain longs.
Shorts are best for now, as the HTFs are bearish.
Enjoy!
May profits be upon you.
Leave any questions or comments in the comment section.
I appreciate any feedback from my viewers!
Like and/or subscribe if you want more accurate analysis.
Thank you so much!
Disclaimer:
I do not provide personal investment advice and I am not a qualified licensed investment advisor.
All information found here, including any ideas, opinions, views, predictions, forecasts, commentaries, suggestions, expressed or implied herein, are for informational, entertainment or educational purposes only and should not be construed as personal investment advice. While the information provided is believed to be accurate, it may include errors or inaccuracies.
I will not and cannot be held liable for any actions you take as a result of anything you read here.
Conduct your own due diligence, or consult a licensed financial advisor or broker before making any and all investment decisions. Any investments, trades, speculations, or decisions made on the basis of any information found on this channel, expressed or implied herein, are committed at your own risk, financial or otherwise.

Sell USD/CAD before cluster resistance.CAD was one of the top performing majors last week and I expect it to continue. It's the start of a new month and the top wick of the new monthly candle, hopefully, will reach my sell limit entry. There is Non Farm Payrolls on Friday at the end of the week, so price action before the news event will influence this trades outcome.
Sell : 1.3814 cluster resistance
Stop : 1.3893 above major resistance
Profit : 1.3656 before 78.6 Fib and rising trendline
Risk 1 : 2


Bearish reversal off major resistance?The Loonie (USD/CAD) has rejected off the resistance level, which is an overlap resistance, and could potentially drop from this level to our take profit.
Entry: 1.3915
Why we like it:
There is an overlap resistance level.
Stop loss: 1.3857
Why we like it:
There is an overlap resistance that lines up with the 61.8% Fibonacci retracement.
Take profit: 1.3730
Why we like it:
There is a multi-swing low support.
Enjoying your TradingView experience? Review us!
Please be advised that the information presented on TradingView is provided to Vantage (‘Vantage Global Limited’, ‘we’) by a third-party provider (‘Everest Fortune Group’). Please be reminded that you are solely responsible for the trading decisions on your account. There is a very high degree of risk involved in trading. Any information and/or content is intended entirely for research, educational and informational purposes only and does not constitute investment or consultation advice or investment strategy. The information is not tailored to the investment needs of any specific person and therefore does not involve a consideration of any of the investment objectives, financial situation or needs of any viewer that may receive it. Kindly also note that past performance is not a reliable indicator of future results. Actual results may differ materially from those anticipated in forward-looking or past performance statements. We assume no liability as to the accuracy or completeness of any of the information and/or content provided herein and the Company cannot be held responsible for any omission, mistake nor for any loss or damage including without limitation to any loss of profit which may arise from reliance on any information supplied by Everest Fortune Group.
USDCAD | Technical 4H.Hello Traders!
As we see, we are still bearish... The pair is still fighting for higher price marks.
We have here this beautiful support trendline, where our take profit will be.
GL!
Nika.

USDCAD: Pullback From SupportThere is a strong likelihood that the 📈USDCAD will experience a pullback from the support level.
This expectation is reinforced by the formation of a double bottom pattern on the 4-hour time frame, along with a breakout above the neckline of that pattern.
If this bullish momentum continues, the target for the upward movement is set at 1.3833.

