USDCAD LONG OR SHORT?I'm curious to know if USDCAD keeps its bearish trend or if it has pivoted, whatever your ideas, they will be well received.
Trade ideas

USDCAD The Target Is UP! BUY!
My dear friends,
Please, find my technical outlook for USDCAD below:
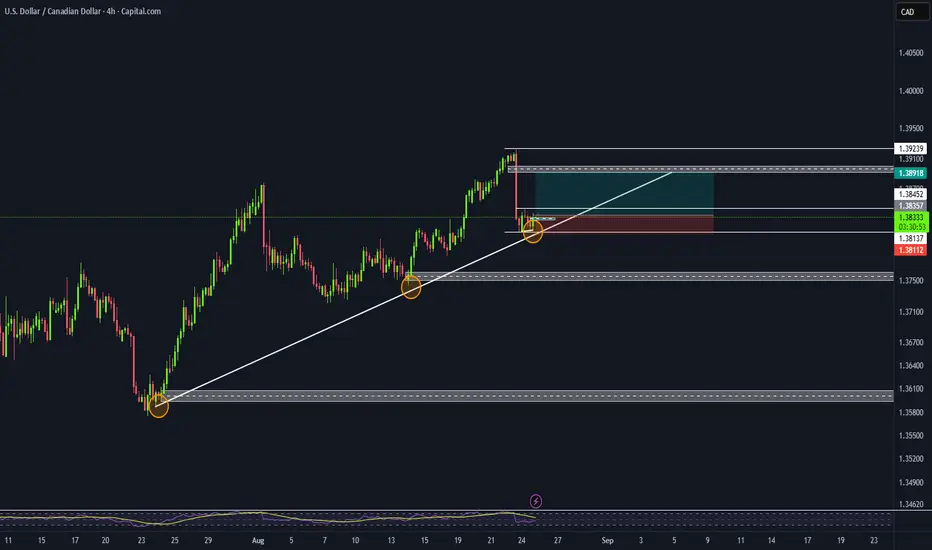
The instrument tests an important psychological level 1.3827
Bias - Bearish
Technical Indicators: Supper Trend gives a precise Bearish signal, while Pivot Point HL predicts price changes and potential reversals in the market.
Target - 1.3863
About Used Indicators:
Super-trend indicator is more useful in trending markets where there are clear uptrends and downtrends in price.
Disclosure: I am part of Trade Nation's Influencer program and receive a monthly fee for using their TradingView charts in my analysis.
———————————
WISH YOU ALL LUCK

26-08-2025 USDCAD There is currently a 30M bullish shark waiting for a retracement and short selling

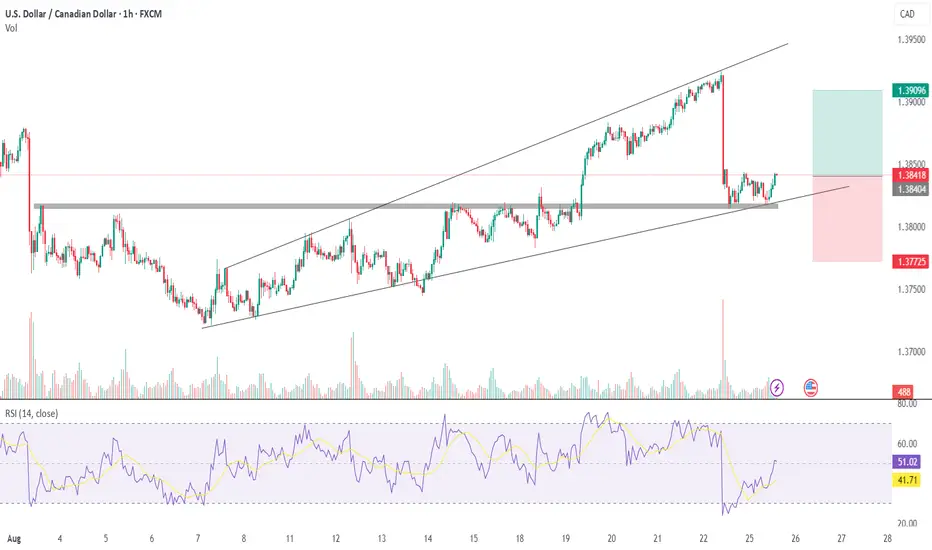
USD/CAD – Potential Cup Formation with Bullish DivergenceThe pair is forming a textbook cup pattern, signaling a potential long-term bullish continuation. RSI shows clear bullish divergence at the bottom, supporting the reversal bias.
Key Observations:
- Cup structure is building with strong impulse waves.
- Second entry area marked for potential pullback-based re-entry.
- RSI confirms momentum shift with multiple bullish divergence signals.
- Target set near previous resistance zone.
Bias: Bullish
Reason: Bullish divergence + cup formation + structure shift.
Looking for higher lows and continuation toward the target area. Ideal for swing/position traders.
#USDCAD #Forex #CupPattern #RSI #BullishDivergence #TechnicalAnalysis #SmartMoney

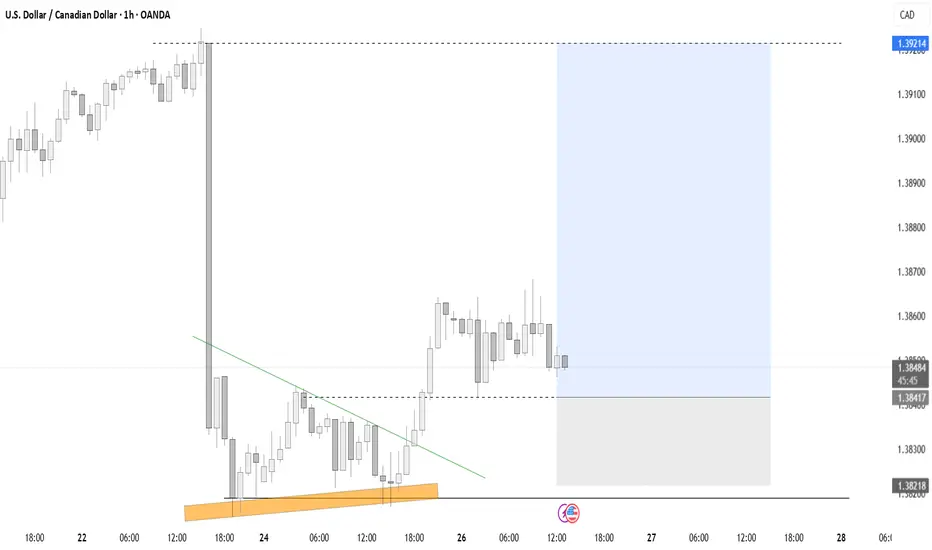
USDCAD will move higher.USDCAD buy idea: price is preparing to move higher showing bullish patterns. Price broke the bearish trend and is currently testing the point of break creating a new support on the 1hr chart
USD/CAD - 6C1! : Trade update FundamentalThe US dollar index (DXY) gained strength against major currencies on Monday following a landmark trade agreement between the United States and the European Union. During the meeting in Scotland on Sunday, President Donald Trump and European Commission President Ursula von der Leyen announced a new trade framework, which includes a 15% import tariff on EU goods—half of the 30% rate Trump had initially threatened to impose starting August 1.
The DXY opened higher at the start of the week, and it’s clear that most currencies are likely to see a decline in response. This trend also extends to pairs like the 6C1! (USDCAD), where the USD has been increasing its long positions. Last week, non-commercial traders added to their holdings, while commercial traders remain at their highest levels since 2021. Based on this setup, we are maintaining a bullish outlook and expect the continuation of our long position strategy.
Previous Idea :
✅ Please share your thoughts about USD/CAD in the comments section below and HIT LIKE if you appreciate my analysis. Don't forget to FOLLOW ME; you will help us a lot with this small contribution.

USDCADPrice appeared to have found support on the trendline, USD could find some strength over the next few weeks. I'm expecting this pair to trend to the upside, taking a 2:1 RR.
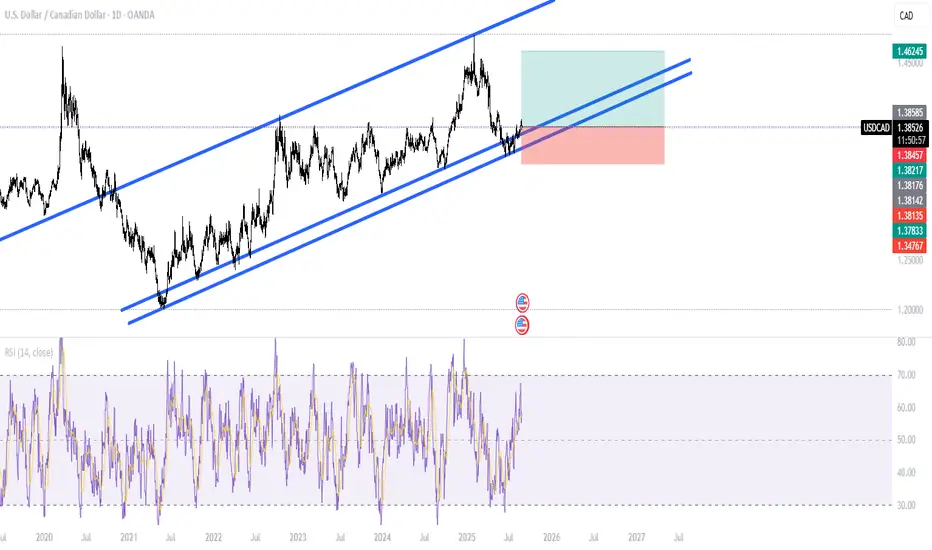
Is the USDCAD Rally Overextended Into Key Resistance Levels?The USDCAD is currently testing a formidable resistance zone following a period of strong bullish momentum. The primary catalyst for this upward repricing has been a clear divergence in monetary policy. The Federal Reserve is maintaining its hawkish bias, supported by persistent U.S. inflation data, which provides underlying strength to the dollar. 🦅 Conversely, moderating CPI in Canada has allowed the Bank of Canada to adopt a more dovish tone, creating a fundamental headwind for the loonie. 🍁
From a technical standpoint, the rally appears overextended, with momentum indicators suggesting the pair is now in overbought territory. 🛑 We're observing signs of price exhaustion as it challenges this key multi-month resistance level. Institutional sentiment is consequently shifting towards caution. The key strategic question now is whether we see a confirmed breakout on significant volume or a mean reversion scenario. At these levels, the risk-reward profile for new long positions is becoming unfavorable without further confirmation. I'm monitoring for either a decisive close above this zone or for signs of a corrective pullback. Stay sharp.

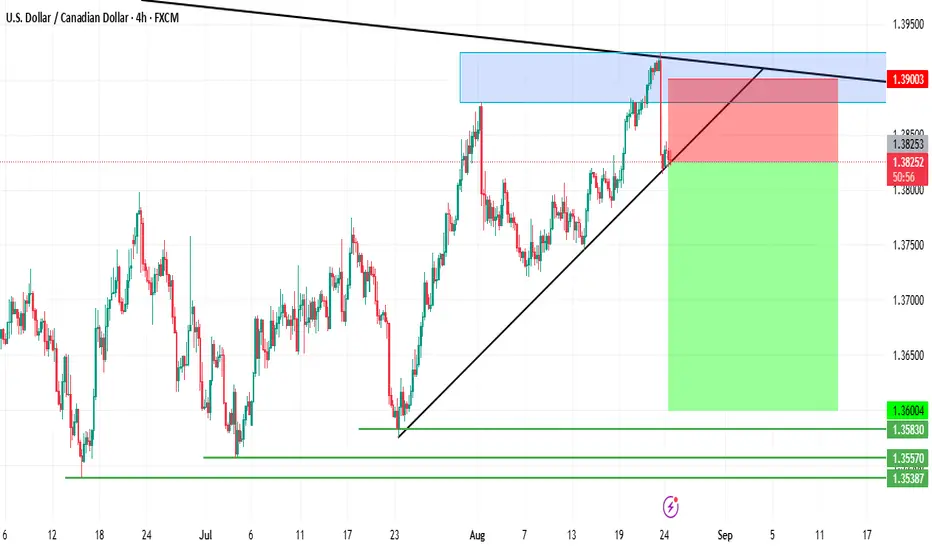
USDCAD: Bullish Move from Support Confirmed📈USDCAD has approached a significant confluence cluster, which is defined by a rising trend line and horizontal support on a 4-hour timeframe
The formation of a double top suggests a high probability of a subsequent retracement.
The target objective is 1.3889.

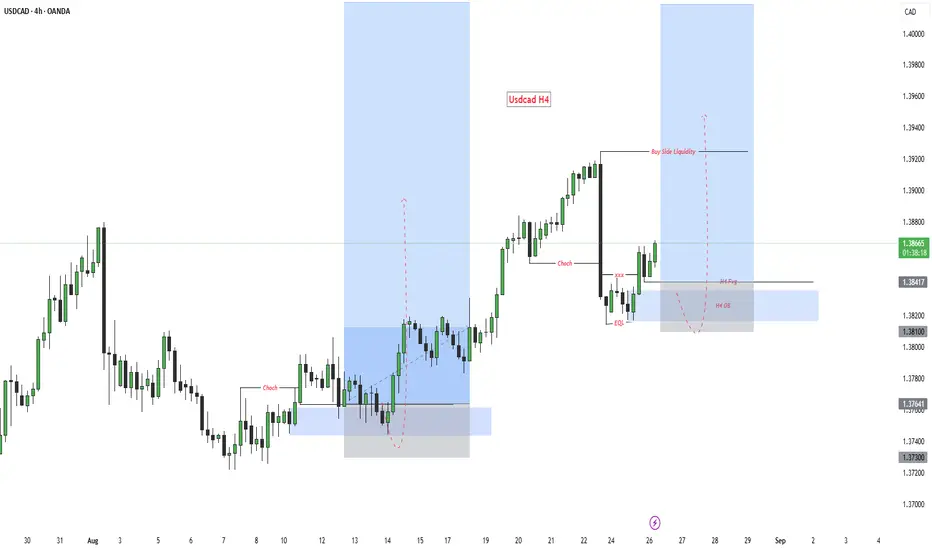
Usdcad H4 USDCAD H4 Analysis
On the H4 timeframe, we have:
• A clear Bullish FVG
• An Order Block supporting the buy side
• Market structure aligned with a bullish CRT
🟢 Plan: As soon as price retests the H4 FVG or the Order Block, we’ll look for confirmation on lower timeframes to enter a buy setup.
Discipline + patience = high-probability trades.
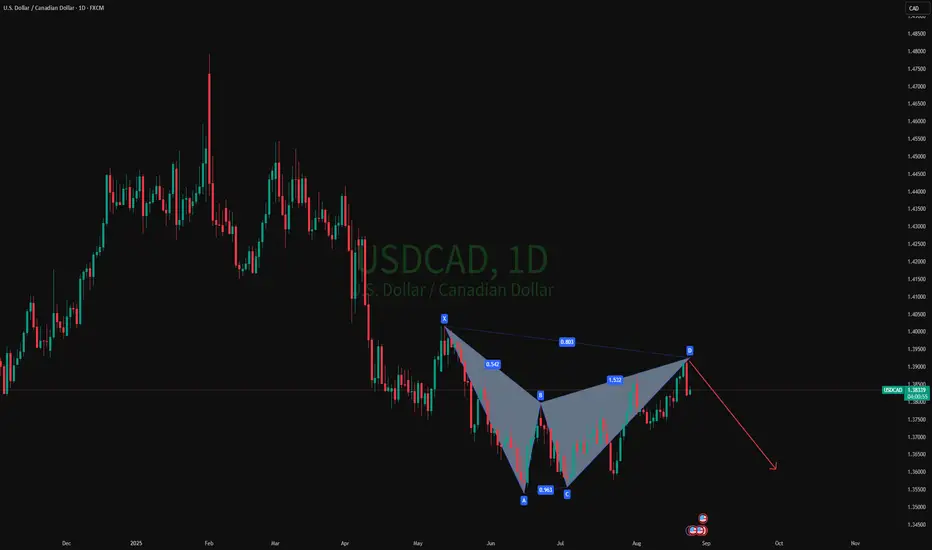
USDCAD SELL 1.3961On the daily chart, USDCAD stabilized and rebounded. Currently, we can pay attention to the resistance near 1.3961 above. This position is a short-selling position for a potential bearish bat pattern, and this position is also in the previous supply area.

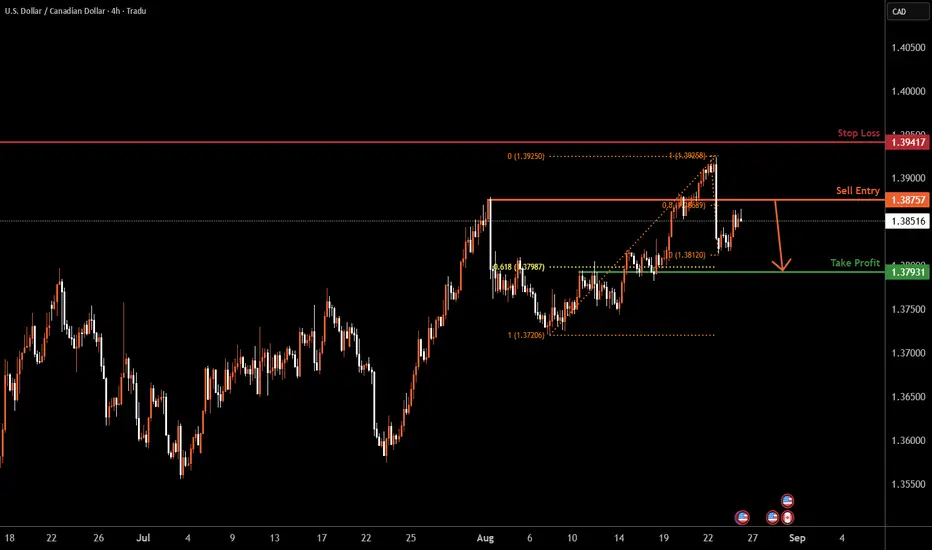
LOONIE H4 | Bearish reversalUSD/CAD is rising towards the sell entry which is a pullback resistance that aligns with the 50% Fibonacci retracement and could reverse from this level to the take profit.
Sell entry is at 1.3875, which is a pullback resistance that lines up with the 50% Fibonacci retracement.
Stop loss is at 1.3941, which is a pullback resistance.
Take profit is at 1.3793, which is an overlap support that aligns with the 61.8% Fibonacci retracement.
High Risk Investment Warning
Trading Forex/CFDs on margin carries a high level of risk and may not be suitable for all investors. Leverage can work against you.
Stratos Markets Limited (tradu.com ):
CFDs are complex instruments and come with a high risk of losing money rapidly due to leverage. 65% of retail investor accounts lose money when trading CFDs with this provider. You should consider whether you understand how CFDs work and whether you can afford to take the high risk of losing your money.
Stratos Europe Ltd (tradu.com ):
CFDs are complex instruments and come with a high risk of losing money rapidly due to leverage. 66% of retail investor accounts lose money when trading CFDs with this provider. You should consider whether you understand how CFDs work and whether you can afford to take the high risk of losing your money.
Stratos Global LLC (tradu.com ):
Losses can exceed deposits.
Please be advised that the information presented on TradingView is provided to Tradu (‘Company’, ‘we’) by a third-party provider (‘TFA Global Pte Ltd’). Please be reminded that you are solely responsible for the trading decisions on your account. There is a very high degree of risk involved in trading. Any information and/or content is intended entirely for research, educational and informational purposes only and does not constitute investment or consultation advice or investment strategy. The information is not tailored to the investment needs of any specific person and therefore does not involve a consideration of any of the investment objectives, financial situation or needs of any viewer that may receive it. Kindly also note that past performance is not a reliable indicator of future results. Actual results may differ materially from those anticipated in forward-looking or past performance statements. We assume no liability as to the accuracy or completeness of any of the information and/or content provided herein and the Company cannot be held responsible for any omission, mistake nor for any loss or damage including without limitation to any loss of profit which may arise from reliance on any information supplied by TFA Global Pte Ltd.
The speaker(s) is neither an employee, agent nor representative of Tradu and is therefore acting independently. The opinions given are their own, constitute general market commentary, and do not constitute the opinion or advice of Tradu or any form of personal or investment advice. Tradu neither endorses nor guarantees offerings of third-party speakers, nor is Tradu responsible for the content, veracity or opinions of third-party speakers, presenters or participants.
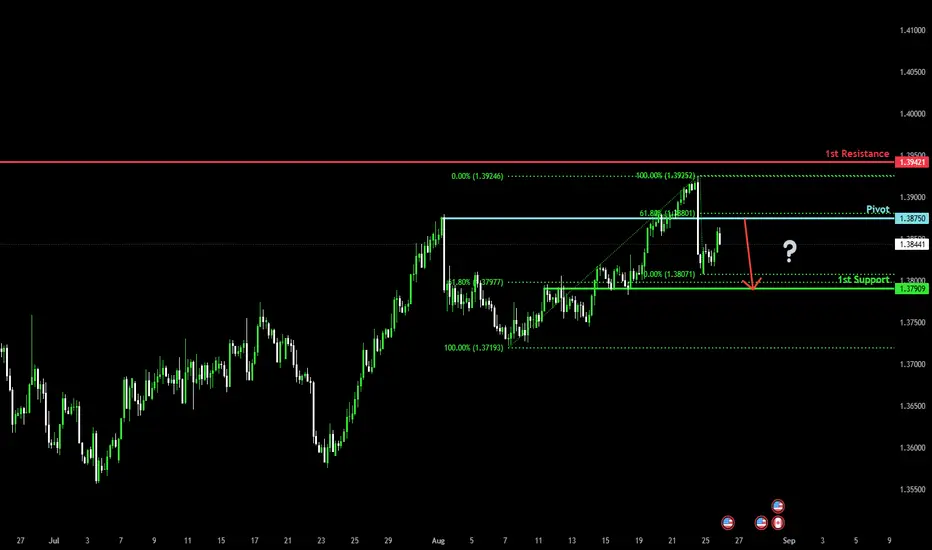
Potential bearish reversal?The Loonie (USD/CAD) is rising towards the pivot and could reverse to the 61.8% Fibonacci support.
Pivot: 1.3875
1st Support: 1.3790
1st Resistance: 1.3942
Risk Warning:
Trading Forex and CFDs carries a high level of risk to your capital and you should only trade with money you can afford to lose. Trading Forex and CFDs may not be suitable for all investors, so please ensure that you fully understand the risks involved and seek independent advice if necessary.
Disclaimer:
The above opinions given constitute general market commentary, and do not constitute the opinion or advice of IC Markets or any form of personal or investment advice.
Any opinions, news, research, analyses, prices, other information, or links to third-party sites contained on this website are provided on an "as-is" basis, are intended only to be informative, is not an advice nor a recommendation, nor research, or a record of our trading prices, or an offer of, or solicitation for a transaction in any financial instrument and thus should not be treated as such. The information provided does not involve any specific investment objectives, financial situation and needs of any specific person who may receive it. Please be aware, that past performance is not a reliable indicator of future performance and/or results. Past Performance or Forward-looking scenarios based upon the reasonable beliefs of the third-party provider are not a guarantee of future performance. Actual results may differ materially from those anticipated in forward-looking or past performance statements. IC Markets makes no representation or warranty and assumes no liability as to the accuracy or completeness of the information provided, nor any loss arising from any investment based on a recommendation, forecast or any information supplied by any third-party.
Bullish bounce off?USD/CAD has bounced off the support leve which is a pullback support that lines up with the 50% Fibonacci retracement and could potentially rise from this leve to our take profit.
Entry: 1.3815
Why we like it:
There is a pullback support that lines up with the 50% Fibonacci retracement.
Stop loss: 1.3752
Why we like it:
There is a pullback support that is slightly below the 78.6% Fibonacci retracement.
Take profit: 1.3917
Why we like it:
There is a swing high resistance.
Enjoying your TradingView experience? Review us!
Please be advised that the information presented on TradingView is provided to Vantage (‘Vantage Global Limited’, ‘we’) by a third-party provider (‘Everest Fortune Group’). Please be reminded that you are solely responsible for the trading decisions on your account. There is a very high degree of risk involved in trading. Any information and/or content is intended entirely for research, educational and informational purposes only and does not constitute investment or consultation advice or investment strategy. The information is not tailored to the investment needs of any specific person and therefore does not involve a consideration of any of the investment objectives, financial situation or needs of any viewer that may receive it. Kindly also note that past performance is not a reliable indicator of future results. Actual results may differ materially from those anticipated in forward-looking or past performance statements. We assume no liability as to the accuracy or completeness of any of the information and/or content provided herein and the Company cannot be held responsible for any omission, mistake nor for any loss or damage including without limitation to any loss of profit which may arise from reliance on any information supplied by Everest Fortune Group.

USDCADLong oppotunity
- creating HH and LLs
- overall upwards trend
- 3 touch point on bullish trendline
- tp and Point of intrest zone
- SL below demand zone
USDCAD - Bullish Trend - Hidden DivergenceFX:USDCAD has been in a bullish trend, passing through major rsistances on Daily timeframes.
Currently, price is in a bullish trend and formed a hidden diveregence. This development indicates imminent bullish continuation!

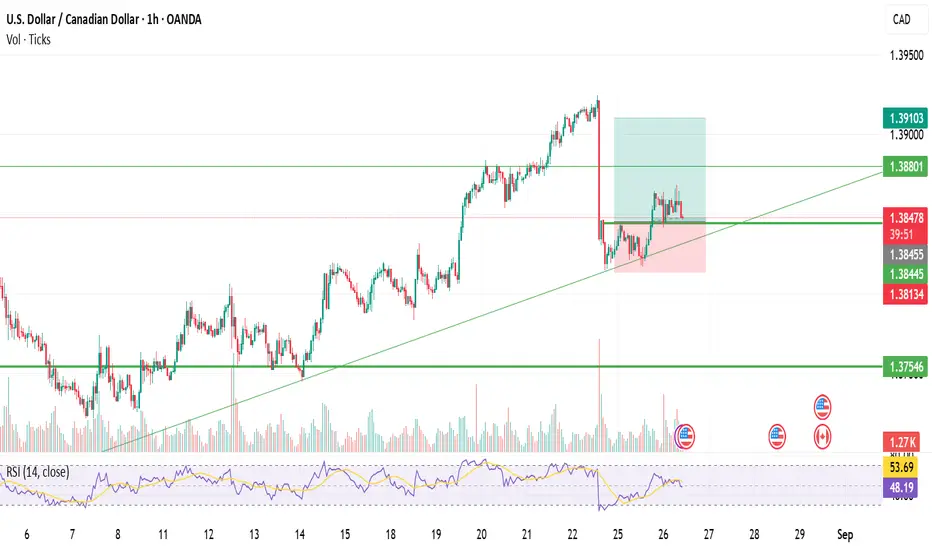
USD/CAD Trading Idea: Short from 1.3914 Volume ClusterUSD/CAD shows a strong resistance at 1.3914, formed after Powell’s speech triggered a sharp sell-off. Volume Profile highlights a heavy volume cluster at this level, marking the origin of aggressive selling. This is a classic Volume Accumulation Setup: wait for a pullback, then enter short. A bearish Fair Value Gap also starts at 1.3914, confirming strong seller presence.

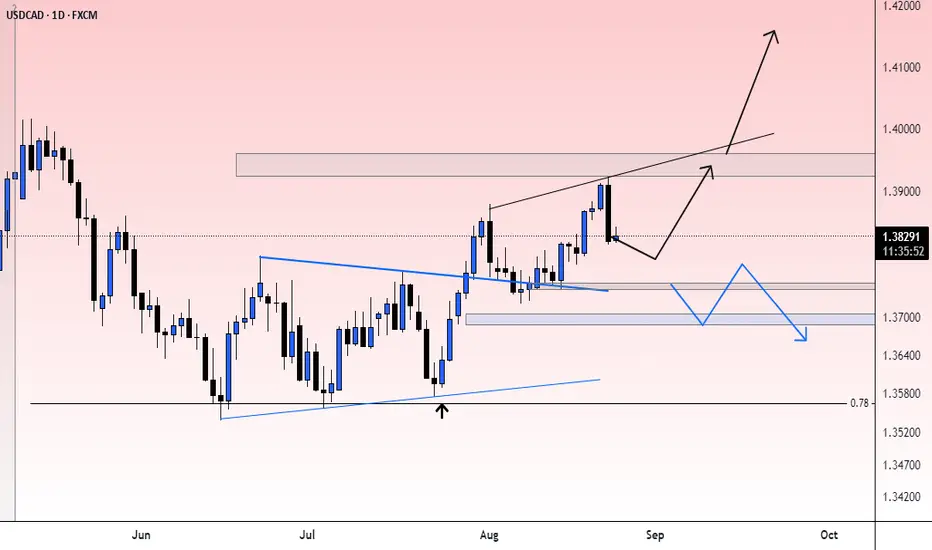
USDCAD Heading Towards Important Resistance D1✏️The old USDCAD analysis strategy was correct when the uptrend returned to the pair. 1.399 is the target of BUY signals when this zone accumulates a lot of selling momentum. The Breakout zone of 1.375 is considered a strong support zone forming a wide price range of the pair. The trading strategy is focused on the two resistance and support zones above.
📉 Key Levels
BUY trigger Strong support zone 1.375
SELL trigger Strong resistance zone 1.399
Leave your comments on the idea. I am happy to read your views.

check the trend It is expected that after the amount of correction and fluctuation, a trend change will be formed and the start of an upward trend to the resistance area will be formed.
If the price crosses the support area, a continuation of the downward