USDCAD-SHORTprice reaching 4hr resistance as well as 4hr parallel resistance and the trend is downward. going short for a 1:2.
U.S. Dollar / Canadian Dollar
No trades
Market insights

I Think USD may bounce, Buy USDCAD (week 12-15)Hi forex trader
Will the USD bounce
Most of my show is actualy if USD bounce
Thinking of buying USDCAD at 1.3725

USDCAD Expected UptrendThe price will reach resistance levels 1.39441 and 1.39535 before a reversal.

USDCAD: +400 Pips Selling Opportunity!Overview🧠
The USDCAD currency pair has reversed and a potential change in trend is occurring. Confirmation is required before a sell entry can be made. The only take profit is a swing move with a potential gain of approximately 400 pips. The stop loss can be placed above the higher high. Please like and comment for more.
Team Setupsfx

USDCAD Bullish ConfirmationsUSDCAD double bottom bullish confirmation alongside DXY's current bullishness for extra confluence.

USDCAD: 2-week horizon🛠 Technical Analysis: On the 4-hour timeframe, USDCAD has invalidated its ascending channel structure, triggering a "Global bearish signal" confirmed by the death cross of the SMA 50 below the SMA 100 and 200. The pair is currently under strong selling pressure but is approaching a major support zone near 1.3730, which aligns with previous accumulation levels. The projected trade setup anticipates a stabilization at this support floor, followed by a corrective rally targeting the breakdown point and the SMA cluster around 1.3980 - 1.4000.
———————————————
❗️ Trade Parameters (BUY)
———————————————
➡️ Entry Point: Buy Limit at the support zone (approx. 1.3730 – 1.3750)
🎯 Take Profit: 1.3980 – 1.4015 (Resistance)
🔴 Stop Loss: Below the support structure (approx. 1.3600)
⚠️ Disclaimer: This is a potential trade idea based on current analysis; market conditions and price direction are subject to change based on news factors and volatility.

USDCAD MARKET OUTLOOK!Here’s a market outlook on USDCAD from the daily timeframe and technically, we’re expecting a significant rise as price dropped closer to a support level. I expect a rebound to make a pullback of the impulse move that market made couple of days ago. Therefore, we’d monitor price from intraday perspective for a time price will shift from intraday bearish to bullish to make entries. A buy opportunity is envisaged.

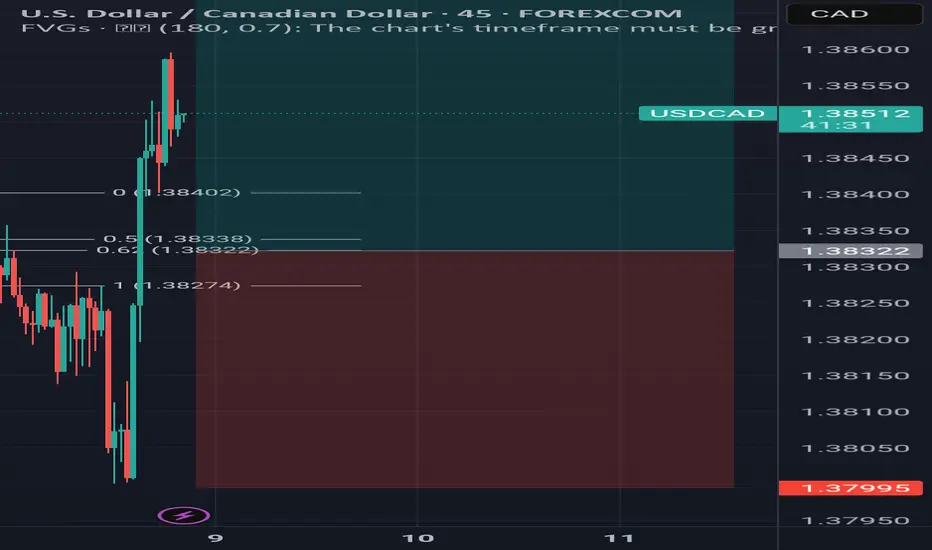
USD/CAD Looking bullish from key support levels📈 USDCAD Bullish Setup Alert! 🇺🇸🇨🇦
Price is showing strong bullish momentum after reacting from the key support zone at 1.38000.
🎯 Technical Targets (15M Timeframe):
1️⃣ 1.38200
2️⃣ 1.38400
3️⃣ 1.38600
⚠️ Risk Management First!
Always use proper stop-loss & position sizing. Protect your capital. 🛡️
💬 Like | Follow | Comment | Share
Your support keeps the analysis coming! 🙌

USDCAD bear trend in makingDIvergence on both MCAD and RSI is obvious and the price will follow bears

UASDCAD: Bearish! A Little Pullback, Then Down!The USD has been weakened over the past couple of weeks. Markets are at a 90% pchance the Fed cut rates by .25 bp, and that Trump will be installing Hasset, a loyalist, as Fed Chair. Couple that with the positive job numbers that Canada announced last week, and you see the downward trajectory of the USDCAD heading down.
It seems very likely that we will see more movement downtown this week.
I am expecting an OHLC candle for the week ahead.
The Draw on liquidity (DOL) would likely be the relative equal lows to the left.
May profits be upon you.
Disclaimer:
I do not provide personal investment advice and I am not a qualified licensed investment advisor.
All information found here, including any ideas, opinions, views, predictions, forecasts, commentaries, suggestions, expressed or implied herein, are for informational, entertainment or educational purposes only and should not be construed as personal investment advice. While the information provided is believed to be accurate, it may include errors or inaccuracies.
I will not and cannot be held liable for any actions you take as a result of anything you read here.
Conduct your own due diligence, or consult a licensed financial advisor or broker before making any and all investment decisions. Any investments, trades, speculations, or decisions made on the basis of any information found on this channel, expressed or implied herein, are committed at your own risk, financial or otherwise.

USD/CAD Pair structure and forecast.USD/CAD – Market Structure & Forecast
USD/CAD has completed a strong bearish leg, breaking structure (BOS) on the way down and forming a clear demand zone near support. Price has recently shown signs of accumulation, including internal CHoCH signals indicating a potential shift from bearish to bullish order flow.
Current structure shows:
Multiple CHoCH signals around the low, suggesting buyers are stepping in.
A corrective push upward followed by a pullback into a POI (Point of Interest).
The POI aligns with a small demand zone inside the larger support area.
A bullish BOS above this POI supports continuation to the upside.
Projection:
If price respects the POI and maintains bullish structure, USD/CAD may expand upward toward the major resistance zone above 1.39600.
Bias: Bullish (as long as support and POI hold)
Key Levels:
Support: Demand zone at the bottom of the chart
POI: Minor demand where the pullback is expected
Target: Higher resistance block above 1.3960
What you think about USD/CAD, write in the comment section.

USDCAD BUY 1.3774On the daily chart, USDCAD has fallen from its highs. Currently, pay attention to the area around 1.3774, which is a potential buy point for a bullish bat pattern. At the same time, this level is within the previous demand zone.

USDCAD corrective pullback, support retest?The USDCAD remains in a bullish trend, with recent price action showing signs of a corrective pullback within the broader uptrend.
Support Zone: 1.3797 – a key level from previous consolidation. Price is currently testing or approaching this level.
A bullish rebound from 1.3797 would confirm ongoing upside momentum, with potential targets at:
1.3923 – initial resistance
1.3950 – psychological and structural level
1.3980 – extended resistance on the longer-term chart
Bearish Scenario:
A confirmed break and daily close below 1.3797 would weaken the bullish outlook and suggest deeper downside risk toward:
1.3774 – minor support
1.3750 – stronger support and potential demand zone
Outlook:
Bullish bias remains intact while the USDCAD holds above 1.3797. A sustained break below this level could shift momentum to the downside in the short term.
This communication is for informational purposes only and should not be viewed as any form of recommendation as to a particular course of action or as investment advice. It is not intended as an offer or solicitation for the purchase or sale of any financial instrument or as an official confirmation of any transaction. Opinions, estimates and assumptions expressed herein are made as of the date of this communication and are subject to change without notice. This communication has been prepared based upon information, including market prices, data and other information, believed to be reliable; however, Trade Nation does not warrant its completeness or accuracy. All market prices and market data contained in or attached to this communication are indicative and subject to change without notice.

USD/CAD Short Level at 1.3858: Volume Cluster + FVG ConfluenceI’m watching USD/CAD for a pullback into a strong short level at 1.3858. This zone is defined by a heavy volume cluster formed during Friday’s downtrend, where sellers were likely building short positions. The level also aligns with the beginning of a fair value gap, adding extra strength. If the price pulls back into this area, I expect sellers to defend it and create a reaction.

USDCAD D11. Market Structure
USDCAD has broken down from the ascending channel (rising structure), showing loss of bullish momentum.
Current price around 1.3817 is sitting just below the previous channel support, now acting as resistance.
The bearish break suggests a shift from bullish → corrective → bearish.
⭐ 2. Key Levels
Resistance (Sell Zones)
🔴 1.3925 – 1.3965
Strong supply area.
Former support → now turning resistance.
Price retest into this zone is likely before continuing the move down.
Support (Targets)
🔵 1.3729
Major horizontal D1 support.
Liquidity zone + previous accumulation.
🔵 1.3600 – 1.3650 (extended target)
Trendline confluence.
Next swing support if bearish pressure continues.
⭐ 3. Price Action Outlook
Your chart projection matches the clean technical flow:
Baseline Bearish Scenario (Most Likely)
Price pulls back into 1.3925–1.3965 (retest supply).
Rejection signals → bearish continuation.
First target: 1.3730.
Break of 1.3730 could open deeper drop toward 1.3600 trendline.
Conditions Supporting This Bias
Bearish structure break.
Momentum candles down.
Retest zone not yet filled (price often retraces to fill before continuation).

Buy usdcad I was expecting a reversal today and it's been confirmed by a fair value gap on the 4hour timeframe. All the best and risk responsibly. Risk to reward is 1:3. Could be more
USDCAD BUY | Idea Trading AnalysisUSDCAD is falling towards a support level which is a pullback support and could bounce from this level to our take profit.
We expect a decline in the channel after testing the current level which suggests that the price will continue to rise
Hello Traders, here is the full analysis.
I think we can soon see more fall from this range! GOOD LUCK! Great BUY opportunity USDCAD
I still did my best and this is the most likely count for me at the moment.
-------------------
Traders, if you liked this idea or if you have your own opinion about it, write in the comments. I will be glad 🤝

USDCAD Bearish ExpectationsUSDCAD may see more sells to extend the already bearish structure. A bearish flag is seen on the 4hr chart, which implies a bearish sentiment.

USD/CAD: Will the Great Divergence Break the Greenback?The financial world stands on the precipice of a defining moment for North American currency markets. The USD/CAD pair hovers near 1.3855, ticking nervously as traders count down to a rare double-header of central bank decisions. December 10, 2025, marks a pivotal divergence point where economic pathways between the United States and Canada split sharply. This is not merely a technical adjustment; it is a fundamental collision of monetary policy, geopolitical strategy, and industrial resilience. The outcome will likely dictate the Loonie’s trajectory for the coming year.
Macroeconomics: A Tale of Two Trajectories
The macroeconomic landscape reveals a stark contrast between the two nations. The Federal Reserve prepares to slash interest rates for the third consecutive time, targeting a range of 3.50%-3.75%. Markets price this move at nearly 88% probability. The US labor market displays clear signs of cooling, necessitating easier financing conditions to prevent a recession. Conversely, the Bank of Canada (BoC) stands firm. Canada’s economy defied expectations with a robust 2.6% annualized GDP growth in Q3, crushing earlier forecasts. This resilience compels the BoC to hold rates at 2.25% to prevent reigniting inflation, which remains sticky at 2.2%.
Geostrategy: The Fertilizer Chess Game
Beyond interest rates, a high-stakes geopolitical trade war complicates currency valuation. The US administration’s threat of severe tariffs on Canadian fertilizer imports paradoxically jeopardizes US food security. American farmers rely heavily on Canadian potash, importing over half of Canada’s production. Tariffs here act as a double-edged sword: they aim to punish Canada but simultaneously drive up input costs for the US agricultural sector. This strategic misstep weakens the US Dollar’s purchasing power domestically while forcing the administration to print subsidies, further diluting the currency.
Industry Trends: Agriculture Under Siege
The agricultural industry sits at the epicenter of this financial storm. The promise of $12 billion in aid to US farmers highlights the structural damage already inflicted by trade barriers. This subsidy model creates a vicious cycle of dependency rather than innovation. While Canadian fertilizer producers face tariff headwinds, their product remains essential, granting them significant pricing power. US farmers face a "margin squeeze" that ripples through the broader economy, softening the US economic outlook and diminishing the appeal of the Greenback relative to the resource-backed Loonie.
Management & Leadership: Powell vs. Macklem
Leadership styles at the central banks further amplify market volatility. Fed Chair Jerome Powell operates under intense political pressure and conflicting data, forcing a reactionary "data-dependent" approach. His leadership currently signals caution and retreat. In contrast, BoC Governor Tiff Macklem displays a steady hand, anchoring policy to tangible growth metrics like the recent 180.6K job surge. This stability in Canadian monetary leadership attracts foreign capital seeking predictable returns, creating a natural demand for the Canadian Dollar over the politically volatile USD.
Business Models: Supply Chain Resilience
The trade dispute forces companies to rethink business models. Canadian exporters are diversifying markets beyond the US, strengthening long-term resilience. Meanwhile, US importers face a supply chain crisis, unable to quickly source alternative fertilizer at competitive rates. This rigidity in the US supply chain exposes a critical weakness in the American business model for agriculture. Investors recognize this structural flaw, leading to capital flows that favor the adaptability of the Canadian export sector, thereby supporting the CAD against the USD.
Conclusion: The Loonie’s Rebellion
The confluence of diverging interest rates and self-inflicted US trade wounds creates a perfect storm for USD/CAD bears. The Federal Reserve’s dovish pivot contrasts sharply with the Bank of Canada’s confident hold, widening the yield spread in favor of Canadian assets. Combined with the strategic failure of fertilizer tariffs, fundamental drivers point toward a weaker US Dollar. Traders must watch the 1.3850 level closely; a break below likely signals the start of a prolonged downtrend for the pair. The divergence is real, and the Loonie is ready to rebel.

USDCAD easy buy setupNice buy signal for USDCAD.
We see an impulsive up after a 3 wave correction. We also have a divergence on MACD.
Good trade for a 1:1 rr
Lets watch.

USDCAD: FED Cut Speculation Keeps Pair on a TightropeUSDCAD: FED Cut Speculation Keeps Pair on a Tightrope
In the current environment, where the market expects the FED to cut rates next week by 25 to 50 basis points, trading USDCAD comes with a very high level of risk.
The market today will also speculate on the US PCE data and its potential impact on the FOMC's rate cut decision.
US PCE is expected to be 2.8% vs. 2.7% YoY and Core PCE data is expected to be 2.9% vs. 2.9% YoY.
A higher reading could help the US dollar show some strength. However, I think with small deviations, a 25 basis point cut is already possible, and it was already priced in, so we should be cautious.
You may find more details in the chart!
Thank you and Good Luck!
❤️PS: Please support with a like or comment if you find this analysis useful for your trading day❤️
BUY USDCAD NOW!A potential buy opportunity is envisaged on USDCAD from the current market price as just had a perfect retracement to the neckline of the previously formed double button pattern. A buy opportunity is envisaged from the current market price. Our stop loss is at 1.37916

USD/CAD Trade Alert🚨 USD/CAD Trade Alert 🚨
━━━━━━━━━━━━━━━━━━━
Type: 🔵 Buy
Entry: 1.38553
Take Profit (TP): 🎯 1.39391
Stop Loss (SL): ❌ 1.38041
━━━━━━━━━━━━━━━━━━━
📈 Status: Active
💡 Market Insight:
Price holds above the stop, which keeps the buy setup intact. Buyers continue to show interest after defending the lower range. As long as price stays above 1.38041, the path toward 1.39391 remains open. A drop below the stop would signal that downside pressure has taken over.
