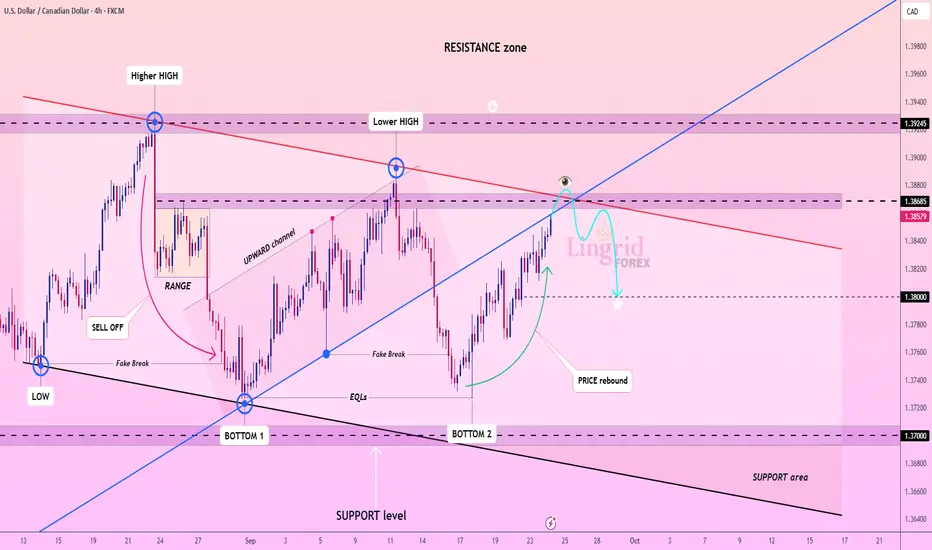
USD/CAD: Climbing Within Channel But Facing Overhead ResistanceUSD/CAD has rebounded sharply from a double bottom near 1.3700 and is now moving within an upward channel. The current structure features lower highs, limited by a descending red resistance trendline, while buyers aim to push toward the 1.3868–1.3924 resistance zone.
If the price fails to break and hold above 1.3868, a rejection could trigger a move back toward the 1.3800 support level. In the broader context, this advance appears to be a corrective upswing within a larger resistance area, where sellers remain active and could reassert control.
U.S. Dollar / Canadian Dollar
No trades
Trade ideas

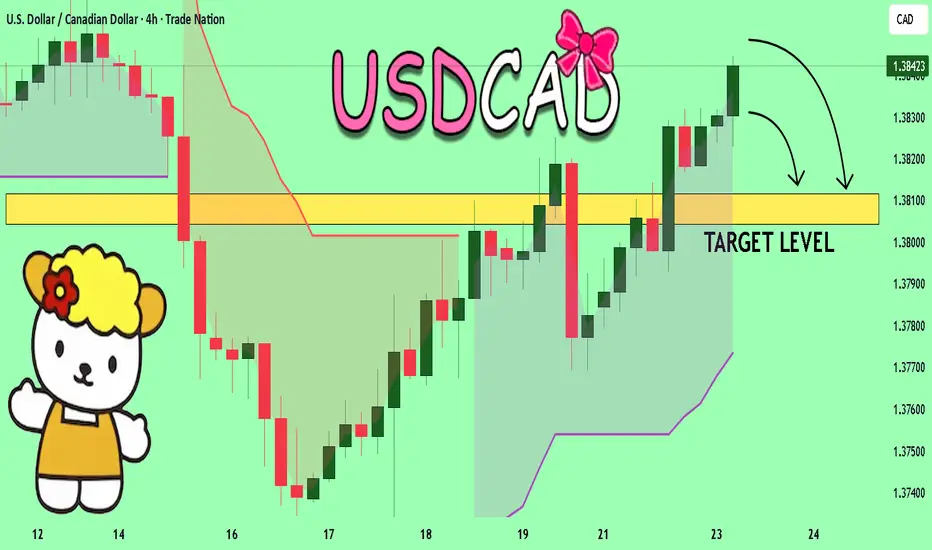
USD/CAD BEARISH BIAS RIGHT NOW| SHORT
USD/CAD SIGNAL
Trade Direction: short
Entry Level: 1.387
Target Level: 1.379
Stop Loss: 1.392
RISK PROFILE
Risk level: medium
Suggested risk: 1%
Timeframe: 12h
Disclosure: I am part of Trade Nation's Influencer program and receive a monthly fee for using their TradingView charts in my analysis.
✅LIKE AND COMMENT MY IDEAS✅

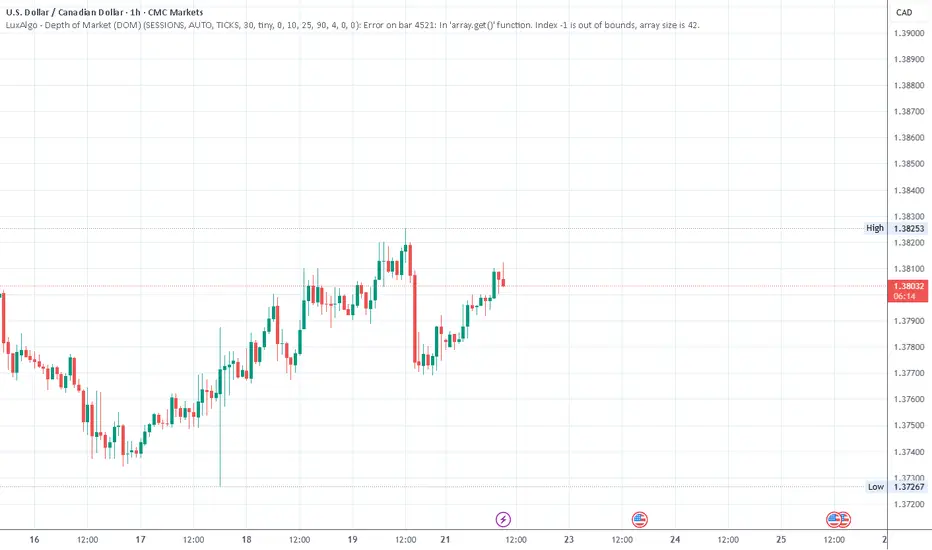
Will USD/CAD Finally Respect the PRZ?Price is pressing right into a Potential Reversal Zone (PRZ) that lines up perfectly with an AB=CD completion and a long-standing resistance shelf on the 1-hour chart.
The market has been grinding higher for days, but the structure is hinting that the next decisive move may be down—not up.
Here’s why I’m interested, but still waiting for confirmation before pulling the trigger.
🔍 Technical Setup
Pair / TF: USD/CAD – 1 Hour
Trend: Short-term bullish, but extended and showing fatigue
Pattern: AB=CD harmonic completion (no other harmonic pattern)
Key Zones:
PRZ / Resistance: 1.3865 – 1.3875
Support / Trigger area: 1.3830
Structure Clue: If price breaks the latest Higher Low (HL) and prints a fresh Lower Low (LL), it signals that buyers are losing grip and sellers may step in with force.
Divergence: RSI(14) shows bearish divergence (price making higher highs while RSI makes lower highs) — a classic early-warning sign that upside momentum is fading.
🌐 Sentiment & Fundamentals
Retail Sentiment (myfxbook): 32 % short / 68 % long → majority long means there’s fuel for a quick stop-driven drop if price reverses.
USD Index (DXY): bearish bias after recent Fed remarks about a slower pace of hikes and cooling inflation signals.
CAD Index: bullish tone, supported by firm crude oil demand and a Bank of Canada still talking hawkish.
Macro Backdrop:
US–Canada 2-year yield spread has narrowed slightly, favoring CAD strength.
Crude oil holding above key supports strengthens the Canadian dollar further.
These fundamental drivers add conviction to a bearish bias if technical confirmation appears.
🛠️ Trade Plan (only if conditions trigger)
Entry (Sell Stop): 1.38308 — waiting for HL break and a clean LL close to confirm sellers in control.
Stop Loss: 1.38584 (just above PRZ and recent highs).
Target (TP1): 1.38032
Position Size: 0.5 lot (on ~USD 10 K account).
Risk/Reward: 1 : 1 (~$100 risk for ~$100 reward).
Risk Management: If price never breaks HL and instead keeps climbing, no trade is taken — capital stays safe.
🎯 Bias
Although the short-term trend is still technically up, the confluence of PRZ resistance, AB=CD completion, bearish RSI divergence, bearish USD index, and bullish CAD index keeps my bias cautiously bearish — but only with breakdown confirmation.
💡 Takeaway
This is a wait-for-breakdown idea, not a blind short.
If price slices through 1.3830, the door opens for a quick momentum drop toward 1.3810 (and possibly 1.3785 if oil strength continues).
If it doesn’t, I stay flat and safe.
💬 Share Your View
What’s your take on USD/CAD here? Drop your thoughts in the comments and let’s discuss the levels.
✅ Follow me for more trade ideas and signals — stay ahead of key setups like this one.
⚠️ Disclaimer
This analysis is for educational purposes only and does not constitute financial advice.
Trading involves risk — always do your own research and manage risk carefully. Past performance ≠ future results.
#USDCAD #forex #forextrading #fxtrader #priceaction #technicalanalysis #fundamentalanalysis #ABCDpattern #harmonicpattern #RSIdivergence #bearishdivergence #PRZ #potentialreversalzone #supportandresistance #chartanalysis #tradingsetup #tradeplan #riskmanagement #forexsignals #forexstrategy #currencytrading #majorpairs #dxy #crudeoil #canadiandollar #usdollar #tradingview #marketanalysis #daytrader #swingtrader #priceactiontrader #smartmoneyconcepts #liquiditygrab #lowerlow #higherlow #bearishsetup #shortsetup #fxsignals #forexeducation #tradewithplan #waitforconfirmation

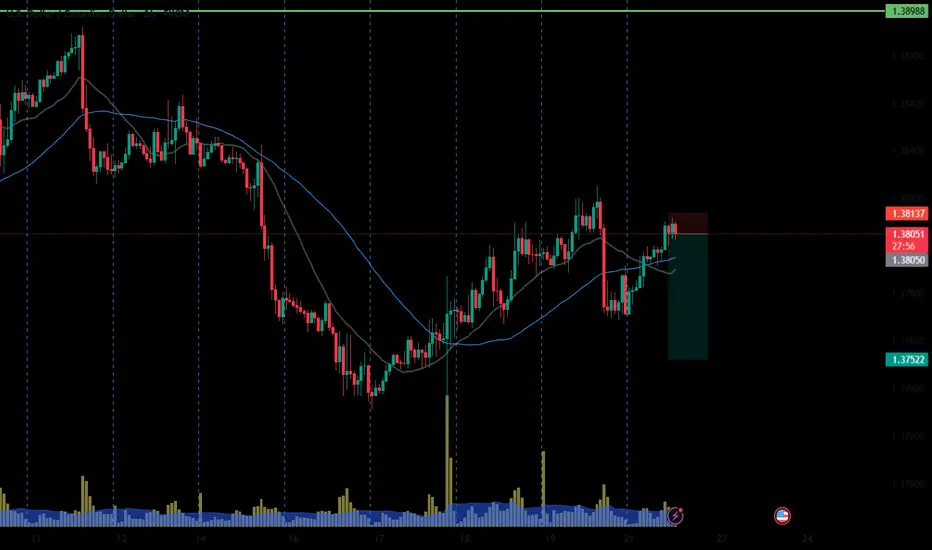
Lingrid | USDCAD Short at Resistance Following Rejection SignalThe price perfectly fulfilled my previous idea . FX:USDCAD rebounded strongly from the double bottom around 1.3700 and is now climbing within an upward channel. The structure shows lower highs capped by the red resistance trendline, while buyers attempt to sustain momentum toward 1.3868–1.3924 resistance. If price fails to break and hold above 1.3868, a rejection could send it back toward 1.3800 support. Broader context suggests a corrective upswing inside a larger resistance zone where sellers remain active.
⚠️ Risks:
A clean breakout above 1.3924 would invalidate the sell bias and extend the bullish leg.
Strong USD momentum from macroeconomic data could fuel further upside.
Failure of the 1.3800 support could trigger deeper volatility spikes.
If this idea resonates with you or you have your own opinion, traders, hit the comments. I’m excited to read your thoughts!
USDCAD H1 | Bullish continuationUSD/CAD has bounced off the buy entry which is a pullback support and could potentially rise from this level to the upside.
Buy entry is at 1.3829, which is a pullback support.
Stop loss is at 1.3808, which is a pullback support.
Take profit is at 1.3867, which is a pullback resistance that lines up with the 161.8% Fibonacci extension.
High Risk Investment Warning
Trading Forex/CFDs on margin carries a high level of risk and may not be suitable for all investors. Leverage can work against you.
Stratos Markets Limited (tradu.com ):
CFDs are complex instruments and come with a high risk of losing money rapidly due to leverage. 65% of retail investor accounts lose money when trading CFDs with this provider. You should consider whether you understand how CFDs work and whether you can afford to take the high risk of losing your money.
Stratos Europe Ltd (tradu.com ):
CFDs are complex instruments and come with a high risk of losing money rapidly due to leverage. 66% of retail investor accounts lose money when trading CFDs with this provider. You should consider whether you understand how CFDs work and whether you can afford to take the high risk of losing your money.
Stratos Global LLC (tradu.com ):
Losses can exceed deposits.
Please be advised that the information presented on TradingView is provided to Tradu (‘Company’, ‘we’) by a third-party provider (‘TFA Global Pte Ltd’). Please be reminded that you are solely responsible for the trading decisions on your account. There is a very high degree of risk involved in trading. Any information and/or content is intended entirely for research, educational and informational purposes only and does not constitute investment or consultation advice or investment strategy. The information is not tailored to the investment needs of any specific person and therefore does not involve a consideration of any of the investment objectives, financial situation or needs of any viewer that may receive it. Kindly also note that past performance is not a reliable indicator of future results. Actual results may differ materially from those anticipated in forward-looking or past performance statements. We assume no liability as to the accuracy or completeness of any of the information and/or content provided herein and the Company cannot be held responsible for any omission, mistake nor for any loss or damage including without limitation to any loss of profit which may arise from reliance on any information supplied by TFA Global Pte Ltd.
The speaker(s) is neither an employee, agent nor representative of Tradu and is therefore acting independently. The opinions given are their own, constitute general market commentary, and do not constitute the opinion or advice of Tradu or any form of personal or investment advice. Tradu neither endorses nor guarantees offerings of third-party speakers, nor is Tradu responsible for the content, veracity or opinions of third-party speakers, presenters or participants.

USDCAD short moveIf the price should break our support level, a retracement to that level cloud lead to more drop in price.

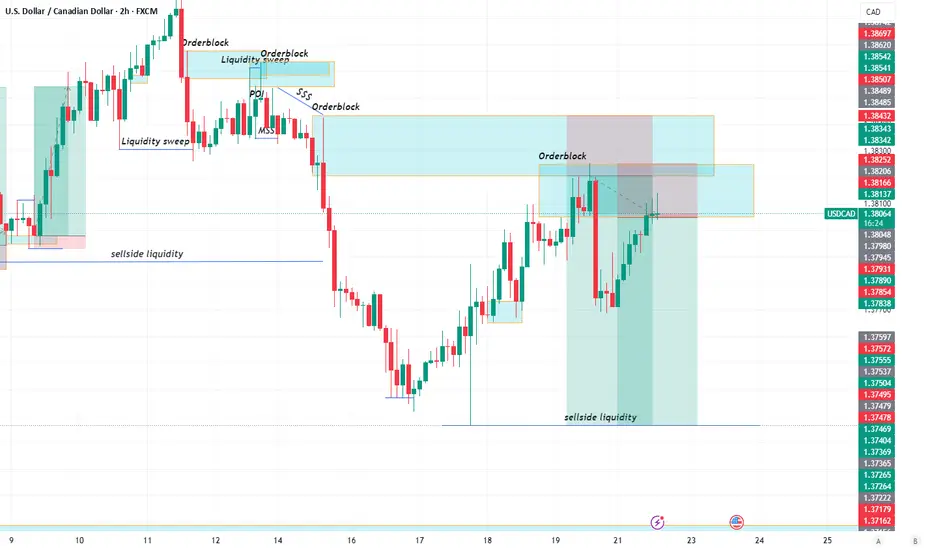
USDCAD SELL!! price rallied up slightly to tap into the 2hrly orderblock anticipating a sell to the previous low from here
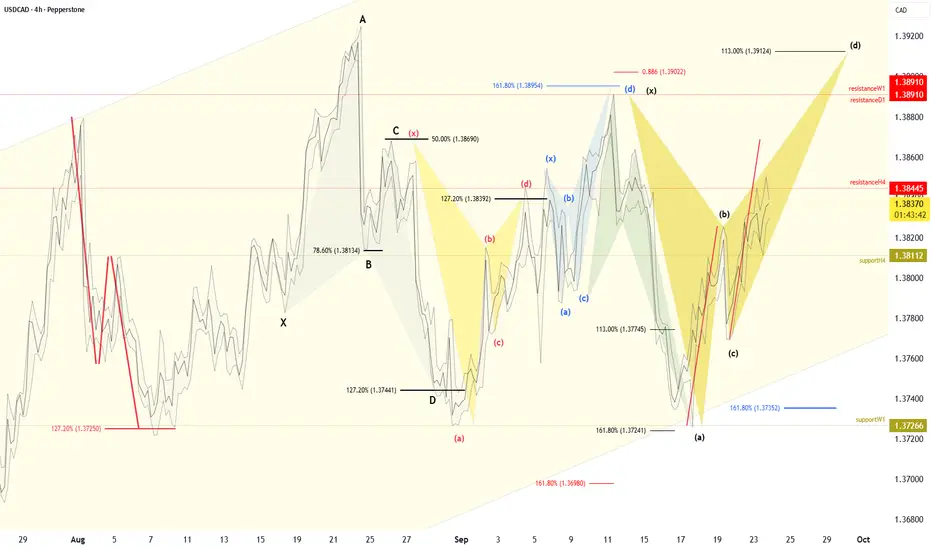
Breakout or Fakeout? Loonie at a Critical JuncturePEPPERSTONE:USDCAD is currently trading around 1.3836, after breaking above the key resistance level at 1.3825 earlier in the session. This breakout may have shifted momentum in favor of the bulls, but the pair now faces a new intraday fractal resistance at 1.3844 , which it is currently testing. A clean break above this barrier could open the door for further upside toward the weekly fractal resistance at 1.3891 .
The 1.3891 level remains pivotal, as it coincides with previous highs and represents a strong resistance zone. Should the market approach this area, price action will need to be monitored closely. A failure to break decisively higher could lead to the formation of a bearish Alt-Bat harmonic pattern, projected slightly above at 1.3912 .
In the near term, the battle between 1.3844 intraday resistance and 1.3811 intraday support will be crucial for short-term positioning. A sustained move above 1.3844 would strengthen the case for a test of 1.3891, while a failure to hold above 1.3811 could trigger another pullback toward the weekly fractal support.
Safe Trades,
André Cardoso
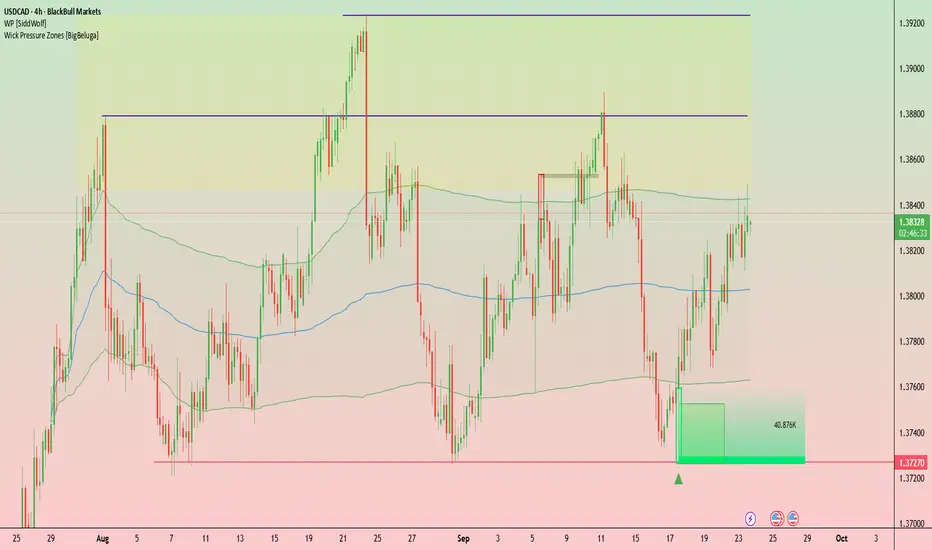
BoC signals two-way USDCAD opportunities Bank of Canada Governor Tiff Macklem has commended US Federal Reserve Chair Jerome Powell's for managing of a difficult environment well, and pointed out that political attacks on the Fed from President Trump are a concern for the BoC too.
For USDCAD, this means traders might start viewing Canada’s central bank as acting more independently, instead of just following the Fed. This could create more two-way trading opportunities.
On the 4-hour chart, USDCAD has shown clear range dynamics: immediate resistance sits near 1.3845–1.3880, a zone repeatedly rejecting advances through September, while the 1.3720 area has acted as strong demand. The higher lows since mid-September could suggest buyers are building strength though.
USDCAD SHORT Market structure bearish on HTFs 3
Entry on both Weekly and Daily AOi
Weekly Rejection at AOi
Previous Weekly Structure Point
Daily Rejection at AOi
Previous Daily Structure Point
Around Psych Level 1.38000
Touching EMA H4
H4 Candlestick rejection
Rejection from Previous structure
Levels
Entry 120
REMEMBER : Trading is a Game Of Probability
: Manage Your Risk
: Be Patient
: Every Moment Is Unique
: Rinse, Wash, Repeat!
: Christ is King.

USDCAD Will Fall! Short!
Take a look at our analysis for USDCAD.
Time Frame: 1D
Current Trend: Bearish
Sentiment: Overbought (based on 7-period RSI)
Forecast: Bearish
The price is testing a key resistance 1.382.
Taking into consideration the current market trend & overbought RSI, chances will be high to see a bearish movement to the downside at least to 1.373 level.
P.S
Please, note that an oversold/overbought condition can last for a long time, and therefore being oversold/overbought doesn't mean a price rally will come soon, or at all.
Like and subscribe and comment my ideas if you enjoy them!

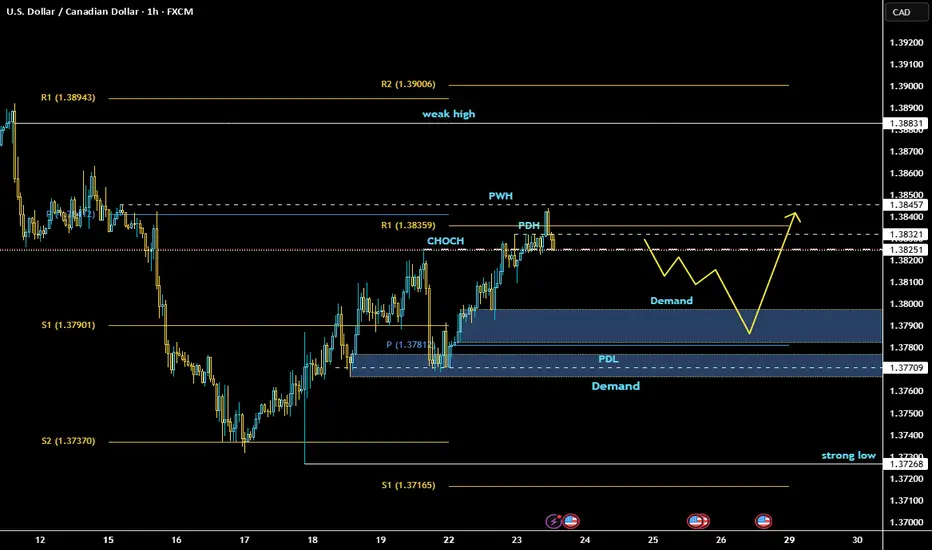
USD/CAD Forecast (1H)🔥 USD/CAD Forecast (1H Breakdown)
🕰 Weekly View
Market is sitting in a bigger swing range.
We had a strong sell-off, but bulls are clawing back — retracing into mid-range supply.
Momentum leaning corrective → buyers probing liquidity before any bigger move.
📅 Daily View
Clear demand base built around 1.3720s.
Price stair-stepped higher with higher lows, heading back toward the 1.3890–1.3920 daily supply pocket.
Structure is short-term bullish, but daily still hovering inside a corrective leg.
⏳ 4H View
Several internal BOS (i-BOS) prints on the way up → strong intraday bullish order flow.
We’re now reacting from internal range supply.
Below, SSL + imbalance + fib 71% confluence sits at 1.3780–1.3800 = 🔑 reload zone.
⏱ 1H View
BSL swept, sellers testing the entry zone.
Expecting a pullback into SSL/71% → if buyers hold, 🚀 continuation higher.
If price smashes swing low, bullish idea invalid and shorts take over.
🎯 Forecast Summary
📍 Bias : Bullish but expecting a dip before continuation
🎯 Upside Target: 1.3890–1.3920
🪙 Reload Zone: 1.3780–1.3800
❌ Invalidation: Clean break of swing low

USDCADFX:USDCAD
Technical Analysis: sentiment to the upward trend
The trend structure on the four-hour chart is bullish.
Given the change in structure, we should wait for confirmation of the bullish trend within the demand range of 1.3798, probably in the short term, if the aforementioned support is confirmed
we will witness an upward trend towards higher targets.
Sell USDCAD USDCAD Bearish Idea. It seems as though the entire USD index is negative today. A bearish flag can be seen on the 4hr chart on USDCAD this Tuesday.

USDCAD Fall Expected! SELL!
My dear subscribers,
This is my opinion on the USDCAD next move:
The instrument tests an important psychological level 1.3841
Bias - Bearish
Technical Indicators: Supper Trend gives a precise Bearish signal, while Pivot Point HL predicts price changes and potential reversals in the market.
Target - 1.3811
About Used Indicators:
On the subsequent day, trading above the pivot point is thought to indicate ongoing bullish sentiment, while trading below the pivot point indicates bearish sentiment.
Disclosure: I am part of Trade Nation's Influencer program and receive a monthly fee for using their TradingView charts in my analysis.
———————————
WISH YOU ALL LUCK
USDCAD(20250923)Today's AnalysisMarket News:
Federal Reserve Chairman Bostic: There is currently little reason to cut interest rates further, and only one rate cut is expected this year. Musallem: There is limited room for further rate cuts. If inflation risks increase, further rate cuts will not be supported. Hammak: We should be very cautious when lifting policy restrictions. My estimate of the neutral interest rate is on the higher side. Milan: I believe the appropriate interest rate is in the mid-2% range. I do not support adjusting the 2% inflation target at this time.
Technical Analysis:
Today's Buy/Sell Levels:
1.3806
Support and Resistance Levels:
1.3866
1.3844
1.3829
1.3783
1.3768
1.3746
Trading Strategy:
If the price breaks above 1.3829, consider buying, with the first target at 1.3844.
If the price breaks below 1.3806, consider selling, with the first target at 1.3783

USDCAD Long Trade OANDA:USDCAD Long Trade
Entry: 0.37700 - 0.37880
TP: 0.38096
This is good trade.
Don't overload your risk like Greedy gambler!!!
Be Disciplined Trader, risk what you can afford.
Use proper risk management.
Disclaimer: Trading is risky, only idea, not advice.

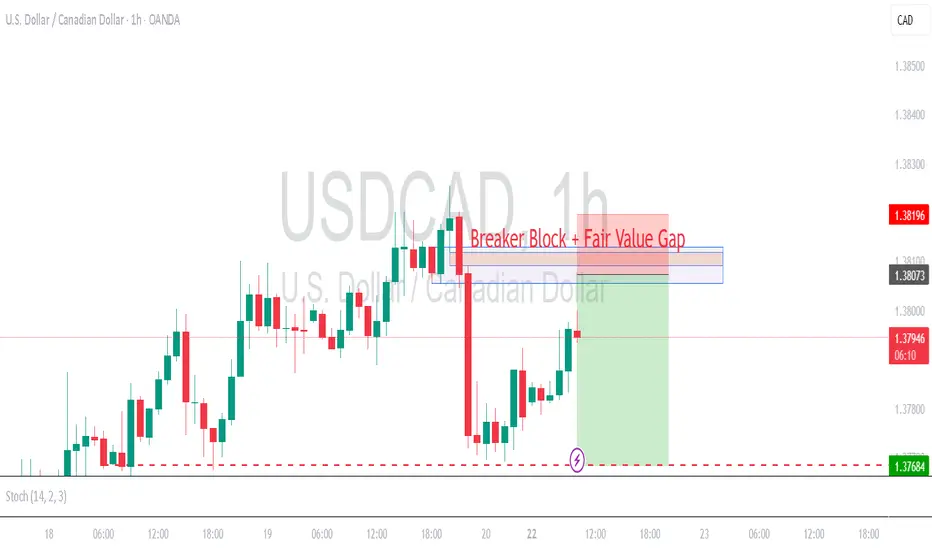
Monday 22 Sep Mapping for USDCAD : positioning for bearish moveWe observed strong bearish candle on Friday (bearish engulfing candle).
Today during Asian session we observed the price doing a healthy retracement.
I'm expecting the price to touch H1 Fair Value Gap area before dive for another bearish movement.
This is my mapping for USDCAD today for my future reference.
if you want to follow, make sure you calculate your own risk & reward.
Good Luck & happy trading.
USDCAD: Will Start Falling! Here is Why:
Looking at the chart of USDCAD right now we are seeing some interesting price action on the lower timeframes. Thus a local move down seems to be quite likely.
Disclosure: I am part of Trade Nation's Influencer program and receive a monthly fee for using their TradingView charts in my analysis.
❤️ Please, support our work with like & comment! ❤️


Short Trade on USDCADShort term trend is down
Selling pressure is strong
price approach strong supply zone.

#USDCAD short stops 1.3815 tp 1.3752looking from the left there was a trap set for the buyers on the 60 minutes chart where it clearly shows now after the pullback back to the area buyers may have released because a trap on the 5 minutes has also been identified with some volumes