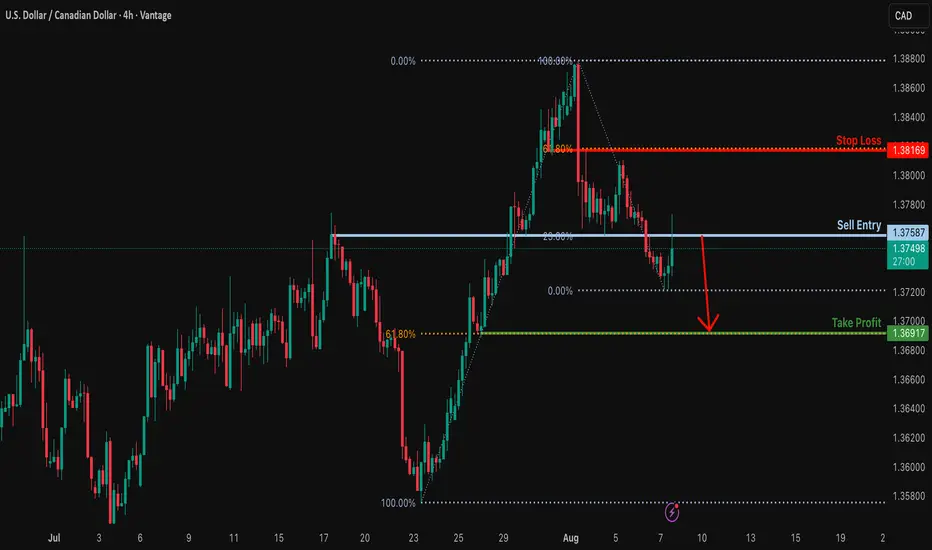
Potential bearish drop?The Loonie (USD/CAD) is reacting off the resistance levl which is an overlap resistance that lines up with the 23.6% Fibonacci retracement and could drop from this level to our take profit.
Entry: 1.3758
Why we like it:
There is an overlap resistance level that lines up with the 23.6% Fibonacci retracement.
Stop loss: 1.3816
Why we like it:
There is a pullback resistance level that aligns with the 61.8% Fibonacci retracement.
Take profit: 1.3691
Why we like it:
There is a pullback support level that aligns with the 61.8% Fibonacci retracement.
Enjoying your TradingView experience? Review us!
Please be advised that the information presented on TradingView is provided to Vantage (‘Vantage Global Limited’, ‘we’) by a third-party provider (‘Everest Fortune Group’). Please be reminded that you are solely responsible for the trading decisions on your account. There is a very high degree of risk involved in trading. Any information and/or content is intended entirely for research, educational and informational purposes only and does not constitute investment or consultation advice or investment strategy. The information is not tailored to the investment needs of any specific person and therefore does not involve a consideration of any of the investment objectives, financial situation or needs of any viewer that may receive it. Kindly also note that past performance is not a reliable indicator of future results. Actual results may differ materially from those anticipated in forward-looking or past performance statements. We assume no liability as to the accuracy or completeness of any of the information and/or content provided herein and the Company cannot be held responsible for any omission, mistake nor for any loss or damage including without limitation to any loss of profit which may arise from reliance on any information supplied by Everest Fortune Group.
Trade ideas
USDCAD BULLISH Technically:
Printing HH and HL
Bullish divergence
Resistance became support
Fib Retacment 0.5
Respecting Trendline support


USD/CAD – Watchlist UpdateWe were watching USD/CAD for a possible pullback and long setup earlier this week. While we did get an engulfing candle, momentum was not strong enough to justify a trade — especially considering the subpar support/resistance zone.
Now, the market appears to be shifting direction, possibly forming a pullback into a stronger resistance zone that could set up a downtrend continuation.
We’ll continue to wait and watch with patience, only considering this a valid opportunity if all components of the VMS strategy align.
📌 Let the setup come to you. No alignment, no trade.

USDCAD - Big Picture and MomentumBig Picture and Momentum
USD/CAD is trading comfortably above the 50-day EMA (~1.3728) and above the 9-day EMA, indicating continued bullish momentum. The 14-day RSI is above the 50 level, confirming the positive market sentiment.
Key Support and Resistance
Resistance: 1.3770–1.3798 range is the current target, a break of which could open the way to the January high around 1.4016.
Support:
50-day EMA (~1.3728) is the first line of defense.
Next is the 9-day EMA (~1.3679).
A further weakening could see a decline to 1.3560, and a strong correction could see a decline to the February 2024 lows (~1.3420).
Market Behavior Scenarios
Bullish scenario: holding above EMA with RSI > 50 creates good conditions for a move up to 1.3770-1.3800, and then to 1.4016, with increasing momentum.
Bearish scenario: falling below EMA, especially below 1.3679, can lead to a deeper decline - to 1.3560 and then to 1.3420.
Recommendations for traders
Long position: can be considered for entry when holding above 1.3728, with a target of 1.3770-1.3800, and a stop just below the EMA.
Short position: justified when falling below 1.3728-1.3679, with a target of 1.3560, and a stop just above the EMA level.
USDCAD going for a lower lowIf we patiently look at USDCAD we will notice that theres still some bearish momentum its goin to take some time before it will go up but make sure you aet your Sls right

USDCAD Sell Setup – Watching for Rejection at 1.37679Looking to enter short if price retests the 1.37679 level. Waiting for confirmation of resistance holding before executing the trade. Targeting downside continuation if the level holds.

USDCAD BUY 1.3610On the 4-hour chart, USDCAD is experiencing a short-term oscillation and decline, with a bearish trend prevailing. Currently, attention can be paid to the area around 1.3610, which is a potential buy point for a bullish bat pattern and is within the previous demand zone.

USDCAD: Bearish Structure with Rejection from Key Supply ArraysGreetings Traders,
In today’s analysis of USDCAD, recent price action confirms the presence of bearish institutional order flow. As a result, we aim to align ourselves with this directional bias by identifying strategic selling opportunities.
Key Observations:
Weekly Timeframe Insight:
Last week's candle rebalanced a weekly Fair Value Gap (FVG), indicating internal range price action. As a rule of thumb, once internal imbalances are addressed, the draw typically shifts toward external liquidity—located at the swing low, where the weekly liquidity pool resides.
H4 Resistance Alignment:
On the H4 timeframe, price shifted bearish and has since retraced into a bearish FVG that aligns precisely with a reclaimed bearish order block. The alignment of these bearish arrays strengthens the case for continued downside, making this zone a high-probability resistance area.
Trading Plan:
Entry Strategy:
Look for bearish confirmation setups on the M15 or lower timeframes within the H4 supply arrays (FVG + OB confluence).
Target Objective:
The primary draw on liquidity lies within the discount range—targeting the liquidity pool below the most recent swing low.
For a detailed market walkthrough and in-depth execution zones, be sure to watch this week’s Forex Market Breakdown:
Stay patient, wait for your confirmations, and trade in alignment with the flow of smart money.
Kind regards,
The Architect 🏛️📉

USDCAD - Re entryWe were bullish yesterday, we took a trade but we were stopped at a 14 Pips. We are taking a buy trade today too, a non confirmation low risk trade.

USDCAD H4 | Potential bearish dropUSD/CAD is is rising towards the sell entry at 1.3758, which is an overlap resistance and could drop from this level to the downside.
Stop loss is at 1.3758, which is an overlap resistance.
Take profit is at 1.3692, which is a pullback support that aligns witht he 61.8% Fibonacci retracement.
High Risk Investment Warning
Trading Forex/CFDs on margin carries a high level of risk and may not be suitable for all investors. Leverage can work against you.
Stratos Markets Limited (tradu.com ):
CFDs are complex instruments and come with a high risk of losing money rapidly due to leverage. 65% of retail investor accounts lose money when trading CFDs with this provider. You should consider whether you understand how CFDs work and whether you can afford to take the high risk of losing your money.
Stratos Europe Ltd (tradu.com ):
CFDs are complex instruments and come with a high risk of losing money rapidly due to leverage. 66% of retail investor accounts lose money when trading CFDs with this provider. You should consider whether you understand how CFDs work and whether you can afford to take the high risk of losing your money.
Stratos Global LLC (tradu.com ):
Losses can exceed deposits.
Please be advised that the information presented on TradingView is provided to Tradu (‘Company’, ‘we’) by a third-party provider (‘TFA Global Pte Ltd’). Please be reminded that you are solely responsible for the trading decisions on your account. There is a very high degree of risk involved in trading. Any information and/or content is intended entirely for research, educational and informational purposes only and does not constitute investment or consultation advice or investment strategy. The information is not tailored to the investment needs of any specific person and therefore does not involve a consideration of any of the investment objectives, financial situation or needs of any viewer that may receive it. Kindly also note that past performance is not a reliable indicator of future results. Actual results may differ materially from those anticipated in forward-looking or past performance statements. We assume no liability as to the accuracy or completeness of any of the information and/or content provided herein and the Company cannot be held responsible for any omission, mistake nor for any loss or damage including without limitation to any loss of profit which may arise from reliance on any information supplied by TFA Global Pte Ltd.
The speaker(s) is neither an employee, agent nor representative of Tradu and is therefore acting independently. The opinions given are their own, constitute general market commentary, and do not constitute the opinion or advice of Tradu or any form of personal or investment advice. Tradu neither endorses nor guarantees offerings of third-party speakers, nor is Tradu responsible for the content, veracity or opinions of third-party speakers, presenters or participants.

Strong bearish sentiment For the longest time USDCAD has been bullish, not that we broke and retested the trendline. I see a continuation down to
.35000

USDCAD → Short squeeze for further declineFX:USDCAD is forming another short squeeze relative to the global price range ahead of a possible decline within the global downtrend.
After breaking through the resistance of the global trading range, USDCAD was unable to continue its upward momentum. The price returned to the range, under strong resistance, and is forming a pre-breakdown base for a possible decline. The trigger in our case is support at 1.3762. The dollar is stagnating, trading below strong resistance. A decline in the dollar could trigger a fall in USDCAD
Support levels: 1.376, 1.3695, 1.3629
Resistance levels: 1.3774, 1.3809
The market structure is quite weak, both globally and locally. In addition, against the backdrop of an expected rate cut, the dollar may continue its downward global trend, which may also affect the price of the currency pair, which has formed a false breakout of resistance...
Best regards, R. Linda!

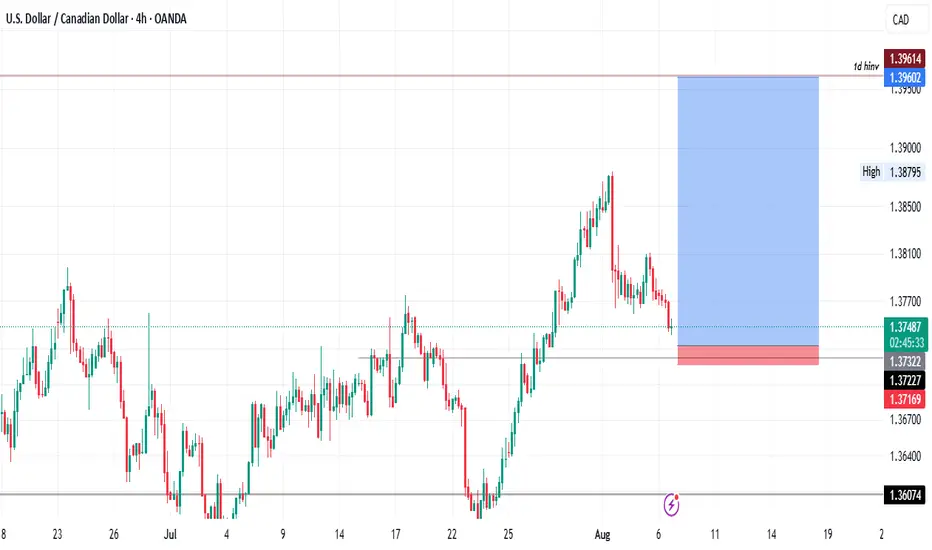
USDCAD- In the monthly (higher timeframes), USDCAD is bullish.
- In the weekly timeframe, price reaction seems to trace a clear uptrend
- In the daily timeframe, it is also in a clear uptrend but at retracement phase due to a hidden 1 day invalidation.
- With our current 4hr timeframe we are tracing for low risk (15 Pips) high reward of up to 1:15 on the trade.
usdcadpotentially trading USDCAD down to discount pricing and then waiting to look for longs if daily orderflow stays bullish

USDCAD support at 1.3730The USDCAD remains in a bullish trend, with recent price action showing signs of a corrective pullback within the broader uptrend.
Support Zone: 1.3730 – a key level from previous consolidation. Price is currently testing or approaching this level.
A bullish rebound from 1.3730 would confirm ongoing upside momentum, with potential targets at:
1.3830 – initial resistance
1.3860 – psychological and structural level
1.3890 – extended resistance on the longer-term chart
Bearish Scenario:
A confirmed break and daily close below 1.3730 would weaken the bullish outlook and suggest deeper downside risk toward:
1.3716 – minor support
1.3690 – stronger support and potential demand zone
Outlook:
Bullish bias remains intact while the WTI Crude holds above 1.3730. A sustained break below this level could shift momentum to the downside in the short term.
This communication is for informational purposes only and should not be viewed as any form of recommendation as to a particular course of action or as investment advice. It is not intended as an offer or solicitation for the purchase or sale of any financial instrument or as an official confirmation of any transaction. Opinions, estimates and assumptions expressed herein are made as of the date of this communication and are subject to change without notice. This communication has been prepared based upon information, including market prices, data and other information, believed to be reliable; however, Trade Nation does not warrant its completeness or accuracy. All market prices and market data contained in or attached to this communication are indicative and subject to change without notice.

USDCAD (sell)USDCAD has broken a previous bullish trendline (green line) and started to fall.
My entry idea is to wait for a pullback and a bounce of the 61% fib level before heading back down to the previous low.
for added confluence you can wait for an overbought level on the stochastic oscillator indicator once it reaches the 61% fib level

ENTRY USDCADDisclaimer:
This is merely a chart-based analytical trading idea and is not considered investment advice. Please manage your risks carefully and conduct your own research before making any trading decisions.

USDCAD Will Go Down From Resistance! Short!
Please, check our technical outlook for USDCAD.
Time Frame: 1D
Current Trend: Bearish
Sentiment: Overbought (based on 7-period RSI)
Forecast: Bearish
The market is trading around a solid horizontal structure 1.375.
The above observations make me that the market will inevitably achieve 1.362 level.
P.S
We determine oversold/overbought condition with RSI indicator.
When it drops below 30 - the market is considered to be oversold.
When it bounces above 70 - the market is considered to be overbought.
Disclosure: I am part of Trade Nation's Influencer program and receive a monthly fee for using their TradingView charts in my analysis.
Like and subscribe and comment my ideas if you enjoy them!

USDCAD SELL OPPORTUNITY Price just formed and broke the symmetrical triangle pattern which is a sign of bearish continuation from the pullback resistance of 1.38550 therefore, a sell opportunity is envisaged from the current market price. Target price is 1.36918

USDCAD: Bulls Will Push
Looking at the chart of USDCAD right now we are seeing some interesting price action on the lower timeframes. Thus a local move up seems to be quite likely.
Disclosure: I am part of Trade Nation's Influencer program and receive a monthly fee for using their TradingView charts in my analysis.
❤️ Please, support our work with like & comment! ❤️

USDCAD's Opportunity Bell Is Ringing — Don’t Miss Out!Hey there, my valued friends!
I’ve prepared a fresh USDCAD analysis just for you.
📌 If the 1.37245 level breaks, the next target will be 1.38000.
Every single like you send my way is the biggest motivation behind sharing these analyses.
🙌 Huge thanks to each and every one of you who supports me!
Would you like to add a visual or a catchy headline to boost engagement even more? I can help with that too.

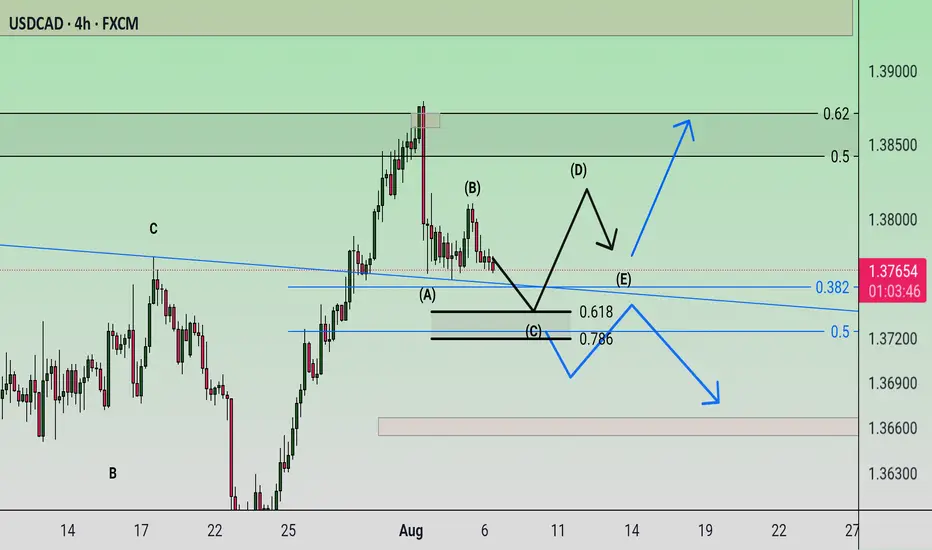
Triangle The triangle pattern is expected to move in the specified direction. Then, with the completion of the corrective pattern, the start of an uptrend is likely. If the price breaks through the specified support area, a continuation of the downtrend is likely.