U.S. Dollar / Canadian Dollar
No trades
Trade ideas
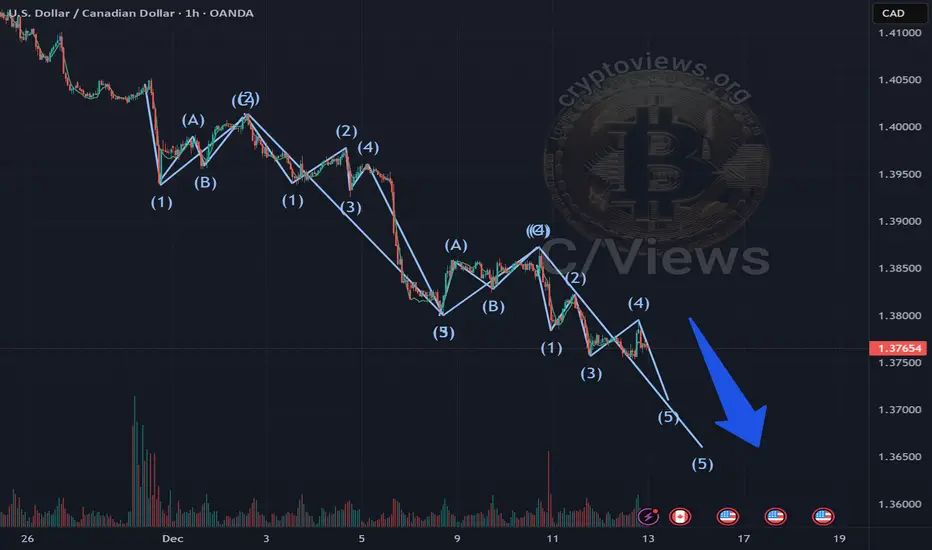
CADX Showing Potential Completion of Elliott Wave StructureCADX is forming a 5th Elliott wave, which suggests the movement is more likely to continue downwards
Based on the 2nd wave, we can estimate the approximate length of the 5th wave
Price movement levels are more likely to be determined using Fibonacci numbers
Full breakdown with levels and graphs on the website
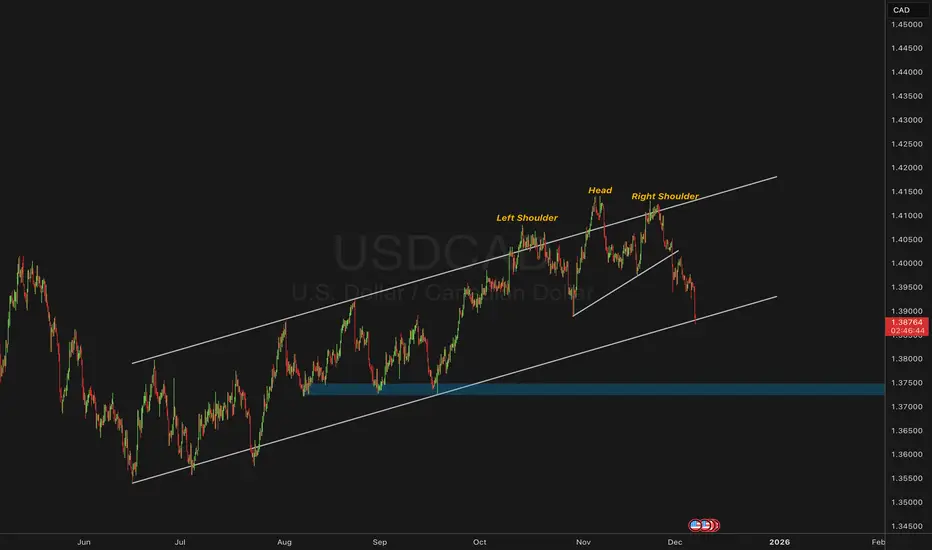
USDCAD | Break Below the Ascending Channel as Data ShiftsUSDCAD extended its decline today after strong Canadian labour data surprised to the upside while the US dollar softened on growing expectations of a dovish Fed shift. The combination has pulled the pair to a two-month low and accelerated a technical break that had been building for weeks.
Technical Lens
Price has broken below the ascending channel that has contained USDCAD since June 2025, a structure that repeatedly acted as dynamic support for trend participants.
This breakdown follows the completion of a head-and-shoulders pattern near the upper channel boundary, with price now driving decisively toward the mid-range support.
The next meaningful zone sits near 1.3750 , which aligns with:
Prior demand from September
A retest of the broader structural shelf
The projected move from the neckline break
This level stands out as the next inflection point to watch.
Scenarios
If momentum continues toward 1.3750
Price could be heading into a key decision area where CAD strength may stabilise, especially if macro conditions continue favouring it.
If price reclaims the broken channel
Recovering back above the former lower boundary could signal a false break, reopening the path toward 1.40 and the mid-channel zone.
Catalysts
Canadian jobs beat boosted CAD: +53.6k jobs, unemployment dipping — strengthening the currency backdrop.
Fed expectations leaning dovish , weighing on USD as traders price in potential rate cuts.
Oil sensitivity: Any extended strength in crude could add pressure on USDCAD.
Upcoming U.S. PCE inflation remains the next major macro pivot; a hotter print could revive USD buying.
Takeaway
USDCAD’s clean break of a six-month rising channel shifts focus to 1.3750 as the next major area of interest — a zone that may decide whether this is a trend reversal or simply a deep correction within the broader structure.
USD/CAD False breakout of 1.3780 sell entry?USD/CAD is following a predictable pattern of false breakout of the swing high and since it starts this down wave.
There is false break 1, then drop
Falose break 2, then another drop
Current price is trending below swing low and there is a higher possility the market to bouce off the swing hihg which is a high probale entry on a falose breakout of the resistance line.

USDCAD // Upward follow-up can be done, including the yellow line support. Cutting losses on continuations that can be kept below the yellow line would be the right decision.

Usdcad on the move downthe amazing move down the channel up been breakdown there is stronger pull down as it has passs the 50% lets sell
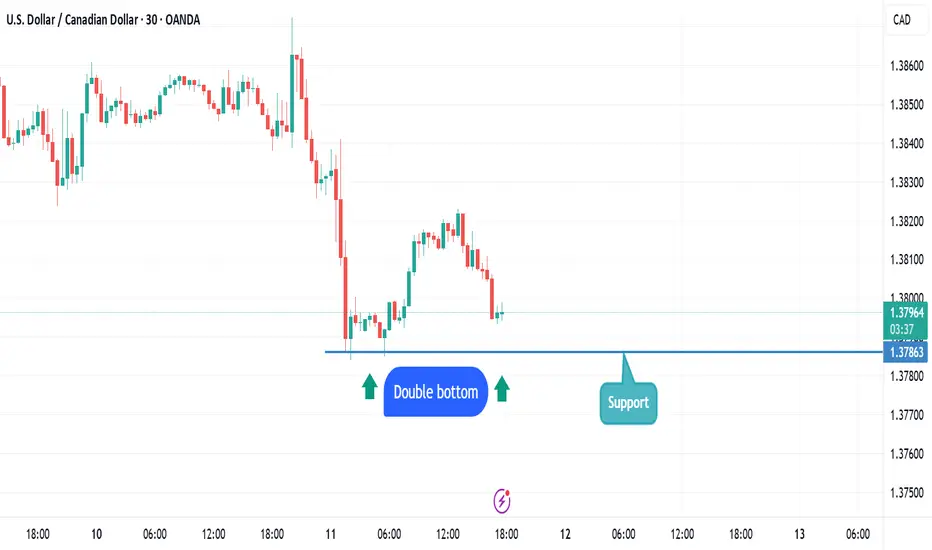
Double bottom on USDCADUSDCAD is close to its support area at 1.3786
If it reaches that and dont break it it will form a double bottom and go up
SHORT ENTRY OPPORTUNITY IN USDCADThis could be a good short opportunity because the price might drop significantly.

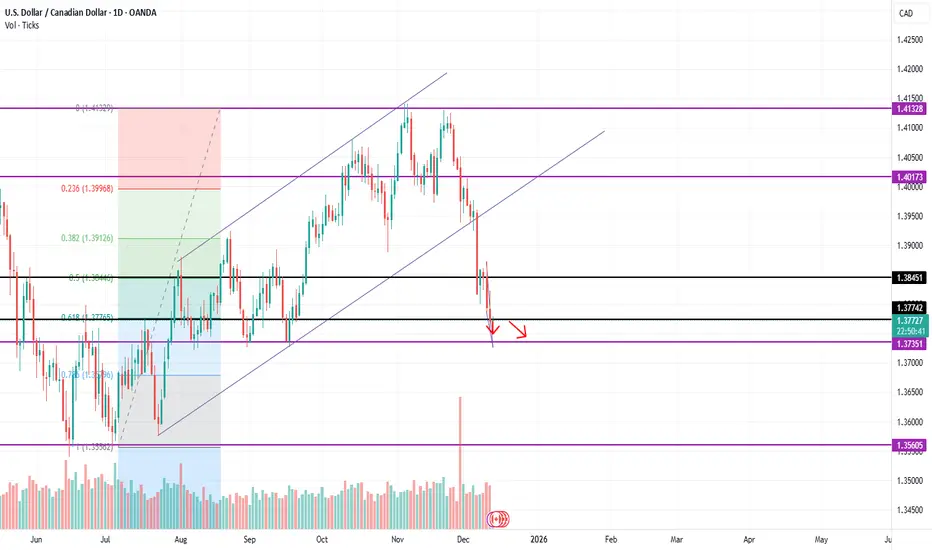
USD/CAD Collapse Continues After Fed & BoC DecisionsUSD/CAD is trading within the confines of an embedded channel extending off the late-November high. Initial support rests with the 61.8% retracement of the June advance at 1.3769 and is backed by a more significant confluence zone at 1.3722/34- a region defined by the August and September lows, and the 2025 low-week close (LWC). Look for a larger reaction there IF reached with a break / close below this threshold threatening another bout of accelerated losses. Subsequent support rests with the 78.6% retracement at 1.3669.
Initial resistance is eyed at the highlight slope confluence near ~1.3850 and is backed by a key pivot zone at 1.3881-1.3904- a region defined by the 2022 high close, the 2023 high and the 200-day moving average. A breach / close above this threshold would be needed to suggest a more significant low is in place and that a larger trend reversal is underway. Subsequent resistance objectives eyed at the November low / October low-day close (LDC) at 1.3938/42 and the 2022 high at 1.3978.
Bottom line: A three-week decline in USD/CAD is now approaching key technical support barriers at the lower bounds of the late-November downtrend. While the medium-term outlook remains weighted to the downside, the decline may be vulnerable near-term into this threshold, and the risk rises for inflection at the lower parallel. From a trading standpoint, look to zone to reduce short-exposure / lower protective stops on a drop towards trend support. Rallies should be limited to the 1.38-handle IF price is heading lower on this stretch with a close below 1.3722 needed to fuel the next major leg of the decline.
-MB


USDCAD nearing Resistance ShortUSDCAD is under correction and soon price will drop again from the resistance level to support level short it. let us see how it playsout

USDCAD in Sharp focus as BoC and Fed decision loomThe USD/CAD forecast is subject to heigtened volatility today as both North American banks will decide on thier repective monetary polices.
Bank of Canada to push back against rate hike bets
The bank of canada will shorty decide on interest rates, and literally no one is expecting any changes, meaning the policy rate is set to remain at 2.25%. This meeting takes place amid a broder hawkish shift in globe rate expectations, which is party why commodity dollars have bounced bank with markets pricing in around 30 basis points of rate hikes from the BoC

Cad is ready to bay Due to the return of the price to the breaking part of the previous ceiling, and also in the area of 76.4 Fibonacci, we are ready to buy.

USD/CAD chart to watchFollowing the release of stronger US data, the US dollar extended its gains against most major currencies, most notably the yen, although remained lower against the ComDolls. The USD/CAD is an interesting pair to watch, with the CAD looking quite strong.
A recap of today's US data:
JOLTS October job openings 7.600M vs 7.150M estimate
Weekly ADP employment +4.75K versus -13.5K in its last weekly release
BoC and Fed in focus
Next up is the Bank of Canada’s turn to hold policy steady on Wednesday, where the central bank may hint at the next move being a hike in 2026.
Of course, the big central bank meeting is happening this week: the US the Federal Reserve, which is widely expect to trim rates by an additional 25 basis points on Wednesday. But the cut is almost fully priced in. So, the real market mover won’t be the cut itself, but more so the Fed’s tone about rates outlook in 2026 and beyond.
If Powell & Co. don’t validate the 70-80 basis points of easing priced in for 2026, the dollar could bounce back, at least temporarily.
The USD/CAD may then resume lower from around the shaded resistance region marked on the chart, between 1.3890 to 1.3950. Bullish if we go above it.
By Fawad Razaqzada, market analyst with FOREX.com

USD/CAD - Daily Oversold Bounce Setup Into 1.40000 TargetUSD/CAD Post-News Recovery Play: 0.786 Fib Hold + DeM Oversold Signal 1.40000
The US Dollar/Canadian Dollar has pulled back to a critical support zone following recent news volatility, setting up a potential swing trade opportunity targeting the psychological 1.40000 level. Technical confluence at the 0.786 Fibonacci retracement combined with deeply oversold momentum indicators suggests this pullback may be nearing exhaustion.
📊 Technical Setup Overview:
Current Status: Holding 0.786 Fibonacci retracement
Daily Momentum: DeMarker (DeM) indicator showing extreme oversold conditions
Target: 1.40000 psychological resistance
Trade Type: Swing position - multi-day hold
📈 Why This Level Matters:
0.786 Fibonacci Retracement:
The 0.786 level represents one of the deepest retracement zones in trending markets before a reversal becomes a trend change. USD/CAD has tested and held this mathematical support level, indicating strong buying interest at current prices.
This Fibonacci level was calculated from the recent swing low to swing high and marks the zone where institutional accumulation typically occurs during healthy trend corrections.
DeMarker Oversold on Daily Chart:
The DeMarker oscillator on the daily timeframe has reached extreme oversold territory - a condition that historically precedes mean reversion moves. When DeM reaches these levels, it indicates selling pressure has reached exhaustion and momentum is primed for reversal.
Unlike intraday noise, daily DeM oversold readings carry significant weight as they represent sustained directional pressure across multiple trading sessions that is now reaching a turning point.
1.40000 Psychological Target:
Round numbers act as magnetic price levels in forex markets due to:
Order clustering from institutional and retail traders
Option strike concentrations
Psychological significance creating self-fulfilling behavior
Previous support/resistance memory at these levels
The 1.40000 level represents approximately 150-200 pips of upside potential from current support, offering favorable risk/reward for a swing position.
🎯 Trade Structure:
Entry Consideration: Current 0.786 Fibonacci support zone
Stop Loss: Below recent swing low (structure invalidation)
First Target: 1.3900 (psychological level, profit-taking zone)
Primary Target: 1.40000 (round number resistance)
Timeframe: Multi-day swing trade (3-7 days estimated)
Risk Management:
Position sizing should account for potential 50-80 pip stop loss distance. The 1.40000 target offers approximately 2:1 to 3:1 reward-to-risk ratio depending on exact entry and stop placement.
📰 Post-News Context:
Recent news events created volatility that pushed USD/CAD into this technical support zone. Post-news environments often see:
Reduced volatility as immediate reactions are priced in
Technical levels regaining importance as primary drivers
Mean reversion opportunities as emotional extremes normalize
The combination of news-driven overselling into strong technical support creates a setup where fundamental pressure has eased while technical structure remains intact.
📊 Daily Chart Analysis:
Structure:
Higher timeframe uptrend remains intact
Current pullback represents correction within larger bullish context
0.786 Fibonacci acting as demand zone
Momentum:
DeM indicator deeply oversold (condition that preceded previous bounces)
Divergence may be forming (price making lower lows while momentum stabilizes)
Volume showing signs of exhaustion rather than acceleration
Key Levels:
Support: 0.786 Fibonacci zone (current)
Resistance 1: 1.3900 (first profit-taking area)
Resistance 2: 1.40000 (primary target)
🧠 Why Traders Miss These Setups:
Emotional Comfort vs. Technical Opportunity:
After a sustained decline, USD/CAD "feels" weak and most traders assume further downside. But the best risk/reward exists precisely when sentiment is most negative and price has reached structural support.
Waiting for Confirmation:
Many will wait for USD/CAD to break above 1.3850 to "confirm" the reversal. By then, risk has expanded 50-80 pips and reward has compressed by the same amount. Entries at technical support with defined risk offer superior asymmetry.
Ignoring Daily Timeframe Signals:
Intraday traders focused on 1-hour or 4-hour charts may miss the significance of daily DeM oversold conditions. These higher timeframe signals carry more weight and have longer-lasting effects on directional bias.
News-Driven Fear:
Recent news created the selloff, making traders cautious about catching a "falling knife." However, technical analysis helps identify where the knife lands - the 0.786 Fibonacci support.
📅 Timeframe and Catalysts:
Expected Duration:
This swing trade setup could take 3-7 trading days to reach the 1.40000 target, depending on:
Broader USD strength/weakness
Oil price movements (CAD correlation)
Risk sentiment shifts
Upcoming economic data releases
Potential Catalysts:
US economic data supporting dollar strength
Weakness in crude oil (negative for CAD)
Risk-off flows benefiting USD as safe haven
Technical buying at support creating momentum
⚠️ Risk Factors:
What Could Invalidate This Setup:
Support Breakdown:
If USD/CAD closes decisively below the 0.786 Fibonacci support on the daily chart, the thesis is compromised. This would indicate the correction is deeper than typical and may target the next Fibonacci level.
Fundamental Shifts:
Unexpected dovish Fed policy signals
Surge in crude oil prices (bullish for CAD)
Risk-on environment reducing USD safe-haven demand
Canadian economic data significantly exceeding expectations
Technical Failure:
Daily DeM can remain oversold longer than expected during strong trending moves. If the broader trend has changed from bullish to bearish, mean reversion may not occur at typical technical levels.
Geopolitical Events:
Unforeseen news events could override technical structure and create renewed selling pressure regardless of oversold conditions.
🏆 The Professional Approach:
They Buy Structure, Not Sentiment:
The 0.786 Fibonacci + daily DeM oversold combination provides objective structure. Professional traders recognize this confluence as an area where probability favors reversal, regardless of how the chart "feels."
They Size for Volatility:
USD/CAD is a major pair but still experiences 50-100 pip daily ranges. Position sizing accounts for this inherent volatility while keeping total portfolio risk at 1-2% per trade.
They Accept Being Early:
The perfect bottom is unknowable. Entries at structural support with defined stops accept that price may test the level multiple times before resolving higher. This is why stop placement below structure (not arbitrary) is critical.
They Scale Out at Targets:
Rather than holding for the full 1.40000 target:
Reduce 1/3 at 1.3850 (books profit, reduces emotional pressure)
Reduce 1/3 at 1.3900 (locks gains, allows breathing room)
Final 1/3 at 1.40000 or trailing stop (maximizes upside)
This approach removes emotion from exit decisions and ensures partial profits are captured even if the full target isn't reached.
📌 Key Takeaways:
✅ Technical confluence present: 0.786 Fibonacci support + daily DeM oversold creates high-probability setup
✅ Clear target structure: 1.40000 offers 150-200 pip upside with defined reward-to-risk asymmetry
✅ Post-news environment: Emotional selling into technical support often marks turning points
✅ Risk is defined: Stop below 0.786 support provides clear invalidation point
✅ Daily timeframe signal: Higher timeframe oversold conditions carry more weight than intraday fluctuations
⚠️ Important Disclaimers:
This analysis is for educational purposes and reflects a technical view based on Fibonacci retracement levels, momentum indicators, and structural support. It is not financial advice or a recommendation to buy or sell USD/CAD or any currency pair.
Forex trading involves substantial risk of loss. The 0.786 Fibonacci support could fail, and daily DeM can remain oversold during strong trending moves. Past instances of reversals from these conditions do not guarantee similar outcomes.
Market conditions can change rapidly due to economic data, central bank policy, geopolitical events, and liquidity conditions. What appears as technical support may not hold during fundamental regime changes.
Position sizing must account for volatility and potential for stop loss to be hit. Never risk more than you can afford to lose on any single trade.
Always conduct independent analysis, consider your risk tolerance, and consult with a financial professional if needed. All forex trading involves significant risk.
✨ Your Perspective:
Are you watching USD/CAD at these levels? How do you trade Fibonacci + momentum confluence setups? Share your approach in the comments.
📜 Trade the structure. Manage the risk. Stay disciplined.

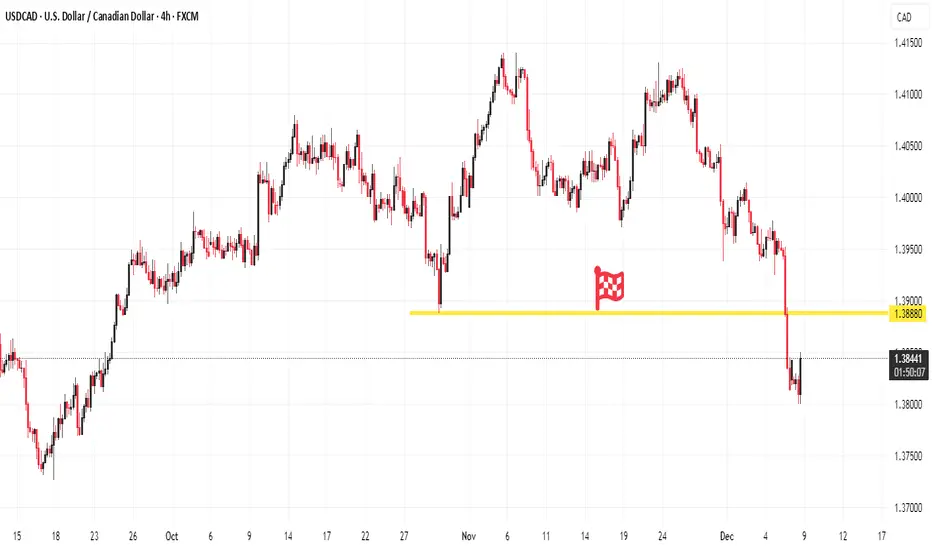
USdCad Buy!!!we’re expecting a significant rise as price dropped closer to a support level.
TP 1.38880
USD/CAD | Bearish move ahead? (READ THE CAPTION!) Good evening fam, Amirali here.
So, by examining the 4H chart of USDCAD, we can see that USDCAD is now in the demand zone and on a bullish move. Should USDCAD fail to move above the demand zone, a fall to the 1.37350-1.3755 bullish OB zone is very likely. If it fails to bounce back up from the bullish OB, a further fall to 1.37090 is possible. If USDCAD manages to bounce back up, a rise to 1.38450-1.38850 is possible.

USDCAD LONG HELLO
Mid term long position usdcad pair
dxy will up to next 2 weeks
Entry today
TP 1.41588

usdcad Strongly Bearish sell Planusdcad Strongly Bearish
major Target is PML.
if i got the price in Premium that will be fine for Good RR.
looking For sell setups from above till previous month low.
recently liquidity sitting previous week low i want sweep that and buy till Bearish point of interest.

USDCAD Bearish Extension ModelIt finally looks like price has completed its correction on the daily chart. After Fridays hawkish U.S. data and stronger than expected Canadian data, we saw a sharp sell off to close the week.
Going into next week, I am expecting price to form a retracement and retest broken structure. We may see price revisit last weeks highs or lows before continuing its move to the downside.
I will be looking to capitalize on another bearish position, but only when the conditions are right. Patience will be key here.

USD/CAD pair It's currently very bullish- the bullish trend currently feels very strong on this pair, I like it for a longer period of time cause USD It's getting bullish against other currencies and CAD shows quite week on the chart
- A very nice opportunity for the current month with adding new long positions after the corrections based on previous long trend
- After Wednesday rate cuts the USD will just continue to get stronger against the CAD and other currencies
let me know also your opinion in the comments bellow.

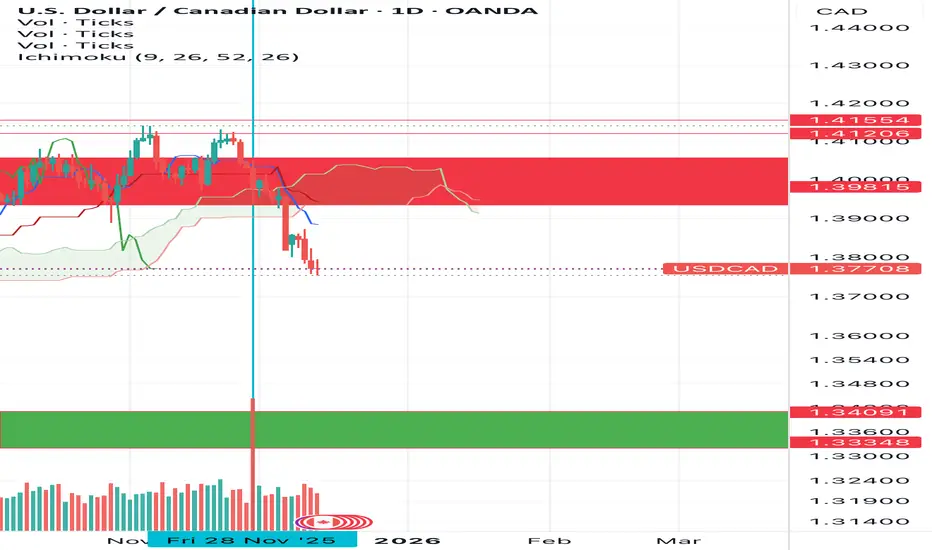
USDCAD: Buyers Defend Support — Recovery Ahead?USDCAD is reacting firmly inside a high-value support pocket, where the channel baseline, prior demand, and heavy volume clustering align — a classic area where sentiment often shifts.
Despite the market already pricing in December Fed rate cuts, short-term price behavior on this pair remains resilient. The latest bounce suggests that buyers are stepping back in, keeping my near-term outlook tilted to the upside, with room for a rotation toward the 1.4080 zone if momentum continues to build. However, if price breaks below the current support zone, USDCAD could slide even further, opening the door to a deeper corrective leg.
The real question now is:
Are we witnessing the beginning of a genuine recovery leg, or just a temporary relief move before direction resets?
Based on :
- fundamental analysis
- volume and quantitative analysis

USD/CAD long opprotunityLooking for a long trade on USD/CAD pair , might reach the previous highs, but playing it safe and not aiming for the full extension at the top
