U.S. Dollar / Canadian Dollar
No trades
Trade ideas


USDCAD - Bearish BiasAnalyzing the previous candle on the D1 timeframe (Tuesday's candle), we can see we had a clear sweep of other previous D1 candle's high (Monday's candle).
Now after the sweep of Monday's high, we closed back inside Monday's candle range. So with that in mind, I'm anticipating, and confident enough that the next liquidity price is gonna draw to is Tuesday candle Low, and possibly if there's high volume, we wanna see previous Fridays Low also being takes.
And that alarms the bias for today (Wednesday).
That does not mean going on to your chart 📉 and putting your SELL order, but with careful analysis, we first anticipate price to pull back into a PDA, 1h Internal Range Liquidity (a FVG, a sweep into an old highs or testing and OB), only then we can be confident hunting for sells in alignment with the overall BIAS for today.
I'm Zak, and I'm starting a new journey in giving back the knowledge I've acquired in my 4 years trading experience.
So if you found this useful, please show me your support and I'll continue to do this everyday.
Much love trader 😊

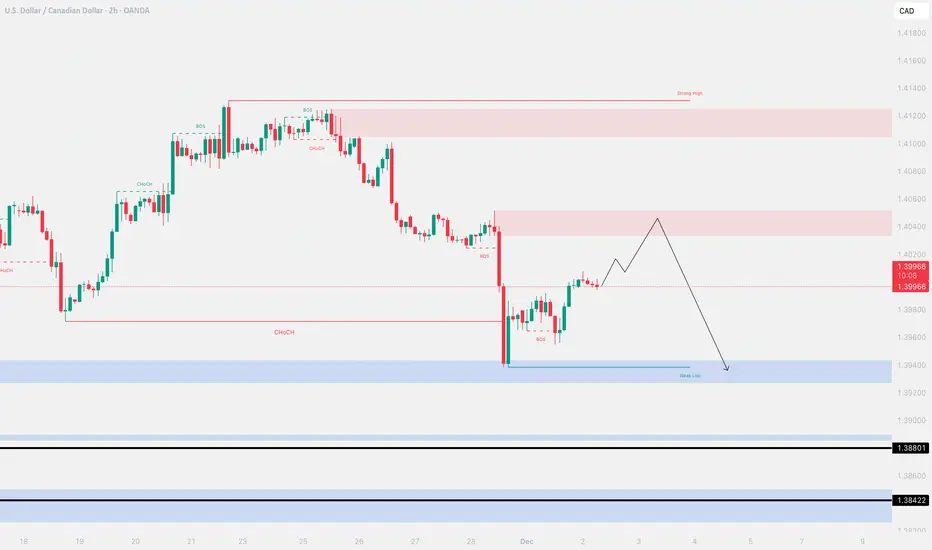
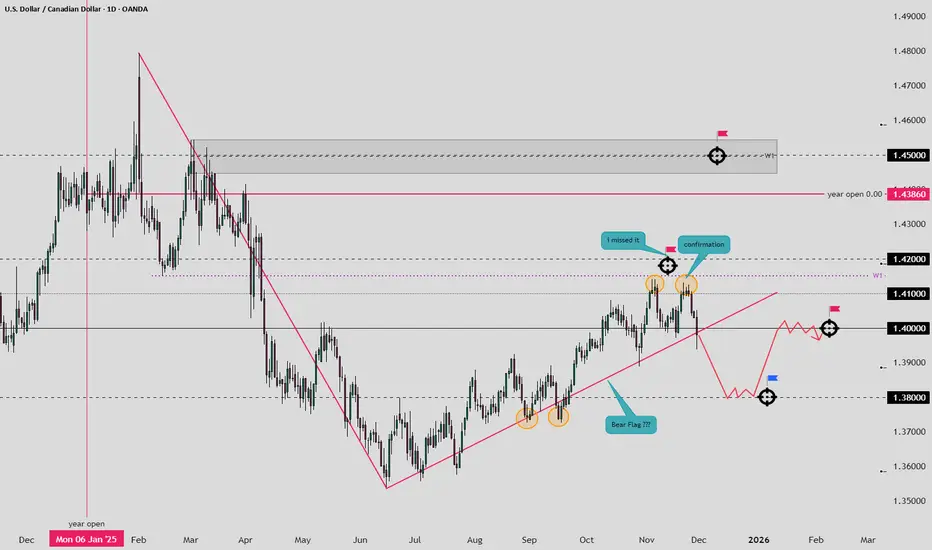
usdcadUSDCAD bounced from a demand zone but the broader structure still points lower.
Price may climb into the 1.4020–1.4040 supply zone to collect liquidity before a deeper move down.
Main idea:
Retracement first → continuation toward the weak low.
As long as price stays below supply, downside remains the preferred path.
USDCAD H1: Looking for BUYSUSDCAD has been consolidating throughout November while maintaining its overall bullish structure, with neither the previous Higher High (HH) nor Higher Low (HL) being violated. Price has now formed a clean demand zone around the most recent HL structure point, and I’ll be monitoring that area for potential long entries.

USD/CAD: Bullish Move After Bear TrapI see a potential bearish trap on #USDCAD following a test of a significant daily support level.
The formation of a cup and handle pattern on the 4-hour timeframe after the market opened indicates considerable buying interest.
I anticipate a rise to 1.4031.

BUY USD CAD DailyUSDCAD is bouncing off support on the daily chart for a swing of 1:2 RR here. Candle action suggests there could be upwards momentum for this trade, which is why I would be willing to add to this trade if it moves in my favor. 4 H chart shows great upwards momentum on the breakout from resistance.

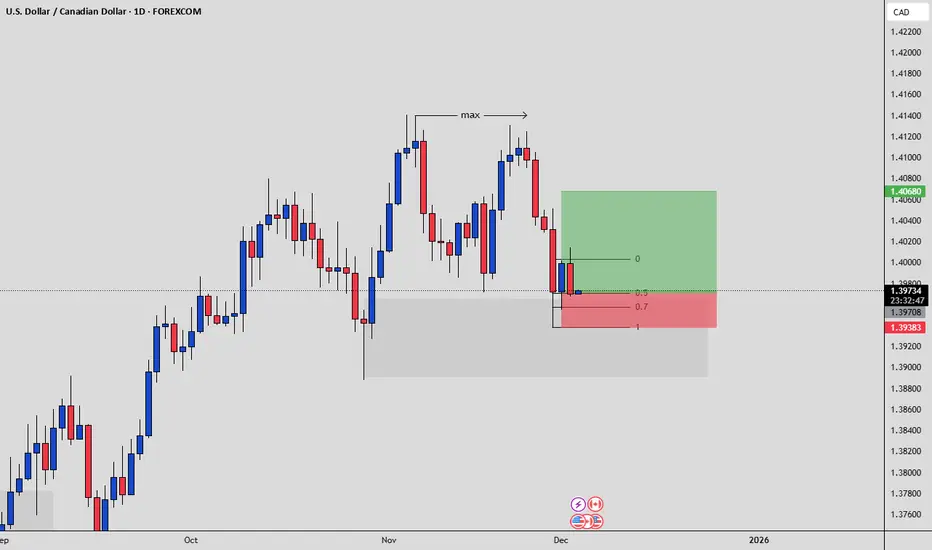
USDCAD“Pullback to Demand + Trendline Retest”
Best Entry Zone:
➡️ 1.3900–1.3930 (green demand zone)
→ Preferably with a 4H bullish confirmation candle
Targets:
1.4050 — intermediate resistance
1.4120–1.4180 — main target zone
Stop-Loss:
➡️ Below 1.3860 (invalidates the structure and breaks the channel support)

USDCAD outcome!USDCAD moving up in the second half of the NY session. 2 possible outcomes in the Asian and London session. Bounce off TrendLine or Continue to RESISTANCE.

Monitoring pullback to enter a short tradeWill be monitoring pullback and rejection to enter a short trade.

USDCAD can break channel resistance.The USDCAD rebound from monthly lows below 1.3940 on Friday has stalled beneath the significant 1.4000 level on Monday. The pair is hovering above 1.3980 at the time of writing. However, higher oil prices and market expectations of imminent Fed rate cuts are restricting further upward movement for now.
Additionally, the Canadian Dollar remains supported by the upbeat Canadian Gross Domestic Product (GDP) figures released on Friday. The Canadian economy rebounded with unexpected strength in Q3, growing at a 0.6% quarterly rate and recovering from a 0.5% contraction in Q2. YoY, GDP grew 2.6%, surpassing expectations of 0.5% growth and following a 1.8% decline in the previous quarter.
Technically, USDCAD is trading within a support and resistance channel, following a pattern of lower lows and lower highs. On Friday, it rebounded from its support zone and is currently trading near its 20-day Exponential Moving Average (EMA).
If the pair breaks above the 20-day EMA at 1.3986, it is likely to reach the channel resistance at 1.4004 before potentially dropping a few pips toward the support zone. In the coming days, we expect it to rebound from the support zone, break above both the 50-day EMA and the channel resistance at 1.4004, and start a new upward trend toward the 1.4050 level.

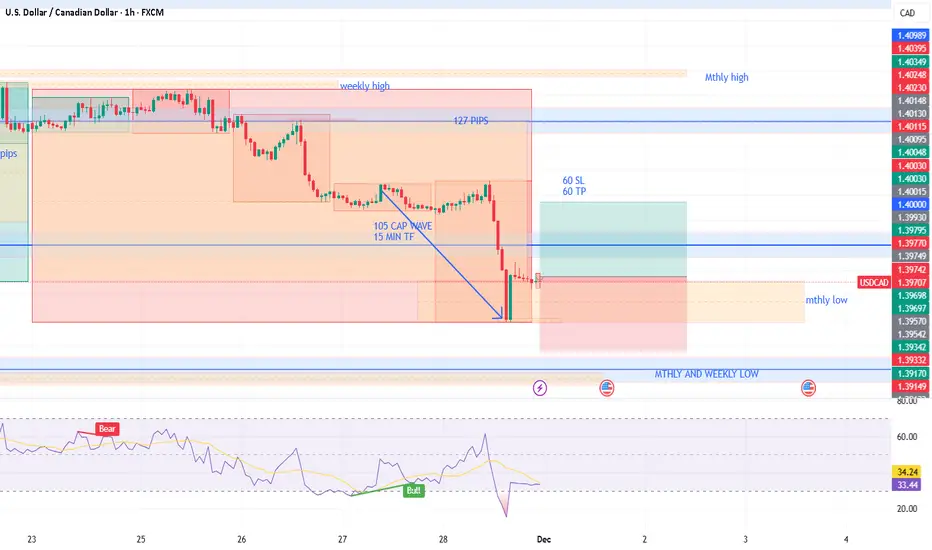
USDCAD weekly confirmation with Mthly Low and Cap Wave USDCAD had good weekly bearish confirmation ending the week on a mthly low which also had RSI confirmation and a CAP Wave of 105 on the 15min TF. Also Friday's GDP red report surprised the market with it's unexpected good results. RSI at the point of the report also highlighted this. Could the market continue to rise as market reacts to Black Friday and Cyber Monday trading. Took 1.5% risk to see if it hits TP before next set of fundamentals.

USDCAD December 2025 fundamental analysisThe fundamental outlook for USD/CAD in December 2025 suggests a market in transition, with forecasts pointing to a potential topping structure and possible medium-term correction. Multiple sources project that the pair will trade in the 1.40–1.43 range early in the month, but could see downward pressure toward the end of the year due to diverging monetary policy expectations and macroeconomic factors.
Key Drivers
The Federal Reserve is widely expected to cut interest rates in December 2025, increasing downward pressure on the US dollar by reducing its yield advantage over the Canadian dollar.
The Bank of Canada’s monetary stance, though also dovish, is somewhat constrained by relatively firm domestic economic data and the need to keep inflation in check.
Oil prices, which have seen recent declines, limit support for the Canadian dollar, but unless prices fall further, their negative impact may fade.
Technical analysis highlights a bullish structure, but with clear signs of fading momentum; a failure to hold above the 1.40–1.41 level could confirm a deeper correction into early 2026.
Target Levels
Consensus targets for December 2025 range from an average of 1.40–1.41 (early December) to 1.35–1.39 as the year closes, depending on how aggressively the Fed eases and how oil prices and risk sentiment evolve.
Sustained breaks above 1.43 would negate the downside scenario and open room for renewed USD strength; a move below 1.40 is seen as a technical trigger for wider CAD gains.
Trading verdict for December 2025
The broad outlook and technical signals indicate that upside momentum in USD/CAD is stalling and that a correction—potentially toward 1.36–1.39—is favored for December 2025. While short-term rallies might occur early in the month, the pair appears more likely to be a sell on strength from the 1.41–1.43 region, with the risk of a move lower as year-end approaches.

[Long] USDCAD bullish harmonics patternI missed the entry to this small bullish setup, will look for entry if it comes down in the coming week. Not trading advice
Update Formation..
it didn't come to my sweet spot Sell, so i change formation, waiting for next trade... be patience.
i can't predict future, just planning "if-in-fact" for the future.
USDCAD: Bullish Forecast & Bullish Scenario
The analysis of the USDCAD chart clearly shows us that the pair is finally about to go up due to the rising pressure from the buyers.
❤️ Please, support our work with like & comment! ❤️


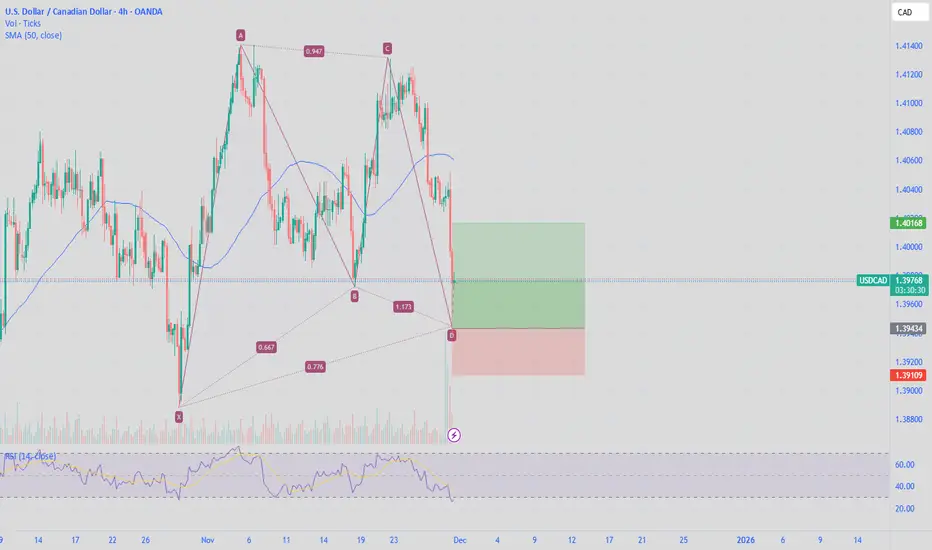
Gartley setup in the Canada …Gartley pattern, closing in on counting complete @13920-40. See if we can hit and reject

USD/CAD - Why the Canadian Dolor struglles in front of USD?As a fundamental point of view, the Canadian Dolor is still under the pressure of it's older brother, USD. With all the geopolitical tensions between this 2 neighbour countries, i am seeing again the USD gaining in front of the CAD.
As a tehnical point of view, on the HTF chart (daily) we can see a really nice chain of demands respected, price everytime reacted inside the demand after taking liquidity. It is the same case right now, as we see price retracing back to a demand zone (4h chart), taking the liquidity resting above it and right now we need to see the bulls entering this market to protect their gains.
The LTF is squizing the price, after the drop from the LH formed that failed to break the old structure. From my point of view, this is a good oportunity to enter buys also because of the fact that our HL is protected. If this zone is invalidated, my whole ideea will not stand anymore.
There is no clear bearish orderflow even in lower timeframes, just a drop in price, and a beggining of a consolidation market. Once the fractal structure changes bullish on the 4h chart, i will be even more confident to extend my risk and add more to the trade.
Also, fundamentally speaking, we all know about the rate cuts that will happen in December, there will be no surprise if FED will cut the rates with 0.25%. It will be a surprise if they don't and what are going to do after in the future. So right now, in my opinion, the decision is already pricing in.
Make sure to follow for more analyse in the future.

