USDCAD bullish continuation supported at 1.3795The USDCAD remains in a bullish trend, with recent price action showing signs of a corrective pullback within the broader uptrend.
Support Zone: 1.3795 – a key level from previous consolidation. Price is currently testing or approaching this level.
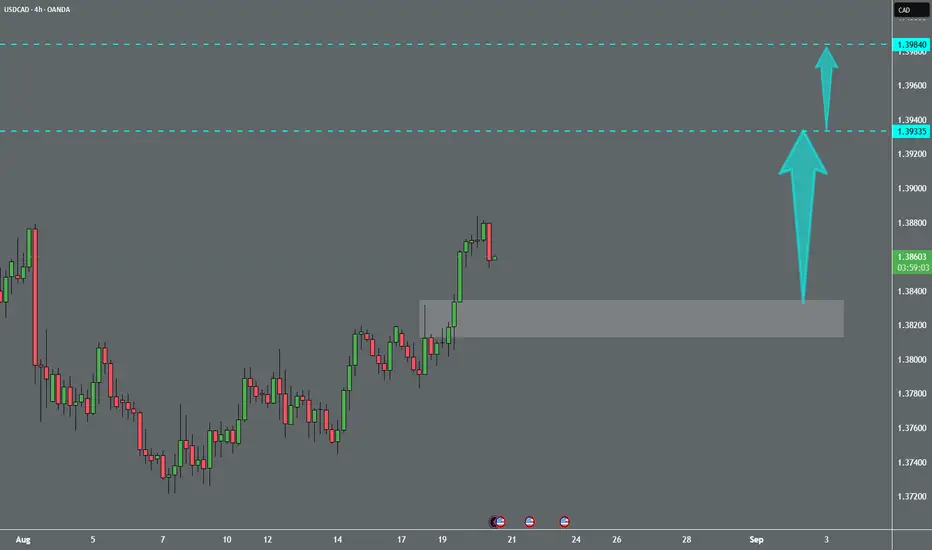
A bullish rebound from 1.3795 would confirm ongoing upside momentum, with potential targets at:
1.3890 – initial resistance
1.3920 – psychological and structural level
1.3945 – extended resistance on the longer-term chart
Bearish Scenario:
A confirmed break and daily close below 1.3795 would weaken the bullish outlook and suggest deeper downside risk toward:
1.3770 – minor support
1.3745 – stronger support and potential demand zone
Outlook:
Bullish bias remains intact while the USDCAD holds above 1.3795. A sustained break below this level could shift momentum to the downside in the short term.
This communication is for informational purposes only and should not be viewed as any form of recommendation as to a particular course of action or as investment advice. It is not intended as an offer or solicitation for the purchase or sale of any financial instrument or as an official confirmation of any transaction. Opinions, estimates and assumptions expressed herein are made as of the date of this communication and are subject to change without notice. This communication has been prepared based upon information, including market prices, data and other information, believed to be reliable; however, Trade Nation does not warrant its completeness or accuracy. All market prices and market data contained in or attached to this communication are indicative and subject to change without notice.
USDCAD trade ideas

USD/CAD - Potential TargetsDear Friends in Trading,
Let me know if anything is unclear.
I sincerely hope my point of view offers a valued insight.
Thank you for taking the time study my analysis.
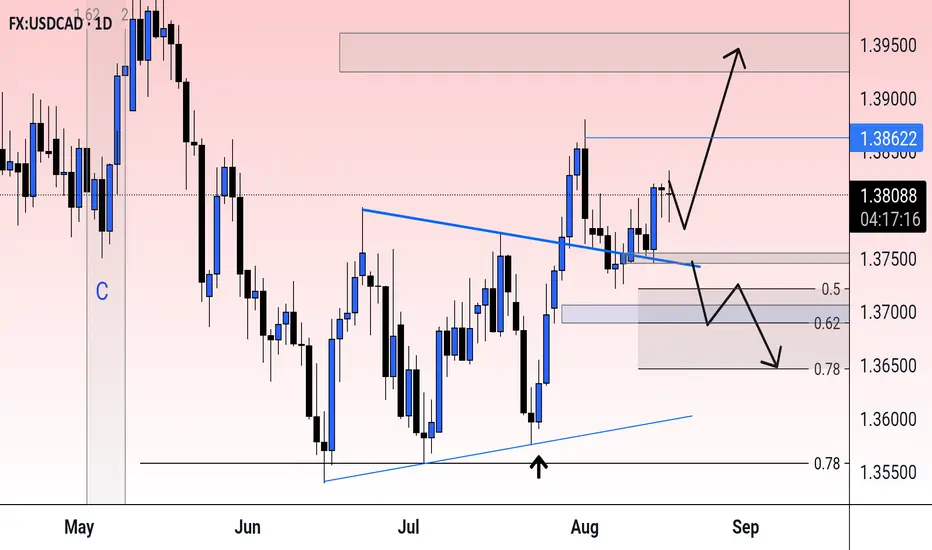
USDCAD - price increase after correction. Bullish trendA reversal pattern is forming, indicating the emergence of limit resistance from bears. The pattern structure has been broken, and the price has entered the realization phase. As part of a downward rally, USDCAD may test 0.5 Fibonacci and return to the bullish trend.
Scenario: The current aggressive decline may be halted by a strong support zone, which has several confirmations. A false breakdown and consolidation above 1.3831 - 1.3835 will confirm the bullish sentiment and may return the price to retest the resistance at 1.3879.

USDCAD Challenges the 1.3880 ResistanceUSDCAD is in a bullish breakout mode, holding firmly above 1.37 and breaking out from a one-month consolidation range. It is now testing the 1.3880 resistance. A clean hold above this level could confirm a breakout toward the 1.40 target — the projected completion of the current pattern.
The 3-day RSI is trending above the neutral 50 level, reinforcing dollar strength. However, with key resistance in sight, A pullback below 1.3840 may revisit the 1.37 support, possibly triggering either a rebound or a deeper move back toward 1.36 and 1.35 (the 2025 lows).
Key Events in Sight:
- FOMC Minutes (today)
- Fed Powell Speech (Friday)
- Razan Hilal, CMT

USDCAD: Overbought Market & Pullback 🇺🇸🇨🇦
USDCAD looks overbought after a yesterday's bullish rally.
The price reached a key daily resistance and I see a confirmed
bearish breakout of a support line of a rising channel on an hourly time frame.
I expect a retracement at least to 1.3864 support.
❤️Please, support my work with like, thank you!❤️
I am part of Trade Nation's Influencer program and receive a monthly fee for using their TradingView charts in my analysis.

Liquidity Sweep and Bearish Setup on USD/CADFenzoFx—USD/CAD swept the liquidity above the 1.387 resistance, currently trading below this level. The 4-hour chart shows the pair formed a long wick bearish candlestick pattern.
The immediate support is at 1.386. From a technical perspective, a close with a bearish engulfing candlestick should be considered as a change of character. In this scenario, we expect the price to dip toward the next support level at 1.381.

USDCAD Monthly | Bullish Engulfing off Rising Trendline Support 📈 Chart Overview:
USDCAD has shown strong respect for the rising trendline support since mid-2023. Price recently tapped into this trendline again, forming a bullish engulfing candle on the monthly timeframe, a powerful reversal signal.
🔑 Key Technicals:
✅ Rising Trendline Support has been tested multiple times and held.
✅ A Bullish Engulfing Candle confirms potential bullish momentum.
✅ Price rejected the Order Block close-level near 1.36074.
✅ Fair Value Gap (FVG) above price creates a magnet for liquidity.
🎯 Upside Targets (TP Levels):
TP1: 1.40161
TP2: 1.41226
TP3: 1.42429
TP4: 1.44164
TP5: 1.45921
⚠️ Invalidation:
A monthly close below 1.36220 would weaken the bullish outlook and may indicate deeper downside.
📌 Trading Plan:
Long bias as long as price respects the rising trendline.
Scaling out profits at each TP level is recommended.
🔥 Conclusion:
USDCAD is showing strong bullish reversal signs from a major trendline. With a clear bullish engulfing confirmation and multiple liquidity targets above, the pair looks set for a sustained move higher.

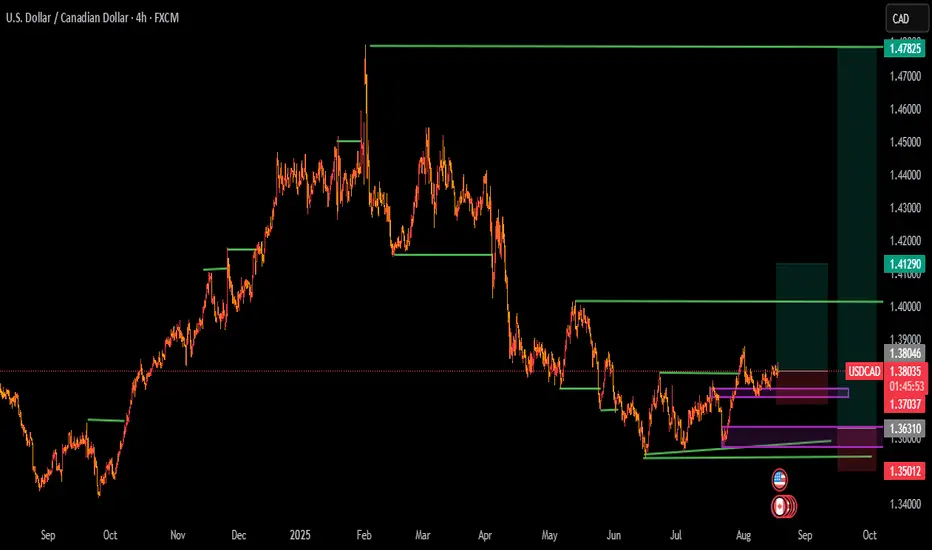
USD/CAD Continuation After Support at Prior Triangle ResistanceAs we move towards the Jackson Hole Economic Symposium later this week USD/CAD has set up as one of the cleaner pairs for USD-strength, and that's been a building backdrop for much of the past month and a half.
Even as USD set a fresh three-year low on day one of Q3, USD/CAD held a higher-low, forming a bullish trendline. That trendline was in-play a couple weeks later, on July 23rd, helping to hold yet another higher-low. At that point, the ascending triangle formation was set and those are often approached with aim of bullish breakout, which took place a week later with some help from the FOMC meeting.
WIth a fast reversal in DXY on August 1st, USD/CAD held up relatively well, showing support around that prior resistance of 1.3750 while only retracing 50% of the prior rally. As covered in these posts, that kept the pair as attractive for USD-strength, and even though we haven't seen much of that so far in August, USD/CAD has rallied to make another run at that August 1st high.
As we go towards Jackson Hole this pair presents as one of the more attractive cases for USD-strength, if we do see Powell step back from the massive expectation for rate cuts to begin at the Fed's next meeting in a month.
For levels - the next key point of resistance is around 1.3900 followed by a big spot at the 1.4000 handle. But, bigger picture, it's the 1.4151-1.4178 zone that stands out, as this resistance-turned-support hasn't yet been re-tested for resistance since the breakdown around 'Liberation day' in early-April.
If we see a USD rally kick off and USD/CAD lead the way-higher, that becomes a point for reversal setups. - js


USD_CAD RSISTANCE AHEAD|SHORT|
✅USD_CAD is going up to retest
A horizontal resistance of 1.3880
Which makes me locally bearish biased
And I think that we will see a pullback
And a move down from the level
Towards the target below at 1.3847
SHORT🔥
✅Like and subscribe to never miss a new idea!✅

USDCAD potentail longs due to weaker than expected CAD CPI y/y The Canadian Consumer Price Index (CPI) for July 2025 showed a year-over-year (YoY) increase of 1.7%, down from 1.9% in June 2025 and below the forecast of 1.8%. The decline in headline inflation was largely due to falling gasoline prices, though food and shelter costs continued to push inflation higher.
Due to the weaker-than-expected economic data, we expect the CAD to weaken against the USD.

USDCAD SELL BAISThe USDCAD pair's pulling back from a high point near 1.3835 after hitting a dynamic resistance area. There's a chance that if it retests the 1.3777–1.3770 zone, buyers l might jump back in, pushing the price toward the 1.3845 target.

August 11, Forex Outlook: Key Market Expectations for the Week!Welcome back, traders!
In today’s video, we’ll be conducting a Forex Weekly Outlook, analyzing multiple currency pairs from a top-down perspective—starting from the higher timeframes and working our way down to the lower timeframes.
Pairs to focus on this Week:
USDCAD
EURGBP
EURJPY
GBPCHF
USDCHF
NZDCHF
EURNZD
Our focus will be on identifying high-probability price action scenarios using clear market structure, institutional order flow, and key confirmation levels. This detailed breakdown is designed to give you a strategic edge and help you navigate this week’s trading opportunities with confidence.
📊 What to Expect in This Video:
1. Higher timeframe trend analysis
2. Key zones of interest and potential setups
3. High-precision confirmations on lower timeframes
4. Institutional insight into where price is likely to go next
Stay tuned, take notes, and be sure to like, comment, and subscribe so you don’t miss future trading insights!
Have a great week ahead, God bless you!
The Architect 🏛️📉

USDCADI took some time to reflect on the mistakes I made in my previous trades. This game is all about learning from those missteps and I genuinely feel I’ve grown. I’ve learned the importance of being accurate and precise with my levels.So I woke up to this beautiful structure by USDCAD setup now this looks like a convincing buy to the upside


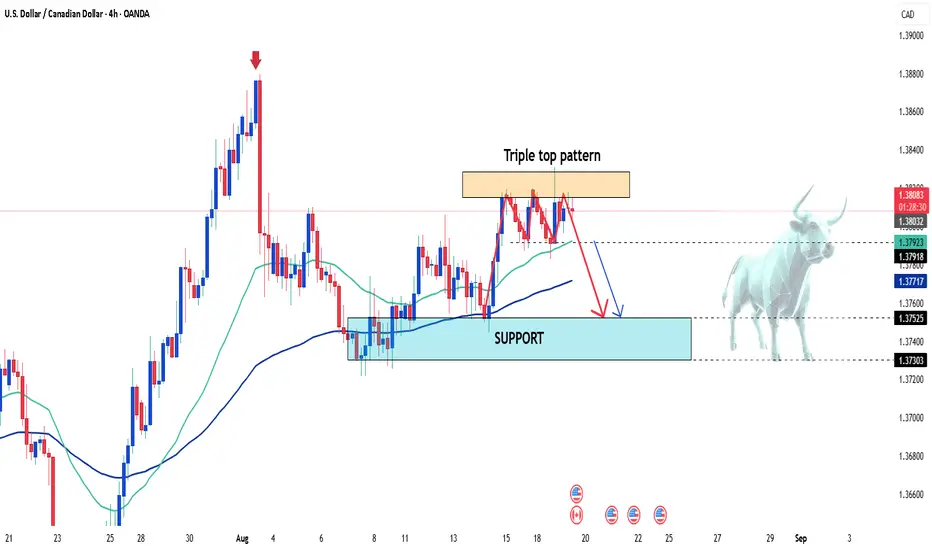
USDCAD Analysis: Triple Top Pattern and Bearish OutlookHello everyone, what do you think about OANDA:USDCAD ?
The USD/CAD pair has formed a Triple Top Pattern, indicating a potential reversal after struggling to break through recent highs. The price has failed to maintain the bullish momentum and has been rejected at key resistance levels. With the market showing signs of a downward trend, we can expect the price to continue to decline towards the support zone, a critical level to monitor.
The next key support level lies around 1.375. If the price continues to stay below the resistance, the likelihood of a drop to this level is high.
Stay alert and trade smart.
Good luck!
All eyes on USDCADIn trading, never chase the price but if there is one thing you may chase, its volatility. On Tuesday, 14:30, (Central African Time) we will see the release of the Canadian CPI for July. USDCAD will see the most volatility. Price action is suggesting a bullish move, seen from the analysis above. An inverted head and shoulders pattern can be seen on the 3hr chart whilst a bullish flag pattern forms on the 1hr chart. Let us wait for price to fall into the right shoulder before executing long.

Any optimism for the Gopher or its all the time S&Ms?USDCAD just like many of the other main pairs seems to be commemcing a new trend, is the volume strong enough for the trend to start or everything is all Smoke and Mirrors?
Possibility of uptrend The price is expected to change direction at the current resistance level and begin a downtrend. If the price can consolidate above the resistance level, a continuation of the uptrend is likely.
USDCAD (Swing/Position Long Idea)USDCAD currently appears to be setting up a great long trade for this week (and potentially beyond). Going top-down, the Monthly is playing off a major demand level (which seldomly happens on this TF so it's always significant when it does) which already has my bias shifting to longs. Additionally, if we look at the daily, we'll notice that price broke previous structure, pulled back and looks to be on it's way to make a new HH. The only TF that we need to watch is the weekly, as we are not far away from a potential weekly supply/structure point. Beyond the weekly, as we start to think about execution, if we go to the 4H TF we just broke through a previous structure point strongly, giving me further indication that longs will be the right play. For now, I am waiting for a retracement in price before it continues it's leg up. I'd be planning to hold this trade for at least the remainder of the week and depending on how price acts at the weekly, this trade may actually have the potential to hold for a year, if you have the patience for that (I probably don't but if you do Kudos).

USDCAD buyUSDCAD is slowly respect our bullish channel has the current price hit our support zone at 1.37938 looking for estimated buys.

USD/CAD BEARS WILL DOMINATE THE MARKET|SHORT
Hello, Friends!
USD/CAD pair is in the uptrend because previous week’s candle is green, while the price is evidently rising on the 8H timeframe. And after the retest of the resistance line above I believe we will see a move down towards the target below at 1.371 because the pair overbought due to its proximity to the upper BB band and a bearish correction is likely.
Disclosure: I am part of Trade Nation's Influencer program and receive a monthly fee for using their TradingView charts in my analysis.
✅LIKE AND COMMENT MY IDEAS✅
