down trend It is expected that a trend change will form in the current support range and we will witness the beginning of the upward trend. If the price breaks through the support range, the continuation of the downward trend and correction will be likely.
U.S. Dollar / Canadian Dollar
No trades
Trade ideas

USDCAD SHORTAfter a BOS on 4 h create a new HH
we wait for BOS on 1 H create a LL
After take a SELL trade on SUPPLY create on 1 H

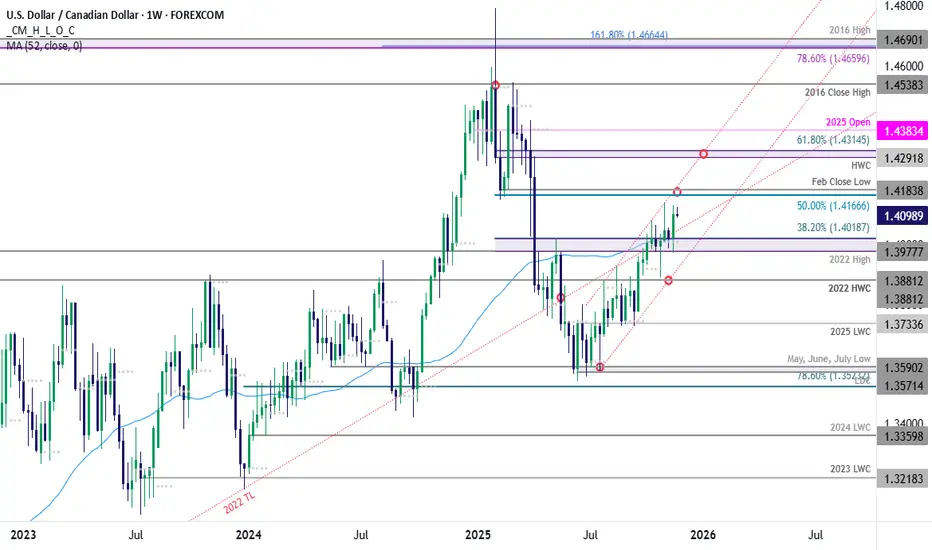
USD/CAD Rally Stalls in November Range as Breakout Risk BuildsA sharp rebound off support triggered an outside-weekly reversal from the monthly low, and focus now shifts to a breakout of last-week’s range for guidance on the next directional move.
Support remains unchanged at 1.3978-1.4019- a region defined by the 2022 swing high, the November open, The May high, the 52-week moving average and the 38.2% retracement of the yearly range. Note that the July channel line converges on this threshold next month and a break / close below would be needed to suggest a more significant high is in place and that a larger trend reversal is underway. Subsequent support seen at the 2022 high-week close (HWC) at 1.3881 and is backed by the 2025 low-week closed (LWC) at 1.3734.
A break above last week’s range exposes the next key technical hurdle at the 50% retracement of the yearly range and the February LWC at 1.4167/84. Note that the channel resistance converges on this zone into the monthly cross and a breach / close above is needed to fuel the next major of the advance. Subsequent resistance is eyed at the 2025 HWC and the 61.8% retracement at 1.4292-1.4315 and the objective yearly open at 1.4383.
Bottom line: USD/CAD has been bound within the November range, just above support. Look for a breakout of last week’s range in the days ahead for guidance. From a trading standpoint, a good zone to reduce portions of long-exposure / raise protective stops – losses should be limited to 1.3978 IF price is heading higher on this stretch with a close above 1.4183 ultimately needed to fuel the next major leg of this advance.
-MB
Sells*Break and retest of the structure on the Weekly
*Rejection from the .618 fib level, where the previous structure was broken
*Rejecting Resistance
*Created a double top on the higher time frames

SHORT ON USD/CADUSD/CAD has reached a major level or resistance and is giving us a slight change of character to the downside.
I will be selling usd/cad to the next demand zone looking to catch 100-200 pips.

Update on the watchlist analysis USDCADIt looks like the **watchlist trigger** for this pair is about to activate.
USDCAD LongMarket structure bullish on HTFs 3
Entry at Daily AOi
Weekly Rejection at AOi
Previous Weekly Structure Point
Daily Rejection at AOi
Around Psychological Level 1.40500
Touching EMA H4
H4 Candlestick rejection
TP: WHO KNOWS!
Entry 100%
REMEMBER : Trading is a Game Of Probability
: Manage Your Risk
: Be Patient
: Every Moment Is Unique
: Rinse, Wash, Repeat!
: Christ is King.

USD/CAD POSSIBLE TRIPLE TOPUSD/CAD – Triple Top Forming, Watching for Deeper Tag + Rejection
USD/CAD is currently testing the triple top area, with price just barely sneaking into the zone but not yet giving us the kind of strong push we want to see before a true reversal setup forms.
Ideally, we want to see a deeper move into the zone, followed by a clear and decisive rejection that confirms sellers are stepping in.
Momentum on the 4H is high, and we may be seeing the early stages of a divergent setup beginning to form. If this divergence completes and structure shifts, we could get a clean reversal opportunity.
What we’re waiting for:
✔ Stronger move into resistance
✔ Solid rejection candle (engulfing preferred)
✔ Momentum divergence confirmation
✔ Volume trigger on lower timeframes
No entry yet — patience is the edge here.
We wait for VMS to do its job.
Educational commentary only — not financial advice.

USDCAD, two buy setupsHello Traders,
Any conflict between Iran and Israel could drop the pair by rising OIL prices.
This is the daily chart!
there might be head and shoulders!
But it's not going to beat the geopolitical and price.

USDCAD outcome.USDCAD is near RESISTANCE and waiting for confirmation for reversal going into London session.

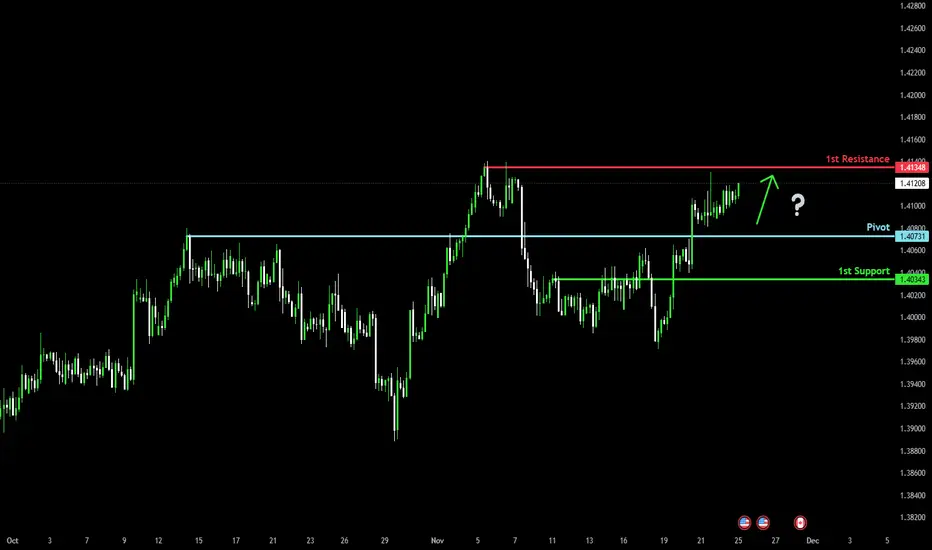
Bullish momentum to set to continue?Loonie (USD/CAD) could fall towards the pivot, which is a pullback support and could bounce to the 1st resistance.
Pivot: 1.4073
1st Support: 1.4034
1st Resistance: 1.4134
Disclaimer:
The opinions given above constitute general market commentary and do not constitute the opinion or advice of IC Markets or any form of personal or investment advice.
Any opinions, news, research, analyses, prices, other information, or links to third-party sites contained on this website are provided on an "as-is" basis, are intended to be informative only, and are not advice, a recommendation, research, a record of our trading prices, an offer of, or solicitation for, a transaction in any financial instrument and thus should not be treated as such. The information provided does not involve any specific investment objectives, financial situation, or needs of any specific person who may receive it. Please be aware that past performance is not a reliable indicator of future performance and/or results. Past performance or forward-looking scenarios based upon the reasonable beliefs of the third-party provider are not a guarantee of future performance. Actual results may differ materially from those anticipated in forward-looking or past performance statements. IC Markets makes no representation or warranty and assumes no liability as to the accuracy or completeness of the information provided, nor any loss arising from any investment based on a recommendation, forecast, or any information supplied by any third party.

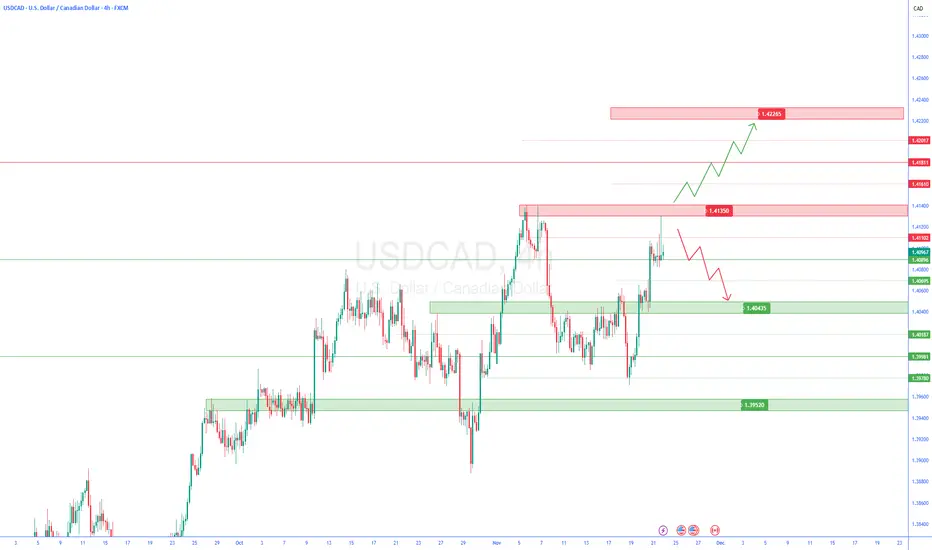
USDCAD: Bullish Momentum Strengthens Following NFP ReleaseUSDCAD: Bullish Momentum Strengthens Following NFP Release
Yesterday, after the US reported a rise in NPF data, USDCAD made a strong break through an area near 1.4060 that had held the price back for several weeks.
Comments from the FOMC minutes that they may not cut interest rates at the December meeting are increasing the chances that USDCAD will continue this bullish momentum.
The first target is expected near 1.4135 and a break above this area should push the price towards the other targets of 1.4200 and 1.4250.
You may find more details in the chart!
Thank you and Good Luck!
❤️PS: Please support with a like or comment if you find this analysis useful for your trading day❤️

USD/CAD Trade Alert🚨 USD/CAD Trade Alert 🚨
━━━━━━━━━━━━━━━━━━━
Type: 🔴 Sell
Entry: 1.41204
Take Profit (TP): 🎯 1.40427
Stop Loss (SL): ❌ 1.41571
━━━━━━━━━━━━━━━━━━━
📅 Status: Pending
💡 Market Insight:
Price sits below the entry, which keeps this setup as a pending sell. The pair shows signs of easing after its recent climb, and sellers may step in if price retests 1.41204. As long as it stays under the stop at 1.41571, the downside toward 1.40427 remains the likely path. A break above the stop would signal that buyers still control the move.

USDCAD - SHORTUSDCAD dropping from our key level.
USDCAD could not break our daily key level, and there comes the bearish pressure. Price might drop down to the 4h key level.

USDCAD 1H Bearish setupPrice is rejecting the upper volatility band and struggling to hold above the short-term EMA cluster. Market structure is showing lower highs and repeated failures at the 1.41 zone, adding to bearish confluence.
I’m looking for a downside continuation with these Fibonacci extension targets:
🔻 TP1 – 38.2%: ~1.4090
🔻 TP2 – 61.8%: ~1.4086
🔻 TP3 – 100%: ~1.4081
Stop sits above the recent rejection wick. As long as price stays under the EMA cloud and fails to reclaim 1.4105, the bearish scenario remains valid.

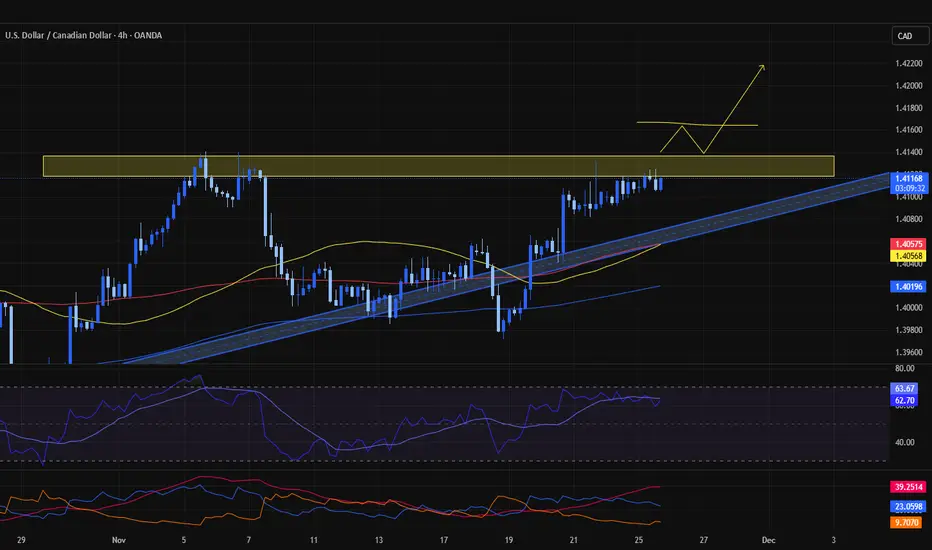
Market Analysis: USD/CAD Maintains Bullish StrengthMarket Analysis: USD/CAD Maintains Bullish Strength
USD/CAD is showing positive signs and might aim for more gains above 1.4130.
Important Takeaways for USD/CAD Analysis Today
- USD/CAD rallied above 1.4000 and 1.4050 before the bears appeared.
- There is a connecting bullish trend line forming with support at 1.4085 on the hourly chart.
USD/CAD Technical Analysis
On the hourly chart of USD/CAD, the pair formed a strong support base above the 1.3970 level. The US Dollar started a fresh increase above 1.4000 against the Canadian Dollar.
The pair cleared the 50-hour simple moving average and climbed above 1.4050. Finally, it tested the 1.4130 zone before the bears appeared. The pair traded below the 23.6% Fib retracement level of the upward move from the 1.3971 swing low to the 1.4130 high.
Initial support is near a connecting bullish trend line at 1.4085 and the 50-hour simple moving average. A downside break below the trend line might send the pair toward 1.4050.
The next major area on the USD/CAD chart could be the 76.4% Fib retracement at 1.4010. A close below 1.4010 could push the pair further lower. In the stated case, the bears might aim for a test of 1.3970.
On the upside, Initial resistance sits near 1.4105. The main breakout zone could be 1.4130. A clear upside break above 1.4130 could start another steady increase. The next major stop for the bulls might be 1.4200. Any more gains could open the doors for a test of 1.4250.
This article represents the opinion of the Companies operating under the FXOpen brand only. It is not to be construed as an offer, solicitation, or recommendation with respect to products and services provided by the Companies operating under the FXOpen brand, nor is it to be considered financial advice.

USD/CAD Closing in on Breakout! Will Bulls Take Control?🔥 USD/CAD "THE LOONIE": Bullish Breakout Play (Swing Trade Setup) | Layer Entry Strategy 🚀
TradingView Description:
🎯 TRADE IDEA: BULLISH SWING ON USD/CAD
🏆 Plan & Thesis:
The Loonie is approaching a critical juncture! 🧐 We are stalking a potential bullish breakout above the strong resistance zone at 1.41400. Our plan is to patiently wait for a confirmed breakout and momentum shift, signaling the next leg up. This is a swing trade opportunity targeting a key resistance area.
⚡ Why This Setup?
Key Resistance Break: A decisive break above 1.41400 indicates buyer strength overpowering sellers.
Trend Continuation: Aligns with the broader bullish structure on the higher timeframes.
Low-Risk, High-Reward Entry: Using the "Thief" layer strategy to optimize our average entry price.
📈 Trade Execution Details:
🎯 Entry Strategy (The "Thief" Layer Method): 🤑
We do not chase the price! We use a strategic layer of Buy Limit orders to enter on any retracement after the breakout is confirmed.
Layer 1: 1.41200
Layer 2: 1.41000
Layer 3: 1.40800
Layer 4: 1.40600
👉 You can adjust the number of layers and levels based on your capital and risk appetite.
🛑 Stop Loss (RISK MANAGEMENT):
A consolidated stop loss is placed below all entry layers at 1.40400.
⚠️ Disclaimer: This is MY stop loss. Please adjust your position size and SL based on YOUR personal risk management strategy. Protect your capital!
🎯 Take Profit Target:
Our primary profit target is set at 1.42100, a zone of strong historical resistance where we anticipate a pullback or overbought conditions.
💡 Pro Tip: Consider taking partial profits on the way up and moving your stop loss to breakeven to secure risk-free trades!
🌐 Market Context & Correlated Pairs to Watch:
Understanding correlations is key to validating this thesis! Keep an eye on these:
OANDA:USDCAD & PEPPERSTONE:USDX (DXY): 👑 DIRECT CORRELATION. A stronger US Dollar Index typically boosts USD/CAD. Watch for DXY strength to confirm our bullish bias.
OANDA:USDCAD & GETTEX:WTIC (Crude Oil): 👑 INVERSE CORRELATION. Canada is a major oil exporter. If Oil prices fall, CAD often weakens, pushing USD/CAD higher (bullish for our trade).
FX:EURUSD & FX:GBPUSD : These major pairs often move inversely to the USD. If they are falling, it can signal broad USD strength, supporting our USD/CAD long.
✅ Key Takeaways:
✅ Wait for a confirmed breakout and close above 1.41400.
✅ Execute entries using the layer method for best average price.
✅ MANAGE YOUR RISK! This is not financial advice. Your risk, your rules.
✅ Watch correlated pairs ( TVC:DXY , TVC:XAU , GETTEX:WTIC ) for confluence.
👑 Let's get this bread, traders! If you found this idea helpful, please give it a LIKE 👍, SHARE it with a fellow trader, and FOLLOW me for more high-quality setups! Your support helps the community grow! 💬 Drop a comment below with your thoughts!


Weekly FOREX Forecast: USDCAD, USDCHF & USDJPY Are Bullish!Welcome to Part 2 of The Weekly FOREX FORECAST!
Part 1 covered USD, EU, GU, AU, NU in the previous video.
In this video, we will analyze the following FX markets:
USD Index, USDCAD, USDCHF, and USDJPY.
Enjoy!
May profits be upon you.
Leave any questions or comments in the comment section.
I appreciate any feedback from my viewers!
Like and/or subscribe if you want more accurate analysis.
Thank you so much!
Disclaimer:
I do not provide personal investment advice and I am not a qualified licensed investment advisor.
All information found here, including any ideas, opinions, views, predictions, forecasts, commentaries, suggestions, expressed or implied herein, are for informational, entertainment or educational purposes only and should not be construed as personal investment advice. While the information provided is believed to be accurate, it may include errors or inaccuracies.
I will not and cannot be held liable for any actions you take as a result of anything you read here.
Conduct your own due diligence, or consult a licensed financial advisor or broker before making any and all investment decisions. Any investments, trades, speculations, or decisions made on the basis of any information found on this channel, expressed or implied herein, are committed at your own risk, financial or otherwise.

USD CAD LongTake a fib level (of sorts)
And looking for price to test those moving averages.
2:1 RRR

Bullish bounce off?Loonie (USD/CAD) has bounced off the pivot and could potentially rise to the 78.6% Fibonacci resistance.
Pivot: 1.3976
1st Support: 1.3865
1st Resistance: 1.4308
Disclaimer:
The opinions given above constitute general market commentary and do not constitute the opinion or advice of IC Markets or any form of personal or investment advice.
Any opinions, news, research, analyses, prices, other information, or links to third-party sites contained on this website are provided on an "as-is" basis, are intended to be informative only, and are not advice, a recommendation, research, a record of our trading prices, an offer of, or solicitation for, a transaction in any financial instrument and thus should not be treated as such. The information provided does not involve any specific investment objectives, financial situation, or needs of any specific person who may receive it. Please be aware that past performance is not a reliable indicator of future performance and/or results. Past performance or forward-looking scenarios based upon the reasonable beliefs of the third-party provider are not a guarantee of future performance. Actual results may differ materially from those anticipated in forward-looking or past performance statements. IC Markets makes no representation or warranty and assumes no liability as to the accuracy or completeness of the information provided, nor any loss arising from any investment based on a recommendation, forecast, or any information supplied by any third party.

usdcad 4h🔹 Overall Outlook and Potential Price Movements
In the charts above, we have outlined the overall outlook and possible price movement paths.
As shown, each analysis highlights a key support or resistance zone near the current market price. The market’s reaction to these zones — whether a breakout or rejection — will likely determine the next direction of the price toward the specified levels.
⚠️ Important Note:
The purpose of these trading perspectives is to identify key upcoming price levels and assess potential market reactions. The provided analyses are not trading signals in any way.
✅ Recommendation for Use:
To make effective use of these analyses, it is advised to manually draw the marked zones on your chart. Then, on the 15-minute time frame, monitor the candlestick behavior and look for valid entry triggers before making any trading decisions.