Bullish bounce off?USD/CAD has bounced off the support leve which is a pullback support that lines up with the 50% Fibonacci retracement and could potentially rise from this leve to our take profit.
Entry: 1.3815
Why we like it:
There is a pullback support that lines up with the 50% Fibonacci retracement.
Stop loss: 1.3752
Why we like it:
There is a pullback support that is slightly below the 78.6% Fibonacci retracement.
Take profit: 1.3917
Why we like it:
There is a swing high resistance.
Enjoying your TradingView experience? Review us!
Please be advised that the information presented on TradingView is provided to Vantage (‘Vantage Global Limited’, ‘we’) by a third-party provider (‘Everest Fortune Group’). Please be reminded that you are solely responsible for the trading decisions on your account. There is a very high degree of risk involved in trading. Any information and/or content is intended entirely for research, educational and informational purposes only and does not constitute investment or consultation advice or investment strategy. The information is not tailored to the investment needs of any specific person and therefore does not involve a consideration of any of the investment objectives, financial situation or needs of any viewer that may receive it. Kindly also note that past performance is not a reliable indicator of future results. Actual results may differ materially from those anticipated in forward-looking or past performance statements. We assume no liability as to the accuracy or completeness of any of the information and/or content provided herein and the Company cannot be held responsible for any omission, mistake nor for any loss or damage including without limitation to any loss of profit which may arise from reliance on any information supplied by Everest Fortune Group.
USDCAD trade ideas

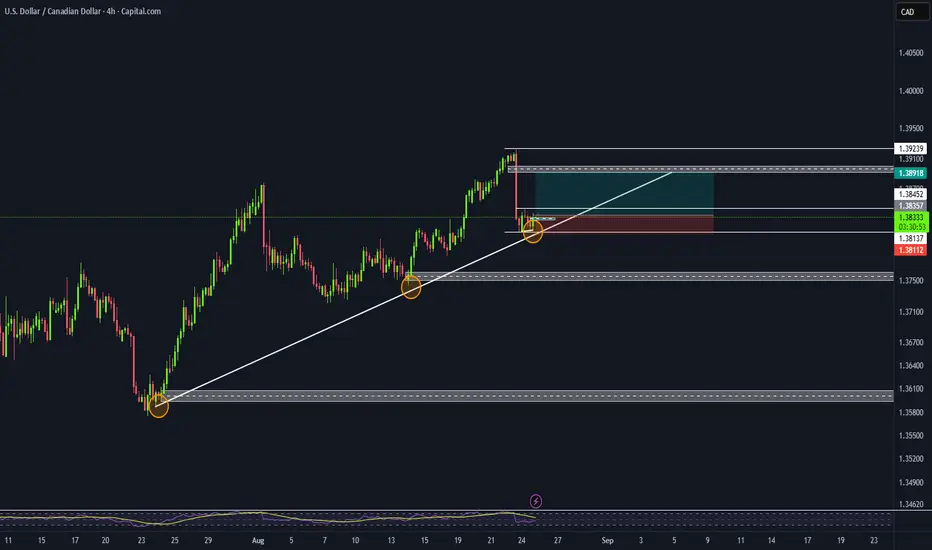
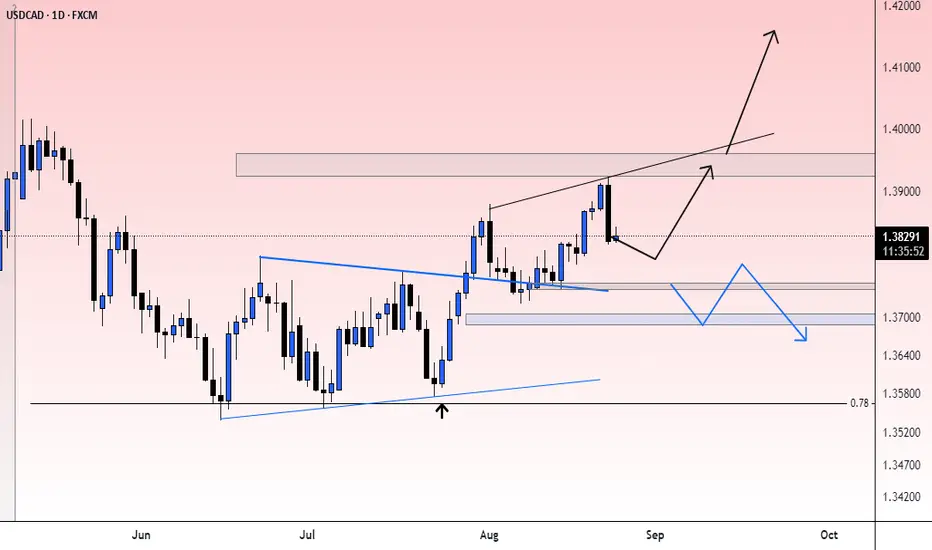
USDCADLong oppotunity
- creating HH and LLs
- overall upwards trend
- 3 touch point on bullish trendline
- tp and Point of intrest zone
- SL below demand zone
USDCAD - Bullish Trend - Hidden DivergenceFX:USDCAD has been in a bullish trend, passing through major rsistances on Daily timeframes.
Currently, price is in a bullish trend and formed a hidden diveregence. This development indicates imminent bullish continuation!

USD/CAD Trading Idea: Short from 1.3914 Volume ClusterUSD/CAD shows a strong resistance at 1.3914, formed after Powell’s speech triggered a sharp sell-off. Volume Profile highlights a heavy volume cluster at this level, marking the origin of aggressive selling. This is a classic Volume Accumulation Setup: wait for a pullback, then enter short. A bearish Fair Value Gap also starts at 1.3914, confirming strong seller presence.

USDCAD Heading Towards Important Resistance D1✏️The old USDCAD analysis strategy was correct when the uptrend returned to the pair. 1.399 is the target of BUY signals when this zone accumulates a lot of selling momentum. The Breakout zone of 1.375 is considered a strong support zone forming a wide price range of the pair. The trading strategy is focused on the two resistance and support zones above.
📉 Key Levels
BUY trigger Strong support zone 1.375
SELL trigger Strong resistance zone 1.399
Leave your comments on the idea. I am happy to read your views.

check the trend It is expected that after the amount of correction and fluctuation, a trend change will be formed and the start of an upward trend to the resistance area will be formed.
If the price crosses the support area, a continuation of the downward
USDCAD Will Go Higher! Long!
Here is our detailed technical review for USDCAD.
Time Frame: 9h
Current Trend: Bullish
Sentiment: Oversold (based on 7-period RSI)
Forecast: Bullish
The market is on a crucial zone of demand 1.383.
The oversold market condition in a combination with key structure gives us a relatively strong bullish signal with goal 1.392 level.
P.S
We determine oversold/overbought condition with RSI indicator.
When it drops below 30 - the market is considered to be oversold.
When it bounces above 70 - the market is considered to be overbought.
Disclosure: I am part of Trade Nation's Influencer program and receive a monthly fee for using their TradingView charts in my analysis.
Like and subscribe and comment my ideas if you enjoy them!

USDCAD: Pullback Continues 🇺🇸🇨🇦
There is a high chance that USDCAD will recover
after a formation of a huge FVG on Friday.
As a confirmation, I see a bullish Change of Character
on an hourly time frame.
Goal - 1.385
❤️Please, support my work with like, thank you!❤️
I am part of Trade Nation's Influencer program and receive a monthly fee for using their TradingView charts in my analysis.

25.08.25 Morning ForecastPairs on Watch -
FX:USDCAD
FX:EURAUD
FX:AUDJPY
A short overview of the instruments I am looking at for today, multi-timeframe analysis down to what I will be looking at for an entry. Enjoy!

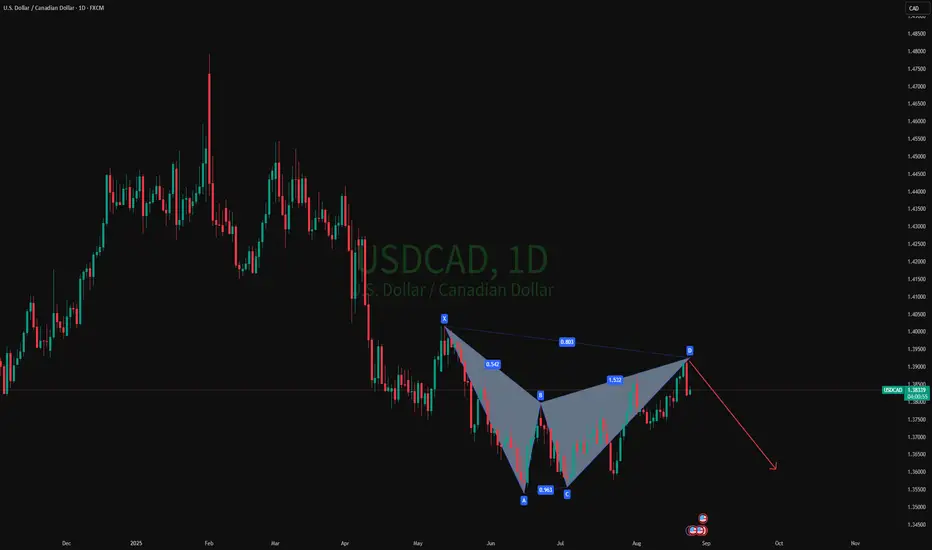
Technical Analysis: USDCAD Maintains Bearish PostureTechnical Analysis: USDCAD Maintains Bearish Posture
The USDCAD currency pair is currently exhibiting a definitive bearish trend structure, signaling a period of sustained selling pressure and a prevailing downtrend. This technical landscape is characterized by a clear and consistent pattern of price action, where each successive peak (lower high) fails to exceed the previous one, and each subsequent trough (lower low) breaks beneath the last. This serial deterioration in price is the very definition of a bearish trend, indicating that sellers are in firm control and are consistently overwhelming any attempts by buyers to mount a significant recovery.
The recent price action has provided a potent confirmation of this underlying weakness. The formation of a distinct bearish engulfing candle on the daily chart is a particularly telling technical signal. This candlestick pattern occurs when a period of tentative buying (a small bullish or green candle) is completely overwhelmed by a surge of selling in the next session (a large bearish or red candle), where the entire range of the previous day's price action is "engulfed." This pattern is widely interpreted as a sharp shift in momentum, demonstrating a decisive increase in selling pressure and often marking the resumption of the primary downtrend after a brief pause or pullback.
Given the confluence of the established bearish trend structure and the recent bearish engulfing candlestick, the expectation is for the USDCAD pair to remain under pressure in the upcoming trading sessions. The path of least resistance appears firmly to the downside.
Key Levels to Watch:
Downside Target: The immediate bearish objective is projected towards the 1.35800 handle. This level represents a significant technical target and a potential profit-taking zone for sellers. A decisive break below this support could open the door for a further extension of the decline.
Upside Resistance: Any near-term attempts at a bullish correction are likely to face formidable selling pressure around the 1.40200 level. This zone now acts as a key resistance barrier, a ceiling that would need to be convincingly broken to signal any potential invalidation of the current bearish outlook. For the downtrend to remain intact, the sequence of lower highs must continue, making this resistance a critical level for traders to monitor.
In summary, the technical evidence strongly favors a continuation of the sell-off, with a defined target and a clear level that would be required to challenge the prevailing bearish narrative.

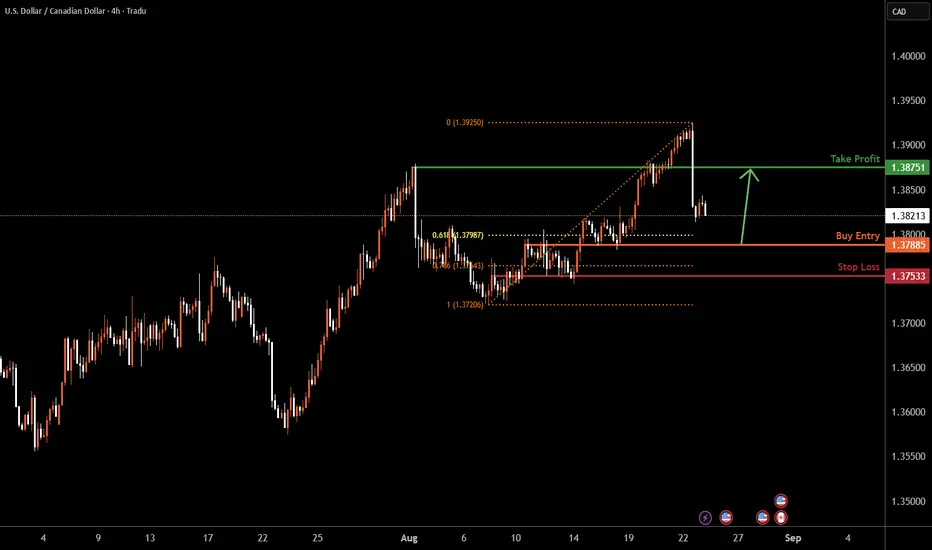
USDCAD H4 | Falling towards overlap supportUSD/CAD is falling towards the buy entry which is an overlap support that is slightly below the 61.8% Fibonacci retracement and could bounce from this level to the upside.
Buy entry is at 1.3788, which is an overlap support that is slightly below the 61.8% Fibonacci retracement.
Stop loss is at 1.3753, which is a pullback support that is slightly below the 78.6% Fibonacci retracement.
Take profit is at 1.3875, which is a pullback resistance.
High Risk Investment Warning
Trading Forex/CFDs on margin carries a high level of risk and may not be suitable for all investors. Leverage can work against you.
Stratos Markets Limited (tradu.com ):
CFDs are complex instruments and come with a high risk of losing money rapidly due to leverage. 65% of retail investor accounts lose money when trading CFDs with this provider. You should consider whether you understand how CFDs work and whether you can afford to take the high risk of losing your money.
Stratos Europe Ltd (tradu.com ):
CFDs are complex instruments and come with a high risk of losing money rapidly due to leverage. 66% of retail investor accounts lose money when trading CFDs with this provider. You should consider whether you understand how CFDs work and whether you can afford to take the high risk of losing your money.
Stratos Global LLC (tradu.com ):
Losses can exceed deposits.
Please be advised that the information presented on TradingView is provided to Tradu (‘Company’, ‘we’) by a third-party provider (‘TFA Global Pte Ltd’). Please be reminded that you are solely responsible for the trading decisions on your account. There is a very high degree of risk involved in trading. Any information and/or content is intended entirely for research, educational and informational purposes only and does not constitute investment or consultation advice or investment strategy. The information is not tailored to the investment needs of any specific person and therefore does not involve a consideration of any of the investment objectives, financial situation or needs of any viewer that may receive it. Kindly also note that past performance is not a reliable indicator of future results. Actual results may differ materially from those anticipated in forward-looking or past performance statements. We assume no liability as to the accuracy or completeness of any of the information and/or content provided herein and the Company cannot be held responsible for any omission, mistake nor for any loss or damage including without limitation to any loss of profit which may arise from reliance on any information supplied by TFA Global Pte Ltd.
The speaker(s) is neither an employee, agent nor representative of Tradu and is therefore acting independently. The opinions given are their own, constitute general market commentary, and do not constitute the opinion or advice of Tradu or any form of personal or investment advice. Tradu neither endorses nor guarantees offerings of third
LONG ON USD/CADUSD/CAD is in a Major Demand Zone and has rejected it nicely.
I will be buying USD/CAD looking for price to reach the previous high for about 100 pips.

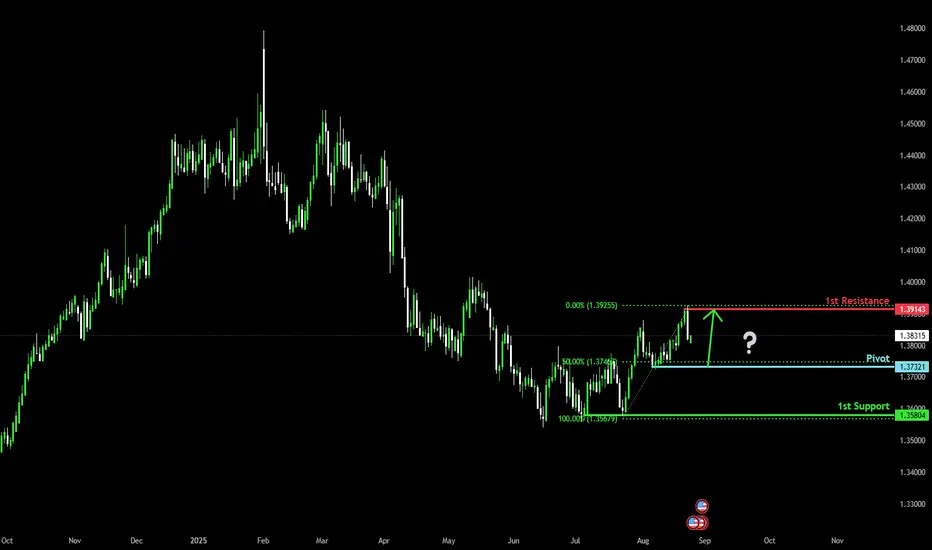
Bullish bounce off 50% Fibonacci support?The Loonie (USD/CAD) is falling towards the pivot, which acts as a pullback support that lines up with the 50% Fibonacci retracement and could bounce to the 1st resistance.
Pivot: 1.3732
1st Support: 1.3580
1st Resistance: 1.3914
Risk Warning:
Trading Forex and CFDs carries a high level of risk to your capital and you should only trade with money you can afford to lose. Trading Forex and CFDs may not be suitable for all investors, so please ensure that you fully understand the risks involved and seek independent advice if necessary.
Disclaimer:
The above opinions given constitute general market commentary, and do not constitute the opinion or advice of IC Markets or any form of personal or investment advice.
Any opinions, news, research, analyses, prices, other information, or links to third-party sites contained on this website are provided on an "as-is" basis, are intended only to be informative, is not an advice nor a recommendation, nor research, or a record of our trading prices, or an offer of, or solicitation for a transaction in any financial instrument and thus should not be treated as such. The information provided does not involve any specific investment objectives, financial situation and needs of any specific person who may receive it. Please be aware, that past performance is not a reliable indicator of future performance and/or results. Past Performance or Forward-looking scenarios based upon the reasonable beliefs of the third-party provider are not a guarantee of future performance. Actual results may differ materially from those anticipated in forward-looking or past performance statements. IC Markets makes no representation or warranty and assumes no liability as to the accuracy or completeness of the information provided, nor any loss arising from any investment based on a recommendation, forecast or any information supplied by any third-party.
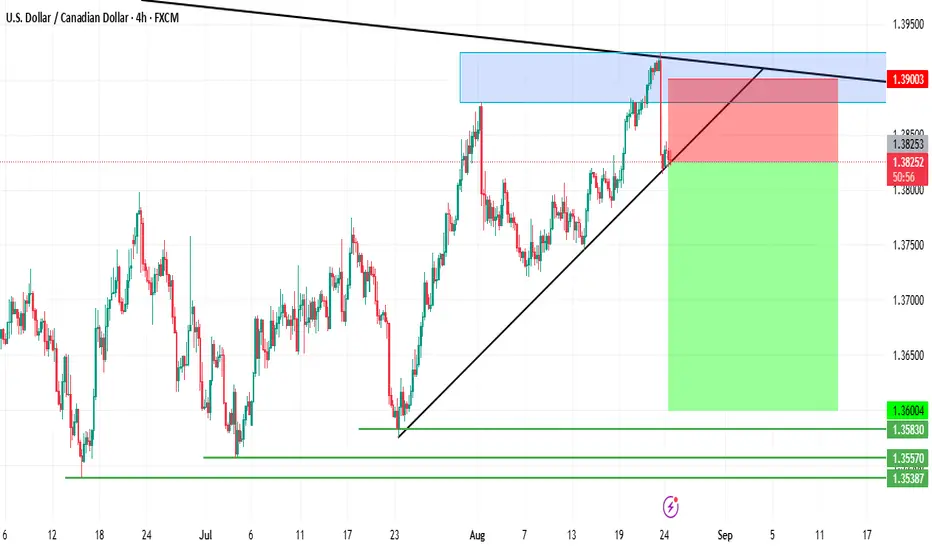
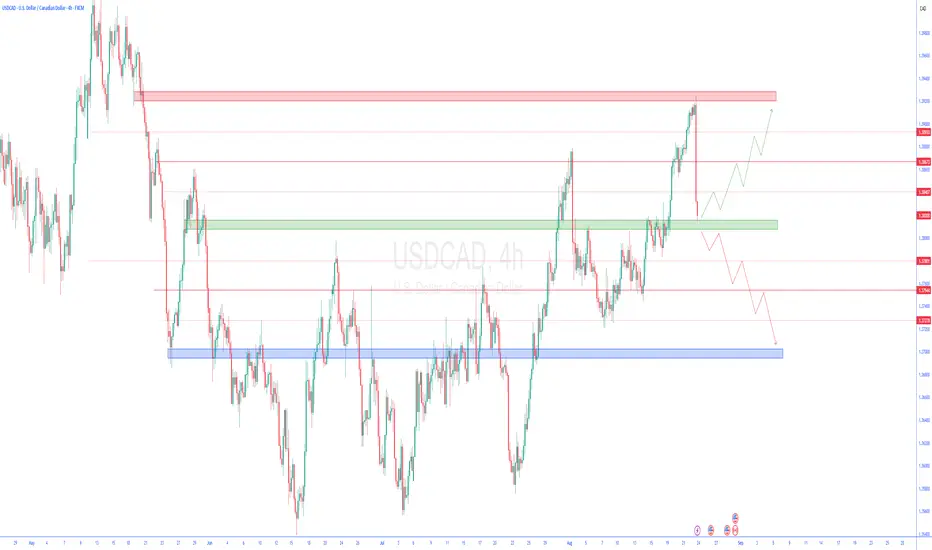
USDCAD Analysis 25-08-2025 to 29-05-2025Chart Breakdown
Key Price Levels:
Label Price Description
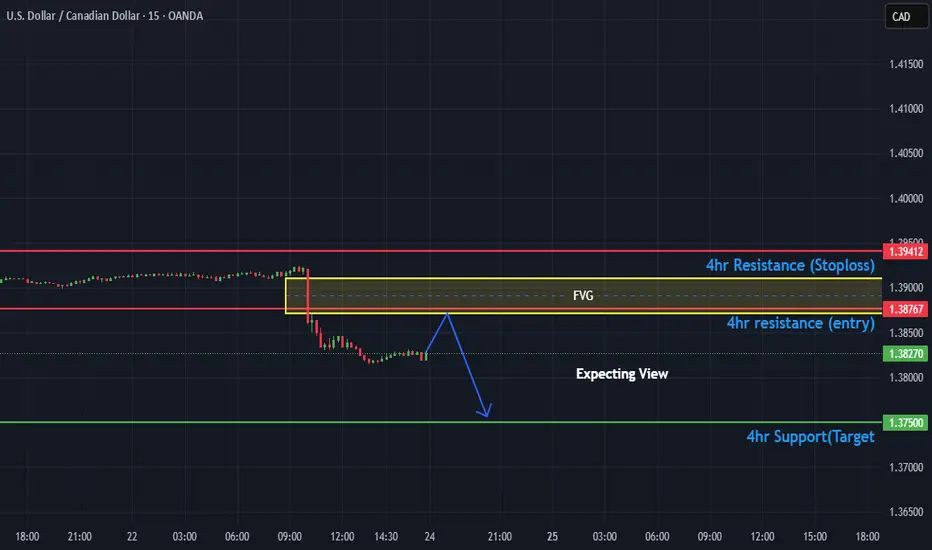
Current Price 1.38270 Live market price at the time of chart
4Hr Resistance (Entry) 1.38767 Short entry zone inside FVG
4Hr Resistance (Stoploss) 1.39412 Invalidates bearish idea if broken
4Hr Support (Target) 1.37500 Bearish target / take profit
Fair Value Gap (FVG): Marked between 1.38767 – ~1.39000
FVG is a zone of imbalance caused by an impulsive bearish move.
Market is expected to fill the gap, then reject from it.
Expecting View (Blue Arrow Path):
Price retraces upward into the FVG (entry zone).
Hits resistance at or near 1.38767.
Drops to the next major support at 1.37500.
Trade Plan (Bearish Setup):
Entry Zone: 1.38767 (inside FVG / resistance)
Stop Loss: 1.39412 (above FVG & key resistance)
Target: 1.37500 (4Hr support level)
Risk-Reward Estimation:
Metric Value
Entry 1.38767
Stop Loss 1.39412 (~65 pips)
Target 1.37500 (~127 pips)
Strengths of the Analysis:
FVG + Resistance Confluence:
Entry zone overlaps with an inefficiency zone and 4H resistance, providing a strong technical ceiling.
Logical Trade Structure:
Clear entry, stop, and target — perfect for risk-managed trading.
Momentum-Backed Setup:
Recent strong bearish momentum supports the retracement-and-drop scenario.
Short-Term Confirmation:
Bearish trend structure is intact, with lower highs and lower lows on this timeframe.
USDCAD| - BullishHTF (4H/1H) Overview:
Price has shown strong bullish structure with clear momentum to the upside. This sets the stage for potential continuation plays into the week.
MTF (30M) Setup:
Price swept the SSL and landed within the internal framework structure of the area. Waiting for lower timeframe confirmation to ensure the spot holds before committing.
Entry:
After the lower high (LH) break and price retests back into the zone.
Targets:
• 5M highs for aggressive targets
• 30M highs for a more conservative approach depending on market delivery
Mindset Note:
Patience is key here. Let the lower timeframe structure confirm before taking the trade. Following the plan ensures alignment with smart money flow.

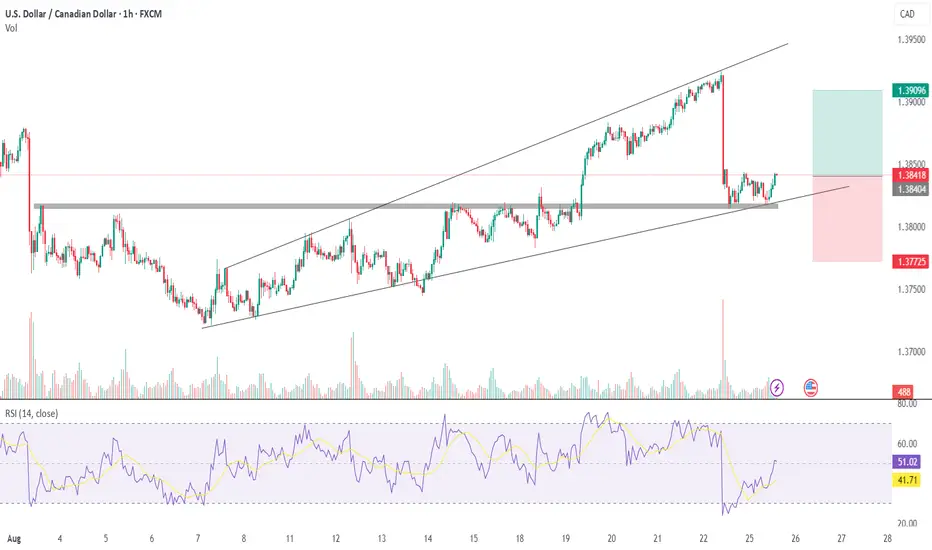
USD/CAD: The Perfect Storm for a Bullish BreakoutUSD/CAD is consolidating above 1.3850 after a strong bullish impulse. The technical structure shows:
A breakout from the summer bullish channel projecting towards 1.3950–1.4050, a key weekly resistance zone.
RSI remains neutral but strengthening, with no signs of immediate overextension.
Institutional demand around 1.3700 firmly rejected the downside, signaling strong long accumulation.
📌 Key levels: Support at 1.3750 / 1.3700 – Resistance at 1.3950 / 1.4050.
Commitments of Traders (COT)
USD Index: Non-commercial longs increasing (+1,330) with a slight reduction in shorts. Moderately bullish bias for USD.
CAD Futures: Significant increase in non-commercial shorts (+7,966) while longs decline (-2,691). Institutions are clearly selling CAD.
📌 This reinforces the bullish bias on USD/CAD, with speculative positioning strongly in favor of the US Dollar.
Seasonality (August–September)
Historically, August tends to be neutral/slightly bearish for USD/CAD, but September shows a strong bullish pattern, with consistent positive averages over the last 10–20 years.
📌 This supports a continuation of the bullish trend in the coming weeks, especially towards the 1.40+ area.
Retail Sentiment
78% of retail traders are short on USD/CAD, with an average entry price at 1.3780.
Only 22% are positioned long.
📌 Classic contrarian signal: excessive retail bearishness increases the probability of further upside.
✅ Trading Outlook
The overall picture shows alignment across technicals, COT, seasonality, and sentiment. USD/CAD maintains a bullish bias:
Primary scenario: Extension towards 1.3950 and then 1.4050, a major weekly supply zone.
Alternative scenario: Controlled pullback to 1.3800–1.3750 before resuming higher.
Invalidation: Daily close below 1.3700 would open space towards 1.3550.
📌 Bias: Long USD/CAD towards 1.3950–1.4050.

usdcad 4hIn this series of analyses, we have reviewed trading perspectives and short-term outlooks.
As can be seen, in each analysis there is a key support/resistance zone close to the current asset price, and the market’s reaction or breakout at this level will determine the next price trend toward the specified targets.
Important note: The purpose of these trading perspectives is to highlight significant levels ahead of the price and potential market reactions to these levels. The provided analyses are by no means trading signals!
USDCAD 3D | Market OutlookPotential for a bullish pullback on the USDCAD 3D which could lead to a price movement towards the resistance level at 1.42200. BUY levels from 1.37400

USDCAD TRADE SETUPWait for retest the entry level then take a trade for Buy otherwise skip this setup

USD_CAD BULLISH REBOUND AHEAD|LONG|
✅USD_CAD fell down sharply
But a strong support level was hit at 1.3820
Thus as a rebound is already happening
A move up towards the target of 1.3840 shall follow
LONG🚀
✅Like and subscribe to never miss a new idea!✅
