USDCAD future Outcome.USDCAD broke the zone it was Ranging in, and then broke the TendLine before the markets closed on Friday. Upon market open we will see if it will push back UP or BreakOut of channels to retesting and DROP.
Trade ideas

USDCAD potential roadmapUSDCAD. the up swing seems to have ended as w2. look for entry to downside (w3)

Canadian dollar plummets to the lowest levelBREAKING: Canadian dollar plummets to the lowest level against the U.S. dollar since 2003

USD/CAD| Bullish Structure & Extreme OB ZonesBias: Bullish
4H Overview:
• High timeframe structure is bullish — price breaking significant highs.
• Move is very obvious — even “kindergarten” can see the trend direction.
30M–5M Refinement:
• Midterm structure mapped and refined.
• All possible order blocks marked.
• Deeper, darker orange OB: extreme OB for key entries.
• Looking for price to tap 50% equilibrium within these zones.
Lower Timeframe Focus:
• Lower timeframe confirmation will validate entries and any additional structure.
• Until then, stay patient — let smart money guide price.
Mindset Note:
Patience + structure alignment is everything — no forcing trades, wait for clean confirmation.

USDCAD shortsUSDCAD - distribution
I think this pair is due for quite a steep pullback, and I'm seeing a lot of liquidity beginning to form.
It will be an interesting one to watch for next week, as both currencies are weak.

USDCAD: Bullish Continuation is Expected! Here is Why:
It is essential that we apply multitimeframe technical analysis and there is no better example of why that is the case than the current USDCAD chart which, if analyzed properly, clearly points in the upward direction.
Disclosure: I am part of Trade Nation's Influencer program and receive a monthly fee for using their TradingView charts in my analysis.
❤️ Please, support our work with like & comment! ❤️

USD/CAD Trade Alert Week: 43, 2025🚨 USD/CAD Trade Alert 🚨
━━━━━━━━━━━━━━━━━━━
Type: 🟢 Buy Limit
Entry: 1.39948
Take Profit (TP): 🎯 1.40769
Stop Loss (SL): ❌ 1.39591
━━━━━━━━━━━━━━━━━━━
📅 Signal Time: 20 Oct 2025
📅 Week: 43, 2025
📈 Status: Pending Activation
💡 Analysis: Price is hovering near a level where buyers have recently stepped in. A reaction here may confirm an uptrend continuation, but if buying pressure fails, the trend could reverse.

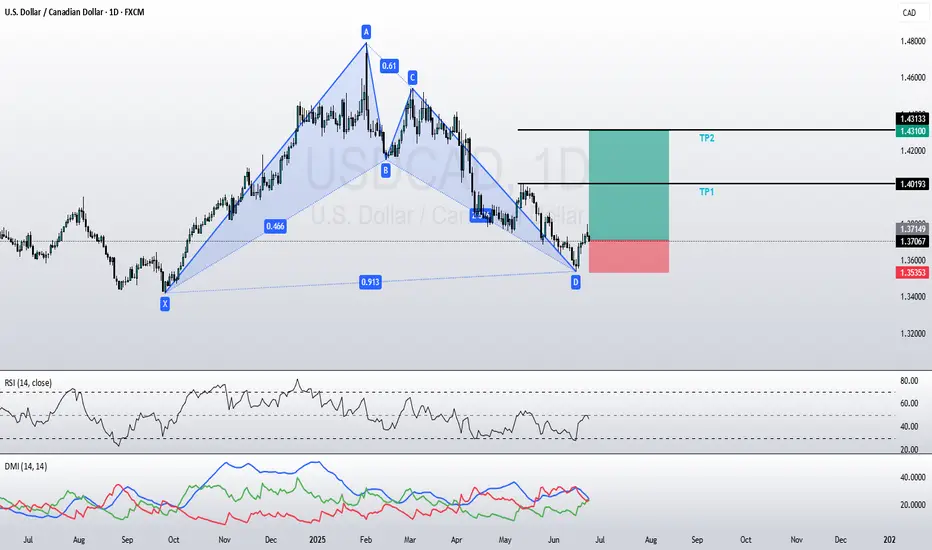
USDCAD BUYThe Bullish BAT pattern on the USD/CAD daily chart is structurally valid based on strict harmonic criteria. Although point D is slightly extended (91% vs. 88.6%), the confluence of Fibonacci levels and price reaction justifies a potential buying opportunity with favorable risk-reward.
USD/CAD Trade Alert🚨 USD/CAD Trade Alert 🚨
━━━━━━━━━━━━━━━━━━━
Type: 🔴 Sell Limit
Entry: 1.40120
Take Profit (TP): 🎯 1.39360
Stop Loss (SL): ❌ 1.40382
━━━━━━━━━━━━━━━━━━━
📅 Signal Time: 10 Oct 2025
📈 Status: Pending Activation
💡 Analysis: Price is currently below the entry level. Expecting a retracement toward the entry before sellers dominate, which could indicate the start of a bearish movement.

USDCAD What Next? BUY!
My dear friends,
My technical analysis for USDCAD is below:
The market is trading on 1.4030 pivot level.
Bias - Bullish
Technical Indicators: Both Super Trend & Pivot HL indicate a highly probable Bullish continuation.
Target - 1.4040
Recommended Stop Loss - 1.4025
About Used Indicators:
A pivot point is a technical analysis indicator, or calculations, used to determine the overall trend of the market over different time frames.
Disclosure: I am part of Trade Nation's Influencer program and receive a monthly fee for using their TradingView charts in my analysis.
———————————
WISH YOU ALL LUCK

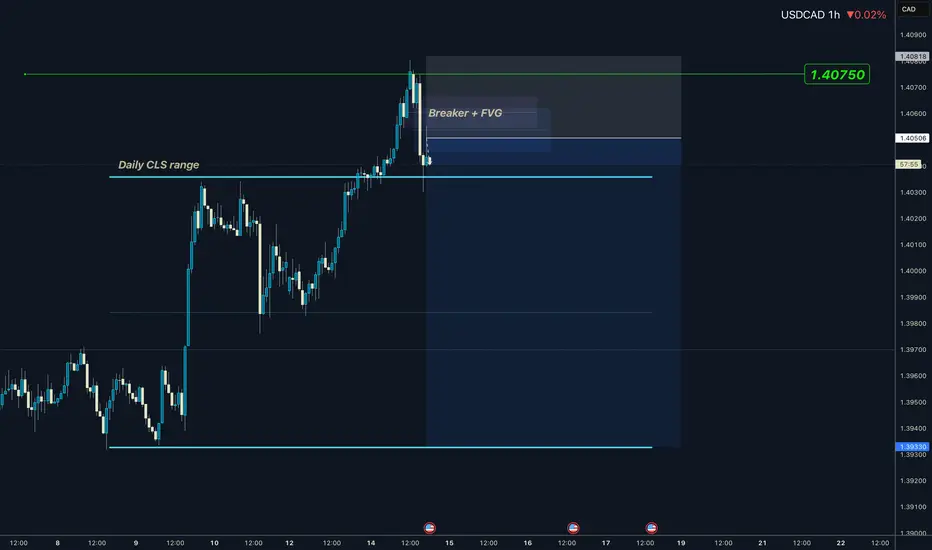
USDCAD I Daily CLS Range I Model 1 I Stop Hunt Hi friends, new range created. As always we are looking for the manipulation in to the key level around the range. Don't forget confirmation switch from manipulation phase to the distribution phase to make the setup valid. Stay patient and enter only after change in order flow. If price reaches 50% of the range take partial or full close.
📌 HTF - Higher Timeframe view
🧩 Complete proces and Strategy explained 👇 Click Below
🎯 Why your market approach also should be mechanical ?
NO Fixed Mechanical Trading Logic - You are guessing random patterns
NO Defined trading plan - Every trade different logic
NO Same logic in each trade - Not possible to backtest
NO Backtests on at least 300 trades - Not knowing Statistics
➡️ No Statistics ➡️ No Edge ➡️ Mindset ProblemS
🧠 Core of mindset problems
If you don't know your statistics on large enough data sample. You don't know your probabilities of win rate once the losing streak happen and it happens to every strategy. You will start doubting, hesitating to take next trade because you don't know statistics of your losses. In the end you will be doubting strategy and then jump to different one. You will be in the endless loop for years, looking for new better strategy. 👊 Your ultimate goal as a trader is not to be a generalist who knows 10 000 patterns. But rather create one system with narrowed criteria of each element of the trade to remove subjective and emotional decisions as much as possible and stick to this system no matter what. Practice it 10 000 times become a MASTER.
✨ Trading Mastery is reflection of your life
Have a longterm plan, No Alcohol & Drugs, Ignore others, Focus on your journey , Backtest regularly, Review your weeks, Journal mistakes, Exercise, Sleep well, Read books, Walks in nature (no phone) , Meditate, Reduce social media time, Spend time with family, Live Life.
Trading is hard, but not impossible. I believe in you 💪
David Perk aka Dave Fx Hunter
USD/CAD 1H Technical & Fundamental AnalysisUSD/CAD 1H Technical & Fundamental Analysis
The Canadian Dollar has weakened over the past month, with USD/CAD gaining around +1.85%.
Recently, the pair broke above 1.4027, a key resistance level now acting as major support — signaling strong bullish momentum.
📊 Fundamentals:
Canada’s economy remains heavily linked to oil and commodity prices. Any weakness in global demand or decline in oil value tends to weaken CAD, keeping USD strength intact.
📈 Technical View:
We observed sell-side liquidity taken below the key level before price pushed higher.
Our current area of interest sits around 1.40490, expecting bullish continuation while price holds above support.
🎯 Trade Setup:
Entry: 1.40490
Stop Loss: 1.40340
Take Profit: 1.40800
As long as USD/CAD stays above 1.4027, the bullish bias remains valid on the 1-hour timeframe.
⚠️ Disclaimer:
This analysis is provided for educational and informational purposes only and does not constitute financial advice. Trading involves risk, and past performance does not guarantee future results. Always conduct your own research and manage your risk appropriately.

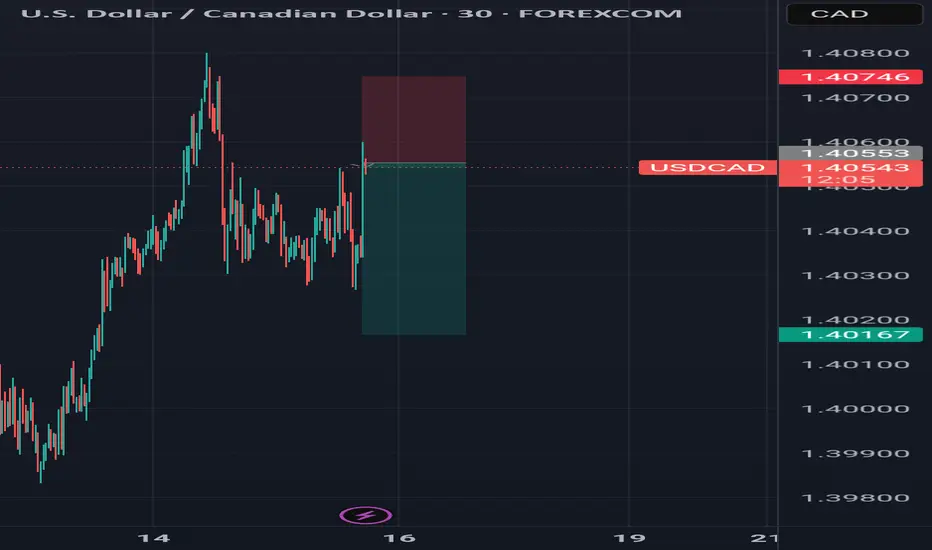
USDCAD M30 | Bearish Drop In PlayUSD/CAD has rejected off the sell entry, which is a multi swing high resistance, and could drop from this level to the 61.8% Fibonacci support.
Sell entry is at 1.4056, which is a multi-swing high resistance.
Stop loss is at 1.4076, which is a swing high resistance.
Take profit is at 1.4016, which is a pullback support that lines up with the 61.8% Fibonacci retracement.
High Risk Investment Warning
Trading Forex/CFDs on margin carries a high level of risk and may not be suitable for all investors. Leverage can work against you.
Stratos Markets Limited (tradu.com ):
CFDs are complex instruments and come with a high risk of losing money rapidly due to leverage. 65% of retail investor accounts lose money when trading CFDs with this provider. You should consider whether you understand how CFDs work and whether you can afford to take the high risk of losing your money.
Stratos Europe Ltd (tradu.com ):
CFDs are complex instruments and come with a high risk of losing money rapidly due to leverage. 66% of retail investor accounts lose money when trading CFDs with this provider. You should consider whether you understand how CFDs work and whether you can afford to take the high risk of losing your money.
Stratos Global LLC (tradu.com ):
Losses can exceed deposits.
Please be advised that the information presented on TradingView is provided to Tradu (‘Company’, ‘we’) by a third-party provider (‘TFA Global Pte Ltd’). Please be reminded that you are solely responsible for the trading decisions on your account. There is a very high degree of risk involved in trading. Any information and/or content is intended entirely for research, educational and informational purposes only and does not constitute investment or consultation advice or investment strategy. The information is not tailored to the investment needs of any specific person and therefore does not involve a consideration of any of the investment objectives, financial situation or needs of any viewer that may receive it. Kindly also note that past performance is not a reliable indicator of future results. Actual results may differ materially from those anticipated in forward-looking or past performance statements. We assume no liability as to the accuracy or completeness of any of the information and/or content provided herein and the Company cannot be held responsible for any omission, mistake nor for any loss or damage including without limitation to any loss of profit which may arise from reliance on any information supplied by TFA Global Pte Ltd.
The speaker(s) is neither an employee, agent nor representative of Tradu and is therefore acting independently. The opinions given are their own, constitute general market commentary, and do not constitute the opinion or advice of Tradu or any form of personal or investment advice. Tradu neither endorses nor guarantees offerings of third-party speakers, nor is Tradu responsible for the content, veracity or opinions of third-party speakers, presenters or participants.

USD/CAD Bullish Bias Supported by COT Data and Seasonal Trends🗓 Monthly Chart Overview
• Price Inefficiency Zone: There's a clear imbalance between 1.40165 and 1.41248, suggesting a potential magnet for price. A retracement to at least the 50% level of this inefficiency could be expected.
• Bullish Structure: Price has formed a bullish order block and is currently retracing, which often precedes a continuation move upward.
• This setup hints at accumulation before a bullish expansion.
📆 Weekly Chart Insights
• Inefficiency Filled: Price has filled previous inefficiencies, showing healthy market structure.
• Liquidity Behavior: We've seen price sweep lows, then begin sweeping highs, while respecting bullish blocks—a strong indication of a shift in directional intent.
• This behavior supports the idea that USD/CAD is preparing for a bullish continuation.
📅 Daily Chart Momentum
• Aggressive Breakout: After a period of consolidation, price broke out aggressively to the upside, confirming bullish momentum.
• Structure: The daily chart maintains a bullish structure, reinforcing the higher timeframe bias.
💹 Commitment of Traders (COT) Data
• USD Positioning: The U.S. Dollar is showing net buying interest, supporting strength.
• CAD Positioning: The Canadian Dollar is net bearish on average when compared to last year’s data.
• This divergence in sentiment adds confluence to a bullish USD/CAD bias.
📊 Seasonal Trends
• Historically, USD/CAD tends to rise from August through November, with September, October, and especially November being the most bullish months.
• This seasonal tendency aligns with the current technical and fundamental setup.
🏦 Macro Considerations
• Interest Rates: Keep a close eye on central bank rate decisions and forward guidance, as they can significantly impact USD/CAD volatility and direction.
🔍 Summary
USD/CAD shows strong bullish potential across monthly, weekly, and daily timeframes. Technical structure, COT data, and seasonal trends all point toward a continuation to the upside. A revisit to the inefficiency zone around 1.4060–1.4120 could be a key target in the coming months.

Buy USDCADUSDCAD will move higher during New York session. A bullish flag can be seen on the 4hr chart. Expect aggressive buying pressure from the breakout level.

USDCAD sideways consolidationThe USDCAD remains in a bullish trend, with recent price action indicating a potential breakout rally within the broader uptrend.
Support Zone: 1.4013 – a key level from previous consolidation. Price is currently testing or approaching this level.
A bullish rebound from 1.4013 would confirm ongoing upside momentum, with potential targets at:
1.4093 – initial resistance
1.4122 – psychological and structural level
1.4150 – extended resistance on the longer-term chart
Bearish Scenario:
A confirmed break and daily close below 1.4013 would weaken the bullish outlook and suggest deeper downside risk toward:
1.3990 – minor support
1.3970 – stronger support and potential demand zone
Outlook:
Bullish bias remains intact while the USDCAD holds above 1.4013. A sustained break below this level could shift momentum to the downside in the short term.
This communication is for informational purposes only and should not be viewed as any form of recommendation as to a particular course of action or as investment advice. It is not intended as an offer or solicitation for the purchase or sale of any financial instrument or as an official confirmation of any transaction. Opinions, estimates and assumptions expressed herein are made as of the date of this communication and are subject to change without notice. This communication has been prepared based upon information, including market prices, data and other information, believed to be reliable; however, Trade Nation does not warrant its completeness or accuracy. All market prices and market data contained in or attached to this communication are indicative and subject to change without notice.

USD-CAD Will Keep Growing! Buy!
b]Hello,Traders!
USDCAD is holding firmly above the horizontal demand area, showing bullish SMC structure and continuation potential. A retest of the demand zone could attract more buyers toward the 1.4100$ target. Time Frame 6H.
Buy!
Comment and subscribe to help us grow!
Check out other forecasts below too!
Disclosure: I am part of Trade Nation's Influencer program and receive a monthly fee for using their TradingView charts in my analysis.

USD/CAD Falling Wedge Here we have a potential falling wedge formation. we have seen 4 touches on our formation and just waiting for the break and retest to confirm the bullish move.

USDCAD BUY PROJECTION As we can price is in a uptrend z and price keep coming back to the breaker block on the trendline and I expect price to go long , it might consolidate towards the line before going long. No confirmation no entry please. Zoom down to the lower time frame for entry

#USDCAD: Two Major Buying Zones, Patience Pays! As previously analysed, USDCAD is expected to decline towards our predetermined entry point. We anticipate a bearish US Dollar for the remainder of the week, which will ultimately lead USDCAD to reach the entry zone. Three distinct target areas exist, collectively worth over 1100 pips. Each entry point, stop loss, and take profit is clearly defined.
We wish you the best of luck and safe trading.
Thank you for your support.
If you wish to assist us, we encourage you to consider the following actions:
- Like our ideas
- Provide comments on our ideas
- Share our ideas
Kind Regards,
Team Setupsfx_
Much Love ❤️🚀

#USDCAD: 1000+ Pips Big Bullish Move With Three TargetsThe USDCAD is currently in a bearish trend since the day has dropped significantly and is still falling. We anticipate the price to drop slightly more before it reaches our entry zone. There are two entry points, and you can choose either one that aligns with your views. There are three targets, and you can set take profit targets that suit you best.
Good luck and trade safely.
Thanks for your support! 😊
If you want to help us out, here are a few things you can do:
- Like our ideas
- Comment on our ideas
- Share our ideas
Team Setupsfx_
❤️🚀

Short usdcad Sell usdcad using 4hr candle high as stop loss. Entry was around the fair value gap of that 4hr candle
#USDCAD: +400 PIPS Possible Buying Opportunity! USDCAD currently trading at a critical level and we think we expect price to start distributing to another high and take price to 1.45 or beyond that level. This idea possibly will give us a great to risk to reward ratio trade. Please do your own research and manage your risk always.
Team Setupsfx_!
