US Dollar/Chinese Yuan
No trades
Market insights

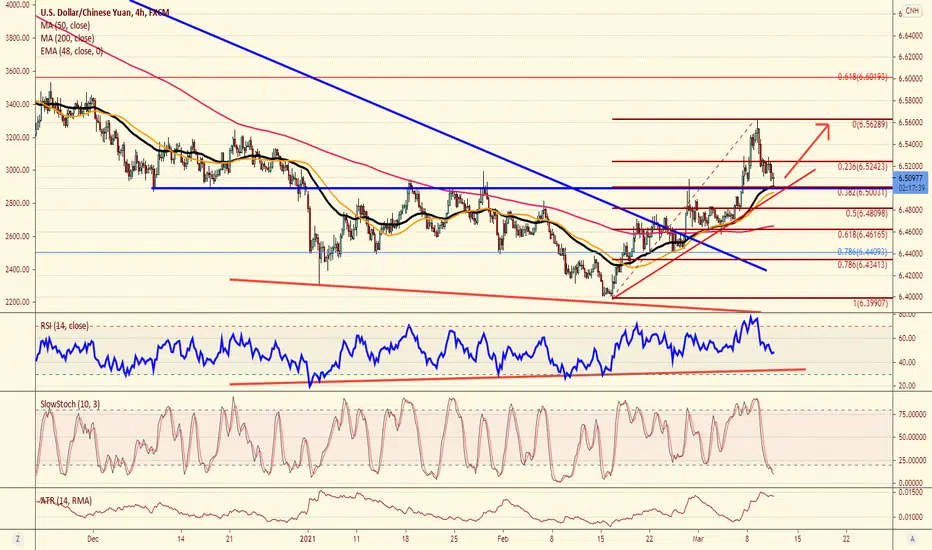
USDCNH Potential bullish scenarioUSDCNH price is trading above the (demand zone) and the price is supported by the dynamic trendline.
Also, it seems to be nearing the end of an intermediate bullish impulse wave.
The waves one, two, three and four completed, we can now expect the final leg to finalize wave 5.
Buy after break up of key level
All the details on the chart
Good luck.


Irrational behavior: Fleeing winnersI do not know if one is born a trader but I know one can be born NEVER a trader. Those that have these bugs in their programming that make them do things that make absolutely no sense, there is no point even trying, they are set to fail from the start.
I think learning about your own tender feelings is totally useless, if you have these tender feelings I am pretty sure you'll never make it no matter how many excuses how throw at reality, which is yet another irrational thing to do and so silly to expect it to make a difference 🤷♂️.
But learning about other people tender feelings is certainly interesting.
Running winners is variable the ultimate objective is not to be a robot. And the variable might be increasing right now which is a reason for me to write this little piece.
First of all I think this period of the year is more lively than the winter, but also notice the pattern americans are following:
"In the first round of economic impact payments, households set aside 29% of their checks for consumption. In the second round, that fell to 26%, and in the most recent round fell to 25%."
The S&P 500 broke out of the Donald Trump trade war broadening wedge. It remained above, kept going up, now even broke 4000 and bears are getting slaughtered, skeptics are slowly being convinced it won't crash like 2008. You know the saying "1 by 1".
Americans fear is diminishing, unless it's just they have no choice, I think their fear is reducing, and they are spending more willingly, gambling some of it on meme stocks.
We saw the Yen do this thing it sometimes does. Lots of money is being printed, activity around the world is growing.
I think we can expect big trends, Forex was creating depressions with how bad and tight it had gotten. Finally!
Trying to run winners for kilometers in a calm market is stupid, but not as stupid and running away from winners like they are Michael Myers.
Nobody makes money being a (redacted: kitty-cat). The whole idea is to catch big winners. It's the whole point of the markets. They trend.
The idea is that when the market has a big move in a direction you sometimes catch it, and when it has a big move against you you NEVER catch it.
Why would markets even exist? Why would anyone ever need to hedge? It's so stupid I can't believe it.
Hedgers = avoid market exposure, avoid all moves. Speculators = take the risk from hedgers, want market exposure. Noobs = Only want market exposure when they lose?????
Imagine this, get in the mind of losing traders:
You sell, the price goes down, and down, and then there is a pullback with a perfect double top or whatever you like and would normally sell every day of the week.
But BECAUSE YOU ARE WINNING YOU DON'T? Lol?
And then to "go faster" they go take huge positions that destroy them, and get into day gambling and so on.
These lose-loving bagholders are the reason why Bitcoin only bottomed AFTER they capitulated in March 2020 when (and weeks after) the price collapsed 60% in a few hours.
Gamblers addicting to losing were constantly selling the instant Bitcoin went up and buying heavy bags as it went down which leads to more selling pressure (after a buyer buys, he becomes a potential seller).
Once all the - most of them - quick quick gambling bagholders got wiped out, there was no more run-away-from-winner losers preventing Bitcoin from going up.
I have been buying US indices since October and I have no intention to stop. If I have urges to "play" like day gamblers do, I'd much rather buy a bit more of S&P.
Does not have to be much. 10 bucks turbos with a 2-10% KO (so 100-500 bucks worth of S&P) every day is objectively smarter than day gambling every day on it with a few hundred bucks.
If it keeps going you can turn a small account into a small fortune. At some point just have to be careful the risk is limited and the exposure does not become insane. Can always sell and then buy back. Say you had a call, close it and buy a new larger one. Just to make sure if it goes 1987 or 6 may 2010 all these gains are not lost but this is not the same as just exiting and that's it, you're still under exposure to that winner, just making sure risk is limited, and profit is not.
As it keeps going these profits can snowball into something so monstruous not even kidding. Start with an initial 50 bucks risk end up with a 150,000 euros win dead serious.
Meanwhile some ****** idiot made 30 bucks as soon as it went up. And felt good about it. Good job man!
On Bitcoin the noobiest of them all, you can see bagholders breakeven at areas where they previously bought.
No one gets greedy and just wants to keep piling in into winners and bulldoze their way up?

USDCNH ANALYSISUSDCNH rebounded from major uptrendline
MACD shows start of bullish momentum
we r waiting price to exceed key level at 6.5560 to open long trade
It's expected to target level 6.6000

USDCNH Strong momentum to the upside, target 6.67I'm bullish on USDCNH for a while. Chinese Renminbi was strong last year due to the quick recovery from covid-19 crisis. Now it's the U.S. turn as more American people got vaccinated.
Not mention the investors' projection of rate hike to contain inflation.
Previously, I mentioned in my published idea that I'm concerned on CSI300 and Hang Seng index. The rising exchange rate of USDCNH will hurt the stock markets. I will eye on the uprising speed.
To be a qualified trader or investor, you got have your trading/investment framework which required standardized process to help us make informed trading/investment decisions. I'd like to explore the cause-effect relations between different assets or underlying. That will enhance my winning ratio and have a peaceful mind.
Enjoy your trade and give me a like and follow if you think my idea is useful.


USD/CNH Upwards Scenario!The pair could resume its growth if it jumps and stabilizes above the 23.6% retracement level!


USDCNH LONG+ At monthly candle chart we have 0.764 Fibonacci retracement level. This is good for buy signal.
+ Previous week candle was bullish. This is good for buy signal.
+ At daily candle timeframe market show us bullish signals at 1 hour timeframe.
Idea is wait for one hour candle timeframe closing at the highest point and go with the crowd forward.

USDCNH BUY AFTER RETRACEMENTI'm expecting a buy from support zone on this pair. I will potentially take sells to the support then buy long term.

BEARISH CALL This is my bearish trend idea, now during bearish flag you can see it .Wait for clear breakout to downtrend after you can entry, because the overall bearish trend . Only in my opinion.

usdcnh buy limit at 6.51513 tp 6.53367 sl 6.50481usdcnh buy limit at 6.51513 tp @ 6.53367 sl @ 6.50481

BEARISH CALL this is my bearish trend idea. how ever wait for clear trend continue moment and wait for trend continue after can entry .this is my opinion not for any signal service .good luck.

USDCNH A Great Selling Opportunity
Trade Proposal:
There is a probability of first tp to the proposed ( 6.45257 ) Direction line. So, Traders can set orders based on Price Action and expect to reach short-term goals.
Technical analysis:
USDCNH is in Downtrend and It is Expected to Continue Downtrend.

BEARISH CALL This is my bearish trend idea. However wait for a fall back to a key level after trend continue to downtrend momentum, because overall structure breakout and continue to downtrend. You can see it high time frame momentum. Good luck

USDCNH Bearish (March 10)Tight SL will be helpful.
Less risk, more profit
SL: 6.50950
TP: 6.47744
R/R: 1:2.33
This is for educational analysis, not for a direct trade signal.
When you check the chart, please check the resistance line and heavy support line.
This is the last analysis for today.
Hope it supports everyone for trading.
Have a great day guys!

USDCNH at supportUSDCNH hit some key support today and looks like as long as we are above the 6.5000 level (38% retracement) we should head higher.
BEARISH CALL This is my bearish trend idea, now during bearish flag you can see it .Wait for clear breakout to downtrend after you can entry, because the overall bearish trend . Only in my opinion.

USD CNH SELL (US DOLLAR - CHINESE YUAN)Hi there.
Price is forming a continuation pattern to the downside. Watch strong price action at the current levels for sell.

USDCNH uptrend continues after key level penetrated!First of all , my previous idea regarding USDCNH is right. Now, the momentum to the upside is strong with key zone penetrated.
Secondly , after 11% drop since May of last year, 5% rebound is likely to happen(50% fibonacciretracement).
Thirdly, the pair might got issues around 6.67 which happens to be the Flip level.
It is not good news for Chinese assets, e.g. HK stocks, mainland stocks. The hiking US 10Y yield along with a stronger dollar and uprising crude oil price will weigh on the emerging market assets. Outflows might occur and further drop is expected around the corner.
Things aren't bad if we already have expectations for what might happen! Cycles all the time! After the correction, funds will come back given the strong economy growth of China in 2021 and 2022.

USDCNH - LONG; BUY it up!!This is very likely a one-way move (up) here - as all previous examples would illustrate.
Most importantly, this is one of (if not "The") most lopsided FX (and debt, and credit, etc.) positioning currently on the entire Globe! (Everyone and everything is currently Net Short the Dollar vs. the Yuan!)
Ergo, as this move gets going (up) it is only likely to gain considerable speed.

USDCNH is likely to go up after consolidation on dailyWeekly: After a 10% drop, a bullish engulfing candle is formed. This week is key, technically, if weekly candle is not a big bearish candle, then it might be at the very beginning of big rally!
Daily: First time to test my mid-term MA and try to close above it since July of last year. Now, It's approaching control high area which is the key.
Basically, Chinese stock market has performed very well last year due to economic growth and better-than-expected recovery from Covid-19. A lot of foreign investors has entered mainland market.
If dollar goes against CNH, I think it'll weigh on Chinese related assets, e.g. HK stock market. Outflow may occur under such circumstances.
Now, exchange rate still moves in the range area, once the range gets broken, a big rally for USD is expected around the corner against the backdrop of optimistic economic outlook of U.S.
