EUR/USD Asia liquidityOn the lower time frame we swept asia low and created a mss to the upside after doing so. Targeting Asia high we caught just under a 1:2RR.
USDEUR trade ideas

Steel, Copper & Gold: How Metals Shape the World EconomyPart I: The Historical Significance of Metals
1. Steel – From Iron Age to Industrial Age
Steel is essentially an alloy of iron and carbon, but its strength, flexibility, and affordability made it the single most important material of industrialization. The Iron Age (1200 BCE onwards) marked the beginning of metal-based economies, but it was the Bessemer process in the 19th century that revolutionized mass steel production.
Railways, bridges, and mechanized factories in Europe and the U.S. became possible because of steel.
Steel transformed warfare too, with stronger weapons, tanks, and ships.
By the 20th century, steel became synonymous with industrial power — countries with steel plants were considered modern and competitive.
2. Copper – The First Metal of Civilization
Copper has been used for over 10,000 years. Early civilizations like Mesopotamia and Egypt valued copper for tools, ornaments, and trade. The Bronze Age (3300–1200 BCE) began when humans mixed copper with tin to create bronze, a much stronger alloy that reshaped weapons, farming tools, and art.
In modern times, copper’s true value emerged with electrification. When Edison’s light bulb lit up cities in the late 19th century, copper wiring carried electricity to homes and industries. Today, no city, smartphone, or solar panel can function without copper.
3. Gold – The Eternal Store of Value
Gold has fascinated humankind for millennia. Ancient Egyptians called it the “flesh of the gods.” Unlike steel or copper, gold’s significance is less industrial and more financial, cultural, and symbolic.
Ancient empires minted gold coins as currency.
The Gold Standard of the 19th and 20th centuries tied currencies to gold reserves, stabilizing global trade.
Today, central banks hold gold as reserves to secure financial stability.
In times of crisis, investors flock to gold as a safe haven, making it a “crisis commodity.”
Thus, while steel built industries and copper electrified societies, gold secured economies through trust and value.
Part II: Metals in the Modern Global Economy
1. Steel – The Industrial Backbone
Modern steelmaking revolves around blast furnaces and electric arc furnaces. The top steel producers today are China, India, Japan, the U.S., and Russia.
Steel consumption directly reflects economic growth:
When countries urbanize, steel demand spikes.
China’s meteoric rise after 2000 was fueled by massive steel consumption in real estate, infrastructure, and manufacturing.
India, as of the 2020s, is following a similar path, with steel demand tied to roads, housing, and railways.
Global Trade:
Steel is traded as finished products (like rolled sheets, pipes) and raw material (iron ore).
The iron ore–steel connection links mining in Australia and Brazil to steel mills in China and India.
2. Copper – The Wiring of Globalization
Copper is indispensable for electricity, transport, and electronics. With the rise of renewable energy and electric vehicles (EVs), copper demand has surged:
An electric car uses nearly 4x more copper than a conventional car.
Solar and wind farms need miles of copper cabling to connect to grids.
Data centers and 5G networks run on copper infrastructure.
Major Producers: Chile, Peru, China, and the Democratic Republic of Congo dominate global copper production. The trade network connects South America’s mines with smelters and industries in Asia, particularly China.
3. Gold – A Monetary Anchor
Gold’s role in the modern economy is very different from steel or copper:
Central banks (like the U.S. Federal Reserve, the European Central Bank, and the Reserve Bank of India) hold gold as part of their foreign exchange reserves.
Investment demand (ETFs, bullion, jewelry) drives gold prices.
In geopolitics, gold is a hedge against sanctions or currency collapse. For example, Russia increased gold reserves heavily after 2014 to reduce dependence on the U.S. dollar.
Gold’s global demand is divided into three parts:
Jewelry (especially in India, China, and the Middle East).
Investment (bars, coins, ETFs).
Central bank reserves.
Part III: Price Dynamics & Market Behavior
1. Steel Market Cycles
Steel prices depend on construction, auto manufacturing, and global growth. Prices crash during recessions (e.g., 2008, 2020 pandemic) and rise during recovery or infrastructure booms. Trade wars, tariffs, and overcapacity (especially from China) often distort global steel trade.
2. Copper – The “Doctor Copper” Indicator
Copper is famously called “Doctor Copper” because its prices reflect the health of the world economy.
When industries expand, copper demand rises, pushing prices up.
A slowdown in construction, manufacturing, or electronics drags copper prices down.
For instance, the copper price boom of 2003–2011 reflected China’s growth, while the slump of 2014–2016 signaled slowing global demand.
3. Gold – The Crisis Barometer
Gold prices often move opposite to risk assets:
During crises (financial crashes, wars, pandemics), gold rises as investors seek safety.
When economies stabilize, gold prices dip as money flows back into stocks and bonds.
For example, gold surged above $2,000/oz during the COVID-19 crisis and during geopolitical tensions in 2022–23.
Part IV: Geopolitical & Strategic Importance
1. Steel – A Weapon of Trade & Security
Nations often protect their steel industries through tariffs and subsidies, seeing it as a matter of national security. A country without steel plants risks dependence on imports for defense, infrastructure, and industrialization.
2. Copper – The New Oil of the Green Era
As the world transitions to clean energy, copper is being compared to “the new oil.” Whoever controls copper mines and supply chains will dominate renewable energy and EV industries. This has made regions like Latin America and Africa strategic hotspots for global powers.
3. Gold – The Silent Power of Reserves
Gold allows countries to reduce reliance on the U.S. dollar. The BRICS nations (Brazil, Russia, India, China, South Africa) have steadily increased gold holdings, signaling a shift in global financial power.
Part V: The Future of Metals
1. Steel – Towards Green Steel
The steel industry is one of the largest emitters of CO₂. With climate change pressures, countries are investing in green steel (produced using hydrogen instead of coal). Europe, Japan, and India are testing pilot projects that could transform steel into a low-carbon industry.
2. Copper – Supply Crunch Ahead
The International Energy Agency (IEA) warns of a possible copper shortage by 2030, as demand from EVs and renewable energy outpaces supply. This could lead to new mining projects, recycling innovations, and geopolitical competition.
3. Gold – Digital Age Relevance
While Bitcoin and digital assets challenge gold as a “store of value,” gold remains unmatched in stability and trust. In fact, central banks are buying more gold, suggesting it will remain critical in global finance for decades.
Conclusion
Steel, copper, and gold are more than just metals; they are pillars of the global economy.
Steel builds our cities, cars, and industries.
Copper powers our homes, gadgets, and future green technologies.
Gold protects our wealth and anchors global finance.
Each metal has a unique story — steel as the backbone of industrialization, copper as the lifeline of electrification, and gold as the eternal symbol of value. Together, they reflect the intersection of economics, technology, and geopolitics.
As the 21st century unfolds, these three metals will continue shaping the destiny of nations, guiding industrial revolutions, and influencing financial systems. The world economy, in many ways, is still forged, wired, and secured by steel, copper, and gold.

EUR/USD | Buyers Active – Short-Term SetupEUR/USD | Buyers Active – Short-Term Setup
Price is reacting from the buyer’s zone around 1.18339 – 1.18412. As long as buyers hold this level, we may see a push toward 1.18514 supply zone.
Buyers Zone: 1.18339 – 1.18412
Resistance/Supply: 1.18514
Watching price action closely for confirmation before continuation.
📊 Timeframe: 15M
⚡ Analysis: Smart Money / Supply-Demand Zones
💡 Idea: Possible bullish continuation unless buyers fail.

EURUSD: Bearish Forecast & Outlook
The price of EURUSD will most likely collapse soon enough, due to the supply beginning to exceed demand which we can see by looking at the chart of the pair.
Disclosure: I am part of Trade Nation's Influencer program and receive a monthly fee for using their TradingView charts in my analysis.
❤️ Please, support our work with like & comment! ❤️

Retesting yestesterday's breakout We are at the fibonacci golden zone for retacement. look for reversal pattern and entering here. Wider stoploss is due to several imbalances depending on NEWTYORK impulse

EURUSD 12.09.2025+ ECB held rates and was still pretty confident in the economic resilience + higher inflation expectations in the EU
+ US CPI (in-line, with MoM a slight beat) yesterday hasn't changed the dovish narrative around the Fed
+ EURUSD is seasonally strong until Sep 22

Climate Change & Carbon TradingPart I: Understanding Climate Change
1. The Science of Climate Change
Climate change refers to long-term shifts in temperatures and weather patterns, largely caused by human-induced greenhouse gas emissions. The main GHGs include:
Carbon dioxide (CO₂): from burning fossil fuels (coal, oil, gas) and deforestation.
Methane (CH₄): from agriculture (especially livestock), landfills, and fossil fuel extraction.
Nitrous oxide (N₂O): from fertilizers and industrial processes.
Fluorinated gases: synthetic gases from industrial and refrigeration processes.
The Earth’s average temperature has already risen by over 1.2°C since pre-industrial times, and the IPCC warns that exceeding 1.5°C will trigger catastrophic and irreversible impacts.
2. Impacts of Climate Change
Extreme Weather: More frequent hurricanes, droughts, heatwaves, and floods.
Rising Seas: Melting polar ice and thermal expansion threaten coastal communities.
Biodiversity Loss: Ecosystems struggle to adapt to rapid changes.
Agriculture: Crop failures and food insecurity increase.
Economic Damage: Billions lost annually in disaster recovery and adaptation.
Human Health: Heat stress, spread of diseases, and air pollution-related illnesses.
3. Global Climate Agreements
Recognizing the urgency, countries have come together to negotiate climate treaties:
1992: UN Framework Convention on Climate Change (UNFCCC) – set the stage for global cooperation.
1997: Kyoto Protocol – introduced binding emission reduction targets and created the first carbon trading systems.
2015: Paris Agreement – nearly 200 countries pledged to limit warming to “well below 2°C” and ideally to 1.5°C.
Carbon trading emerged out of these international negotiations as a way to reduce emissions efficiently and cost-effectively.
Part II: The Concept of Carbon Trading
1. What is Carbon Trading?
Carbon trading is a market-based mechanism to control pollution by providing economic incentives for reducing emissions. It works by setting a limit (cap) on the total amount of greenhouse gases that can be emitted. Companies or countries receive emission allowances under this cap, and these allowances can be traded.
In simple terms:
If a company emits less than its allowance, it can sell its surplus credits.
If a company emits more than its allowance, it must buy credits or face penalties.
This creates a financial value for carbon reductions, encouraging innovation and efficiency.
2. Types of Carbon Trading
(a) Cap-and-Trade Systems
A central authority sets a cap on emissions.
Companies receive or buy allowances.
Trading occurs in a regulated market.
Example: European Union Emissions Trading System (EU ETS).
(b) Carbon Offsetting / Voluntary Markets
Organizations or individuals invest in projects that reduce or absorb emissions (like reforestation, renewable energy).
Credits are generated from these projects and sold in voluntary markets.
Popular among corporations aiming for “carbon neutrality.”
3. Carbon Credits & Carbon Allowances
Carbon Credit: A certificate representing one metric ton of CO₂ reduced or removed.
Carbon Allowance: A permit under a regulatory cap-and-trade scheme, allowing the holder to emit one ton of CO₂.
Part III: Evolution of Carbon Trading
1. The Kyoto Protocol and Early Systems
The Kyoto Protocol (1997) introduced three mechanisms:
International Emissions Trading (IET): Countries with surplus emission units could sell them to others.
Clean Development Mechanism (CDM): Allowed industrialized countries to invest in emission-reduction projects in developing countries.
Joint Implementation (JI): Similar projects between developed countries.
This created the foundation of the global carbon market.
2. European Union Emissions Trading System (EU ETS)
Launched in 2005, EU ETS remains the largest carbon trading scheme in the world. It covers power plants, industry, and aviation within Europe. It works in phases, gradually tightening emission caps and increasing the cost of carbon allowances.
3. Other Carbon Markets
Regional Greenhouse Gas Initiative (RGGI) in the U.S.
California Cap-and-Trade Program.
China’s National ETS (2021): now the world’s largest by coverage.
India & South Korea exploring voluntary and compliance-based systems.
Part IV: Benefits of Carbon Trading
1. Economic Efficiency
Carbon trading allows emissions to be reduced where it is cheapest to do so. This avoids uniform, rigid regulations.
2. Incentivizing Innovation
By putting a price on carbon, businesses are encouraged to develop renewable energy, energy efficiency, and carbon capture technologies.
3. Flexibility for Companies
Firms can choose between reducing emissions in-house or purchasing credits.
4. Revenue for Governments
Auctioning allowances generates billions in revenue, which can be invested in climate adaptation, renewable energy, and social welfare.
5. Encouraging Global Cooperation
Projects under mechanisms like CDM foster technology transfer and sustainable development in developing nations.
Part V: Criticisms and Challenges
1. Over-allocation and Low Prices
Early systems often gave too many free allowances, leading to low carbon prices and weak incentives to reduce emissions.
2. Risk of Greenwashing
Some companies use cheap offsets instead of making real emission reductions.
3. Measurement and Verification Issues
Ensuring that carbon offset projects actually reduce emissions is complex. For instance, how do we prove a forest will not be cut down in the future?
4. Unequal Impact
Poor communities may bear the brunt of offset projects (land grabs for tree plantations, displacement of locals).
5. Market Volatility
Carbon prices can be unstable, creating uncertainty for businesses planning long-term investments.
Part VI: Carbon Trading in India
India, as a fast-growing economy and the world’s third-largest emitter, plays a key role. The government has launched initiatives like:
Perform, Achieve, and Trade (PAT): improving industrial energy efficiency.
Renewable Energy Certificates (RECs): promoting green electricity.
Carbon Credit Trading Scheme (2023): a framework for compliance and voluntary carbon markets.
If implemented effectively, India could become a major player in global carbon markets while balancing development and sustainability.
Conclusion
Climate change is not only an environmental challenge but also an economic, social, and ethical one. Carbon trading has emerged as one of the most significant tools to address it, creating financial incentives for emission reductions. From the Kyoto Protocol to the Paris Agreement, carbon markets have evolved into a central pillar of global climate policy.
However, carbon trading is no silver bullet. Its success depends on strict caps, transparent monitoring, fair distribution, and integration with other climate policies. If designed well, carbon markets can drive innovation, fund green projects, and accelerate the global transition to a low-carbon future.
Ultimately, carbon trading is a means to an end. The real goal is climate stability, protecting ecosystems, and ensuring a sustainable future for generations to come. For that, both markets and morality must work hand in hand.

EURUSD: Exhausting Uptrend Around 1.1930-1.2400The EUR/USD pair shows signs of losing momentum on the chart, which is expected as it is currently in the final (5th) wave of a larger wave C or 3.
The RSI indicates a second consecutive bearish divergence, but the uptrend could continue for a while. The price is likely to reach at least 1.1930, which is the level where wave C equals wave A, for symmetry.
The blue box highlights the target area based on the Fibonacci sequence. It starts at 1.1930 and peaks around 1.2400, where wave 5 of wave C is projected to cover 61.8% of the distance from wave 1 to wave 3.
We’re not predicting the reversal point yet; we’ll let the market reveal it in due time.
Wishing us all lucky trades!

Bound for BreakoutHighlighted mentions of rate cuts erased. This is a view of what could happen in September.
Before this happens it may break lower to test support to 1.14544.
There is a fake out in lower highs and lower lows before the news of rat cut. It may just break up.
Over all I believe this is a big bullish set up that will possibly break. 1.1800 by November of this year.

Bullish Euro!?Going Long on the EURUSD
-US fed interest rate cuts
-Euro denominated bond issuance increase in record amounts
- perceived stability of the Euro Zone.

EURUSD Wave Analysis – 16 September 2025- EURUSD broke key resistance level 1.1835
- Likely to rise to resistance level 1.2000
EURUSD currency pair recently broke above the key resistance level 1.1835 (which stopped the previous impulse wave (5) at the end of June, as can be seen below).
The breakout of the resistance level 1.1835 was preceded by the breakout of the daily Triangle from July, which accelerated the active impulse wave (3).
Given the clear daily uptrend, EURUSD currency pair can be expected to rise to the next round resistance level 1.2000, target for the completion of the active impulse wave (3).

Dovish Fed May Spark EUR/USD BreakoutThe ECB hinted it may be done cutting interest rates at its latest policy meeting last week, and the market appears to believe that is the case, with no further rate cuts being priced in. Meanwhile, the Fed is about to embark on another round of rate cuts later this week, which could unleash the euro from its recent period of consolidation.
Despite facing strong resistance at 1.1760, the EUR/USD has been making higher lows since early August, creating a bullish technical pattern known as an ascending triangle. Additionally, the relative strength index has started to turn higher, signalling a potential shift in momentum.
A breakout appears to be in the works, and should the euro finally rally past resistance, the move could be significant. Measuring from the low on 1 August of 1.141 to resistance at 1.17, indicates that the EURUSD could rally to as high as 1.21, and potentially as high as 1.23, a level not seen since January 2021.
Should the Fed come in more hawkish than expected through the Summary of Economic Projections, often referred to as the dot plot, or should Powell strike a more hawkish tone in his press conference, it could see the euro versus the dollar break below the uptrend of the ascending triangle pattern, falling towards support at 1.157. A break of that support level could then open the way for a return to the August lows at 1.141.
Written by Michael J. Kramer, founder of Mott Capital Management.
Disclaimer: CMC Markets is an execution-only service provider. The material (whether or not it states any opinions) is for general information purposes only and does not take into account your personal circumstances or objectives. Nothing in this material is (or should be considered to be) financial, investment or other advice on which reliance should be placed.
No opinion given in the material constitutes a recommendation by CMC Markets or the author that any particular investment, security, transaction, or investment strategy is suitable for any specific person. The material has not been prepared in accordance with legal requirements designed to promote the independence of investment research. Although we are not specifically prevented from dealing before providing this material, we do not seek to take advantage of the material prior to its dissemination.

ELLIOTT WAVE EURUSD Daily update
EW Trade Set Up daily
minute ((i)) seems finished
H4 scenario 210725:
the price upward movement from 1.1557 area on 17/07/25 has broken decisively 1.1684-1.1705 area but it had not the
strenght to go further so that the lagging span (green line) could break upward the leading span B (red line).
A decrescent high has been registered at 1.1800 area on 24/07/25.
In this new scenario it looks like that the impulsive movement that started from 1.0180 on 13/01/25
finisced at 1.1834 on 010725 in the minute wave (i). (EWO divergence, break down of the upward (ii)/(iv) channel).
So i have to register that a correction to minute wave ((ii) has started
key levels VP area
1.1800
1.1370 POC
1.0850
note :
monitor the price reaction at any supports level: VP area and LVN

Swing Setup: (1D+4H) POI + 5min DIVERGENCE + FVA RESPECT So I did my top down analysis, saw a 1D FVG and price respected it, so I looked for divergences and i found it on the 5min, saw price made an FVA and displaced through it so I decided it was time to enter that because a 4H and 1D FVG is a strong POI, and the fact that price did not burst through it meant it was getting respected.
So I think it was at this time that I saw the FVA has formed and has been respected so I looked for an entry.
For the actual entry, I think there was a small bullish FVG there above the FVA so I took that.
Since price was at a 1D + 4H FVG, I considered it as the Internal Range Liquidity(IRL) and therefore targeted the External Range Liquidity (ERL). I put my SL quite far, at the bottom of this sting into the FVG. It got me 2.8RR I think, and that's good enough.
I made this trade on friday, and it only resolved the next trading day, which was monday.
TL;DR, 4H and above POI(IRL), once you see it getting respected (with an FVA + FVG), take it as a sign, enter without hesitation, and target the ERL.

EUR/USD – 4HWithin a medium-term uptrend, new signals are emerging to support the continuation of this move.
The pair rallied with strong momentum 🚀, breaking above the key level at 1.1580, which has now turned from resistance into current support, and has stabilized above it.
At the same time, the pair has started forming a corrective pattern in the shape of a descending channel 📉, with the bullish outlook confirmed upon a breakout to the upside.
📊 Outlook: Continuation of the uptrend
🔑 Bullish condition: Price remains above 1.1510
🎯 Next targets: 1.1811, followed by 1.2000

EURUSD H1 📊 EURUSD H1 Analysis
On H1, we have a bullish FVG aligned with an order block.
Once price retests this order block, we’ll look for lower timeframe confirmation to enter long positions.
✅ Bias: Bullish
🎯 Plan: Wait for retest → confirm on smaller TF → Buy
Patience and confirmation are key. ⚡️
#EURUSD #Forex #PriceAction #SmartMoney #TradingPlan

EURUSD Currently in a battle between trendsEURUSD Locked in a Battle Between Trends
EURUSD is currently caught between two opposing structures: an ascending green trendline providing support from below, and a descending red resistance trendline capping price action from above. This squeeze highlights an imminent breakout, where the next directional push could set the tone for weeks ahead.
🔍 Technical Analysis
Current price: 1.1719.
Price is consolidating inside a triangle formation:
Support: Ascending trendline from early August.
Resistance: Descending red trendline from July highs.
Above lies a major daily resistance at 1.2094, roughly 182 pips away.
🛡️ Support Zones (if pullback occurs):
🟢 1.1710 – Immediate Trendline Support
Nearest defense. Losing this could trigger deeper correction.
🟡 1.1451 – 4H Support (Great Entry)
Strong structural zone for bulls.
Stop-loss: Below 1.1386
🔼 Resistance Levels:
🟥 1.1820 – Trendline Resistance
First major cap. Break above confirms bullish momentum.
🟥 1.2094 – Daily Strong Resistance
Key ceiling. Clearing this opens path toward 1.2186.
🧭 Outlook
Bullish Case: Hold above 1.1710 + breakout past 1.1820 → continuation toward 1.2094 and beyond.
Bearish Case: Rejection under red trendline + break below green trendline → deeper correction into 1.1451.
Bias: Neutral → waiting for a clear breakout of the squeeze.
🌍 Fundamental Insight
The euro’s strength has been capped by sluggish growth and ECB caution, while the USD remains volatile on rate expectations. A dovish Fed stance could lift EURUSD higher, but stronger U.S. data or dollar demand would reinforce resistance.
✅ Conclusion
EURUSD is at a critical decision point, caught between opposing trendlines. Traders should watch closely for a breakout confirmation: above 1.1820 for bullish continuation, or below the green trendline for bearish correction.
⚠️ Disclaimer
This analysis is for educational purposes only and does not constitute financial, investment, or trading advice.

EURUSD bullish breakout support at 1.1700The EURUSD remains in a bullish trend, with recent price action showing signs of a breakout within the broader uptrend.
Support Zone: 1.1700 – a key level from previous consolidation. Price is currently testing or approaching this level.
A bullish rebound from 1.1700 would confirm ongoing upside momentum, with potential targets at:
1.1846 – initial resistance
1.1900 – psychological and structural level
1.1933 – extended resistance on the longer-term chart
Bearish Scenario:
A confirmed break and daily close below 1.1700 would weaken the bullish outlook and suggest deeper downside risk toward:
1.1630 – minor support
1.1585 – stronger support and potential demand zone
Outlook:
Bullish bias remains intact while the EURUSD holds above 1.1700 A sustained break below this level could shift momentum to the downside in the short term.
This communication is for informational purposes only and should not be viewed as any form of recommendation as to a particular course of action or as investment advice. It is not intended as an offer or solicitation for the purchase or sale of any financial instrument or as an official confirmation of any transaction. Opinions, estimates and assumptions expressed herein are made as of the date of this communication and are subject to change without notice. This communication has been prepared based upon information, including market prices, data and other information, believed to be reliable; however, Trade Nation does not warrant its completeness or accuracy. All market prices and market data contained in or attached to this communication are indicative and subject to change without notice.

The Day AheadData releases:
US: Key focus on August retail sales and industrial production for signs of consumer strength and manufacturing momentum. Import/export price indexes, capacity utilisation, NY Fed services survey, NAHB housing index, and July business inventories also due.
UK: July average weekly earnings and unemployment rate plus August jobless claims change—important for gauging wage pressures.
Japan: July Tertiary industry index.
Germany/Eurozone: September ZEW surveys, July industrial production, and Q2 labour costs—insight into economic sentiment and cost pressures.
Canada: August CPI (key for BoC policy outlook) and housing starts.
Central banks: ECB’s Escriva speaks.
Auctions: US 20-year Treasury bond sale.
Market impact will hinge on US retail sales/production, UK wage data, Eurozone ZEW sentiment, and Canada CPI for central bank expectations.
This communication is for informational purposes only and should not be viewed as any form of recommendation as to a particular course of action or as investment advice. It is not intended as an offer or solicitation for the purchase or sale of any financial instrument or as an official confirmation of any transaction. Opinions, estimates and assumptions expressed herein are made as of the date of this communication and are subject to change without notice. This communication has been prepared based upon information, including market prices, data and other information, believed to be reliable; however, Trade Nation does not warrant its completeness or accuracy. All market prices and market data contained in or attached to this communication are indicative and subject to change without notice.

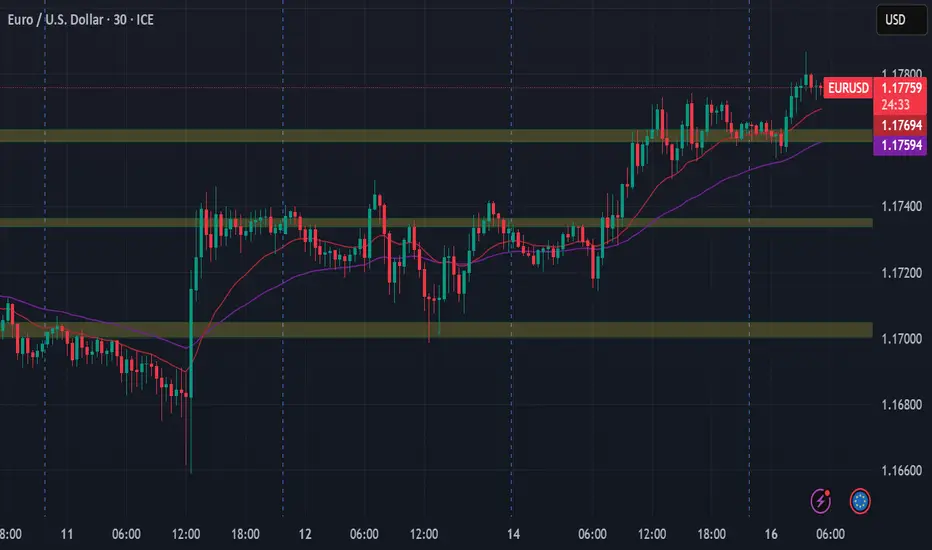
EUR/USD take-profit hit at 1.17902Move aligned perfectly with the dollar’s pre-news bullish push. Tight stops + volume confirmation = textbook execution.
On the sidelines now, waiting for the next setup.

EURUSD swing long idea 16.9.25Multiple TF up trend
Looking for long at level 1.17450 and bellow
Taking 1R profit from position taken 11.9 (published)
EUR news 11, USD news 14:30
We are holding one trade, if we get another swing we will take it.

EURUSD and Continuation of the upward trendWell, as you can see, it grew exactly based on the previous analysis I provided and continued along the same path... @mrshirafkan If it can stabilize at the specified level this week, it can continue its growth trend in the same direction again.

Why Clear Goals Are Your Trading RoadmapWhen I first started, my only goal was to see profits. Nothing else mattered. The problem with that approach is that the goalpost kept moving. Every win felt too small, every loss felt too big, and I was stuck chasing numbers instead of building something solid.
That’s when I realized goals aren’t just about money they’re about direction. Clear goals give you a roadmap. They remind you why you started, where you want to go, and what steps will get you there. Without them, every setback feels like the end of the road. With them, even losses become part of the journey, not the destination.
Your goals don’t have to be huge or complicated. They just need to be yours realistic, clear, and connected to the bigger picture of the life you want to create. That is what keeps you steady when emotions run high and setbacks appear.
For me, shifting from chasing profits to setting clear goals changed everything. It gave me patience, discipline, and most importantly, perspective.
So ask yourself:
📌 Are my daily actions going to help me keep this skill for the long run?
The answer to the question can become the roadmap to the life you truly desire.