EUR/USD – H1 Wedge Breakout |Bullish Momentum Targeting 1.1600📌 Setup Overview FX:EURUSD
EUR/USD has broken out of a falling wedge on H1, signalling a potential bullish trend reversal.
Price has reclaimed the Ichimoku cloud — now acting as support, showing fresh buyer strength.
• Pattern: Wedge Breakout Pattern
• Timeframe: H1 Chart
• Bias: Bullish
• Reason for setup: Breakout & Retested
🎯 Trading Plan
• Entry idea: Retest of breakout zone for confirmation before continuation
• TP1: 1.15886 (1st Resistance)
• TP2: 1.16148 (2nd Resistance / liquidity sweep zone)
🧠 Fundamental Drivers
1️⃣ 80% probability the Federal Reserve cuts rates in December → weaker USD supports bullish EUR/USD
2️⃣ Upcoming high-impact data to watch:
• EUR – German GDP
• USD – Core PPI
• USD – Retail Sales
Fundamentals currently favour bullish EUR side, with USD losing momentum.
#EURUSD #forex #forexanalysis #priceaction #chartanalysis #technicalanalysis #fundamentalanalysis #tradingview #supportandresistance #smartmoney #breakout #wedgebreakout #ichimokucloud #marketstructure
📌 What to expect
Break/retest continuation structure suggests 1.1588 is the first magnet.
If momentum remains strong, price could extend to 1.1614 liquidity zone.
🔖 SAVE this post so you don’t miss the update when levels hit.
👍 LIKE if you want more Wedge & Breakout setups.
⚠ Disclaimer:
Trade for education/study only. Manage risk according to your own system.
Trade ideas

EURUSD Buyers Defend Support — Targets 1.1600 Resistance RetestHello traders! Let’s break down the current EURUSD structure. EURUSD is trading within a broad ascending structure, finding strong support at the Buyer Zone (1.1500–1.1510), which aligns with both the Support Level and the lower boundary of the rising channel. This area has acted as a key reaction point multiple times, confirming the presence of strong buyers and forming the base for several upward impulses. Earlier, the pair broke out of the descending triangle structure, retesting the former Seller Zone before continuing lower. After reaching the channel support, EURUSD formed a local bottom and started to grow, respecting the trendline and creating higher lows. A fake breakout occurred near the mid-channel resistance, where buyers quickly returned, signaling continued demand. Currently, EURUSD is approaching the Resistance Level at 1.1600, which also serves as the first major take-profit area (TP1). This zone has previously caused corrective moves and remains the main barrier for buyers. If the pair maintains momentum and stays above the Buyer Zone, I expect a bullish push toward TP1 → 1.1600, where sellers may again attempt to hold resistance. A confirmed breakout above 1.1600 would unlock a path toward higher levels within the ascending structure. However, if EURUSD breaks below 1.1500 and fails to hold the Buyer Zone, the bullish scenario becomes invalid. In that case, the price may revisit deeper support levels and potentially exit the rising channel. For now, the structure remains moderately bullish, with buyers dominating as long as the pair trades above demand and respects the ascending support line. Please share this idea with your friends and click "Boost" 🚀

EURUSD - Waiting on the direction!Introduction
EURUSD is currently trading in a very technical zone where price is positioned between two significant daily fair value gaps. These opposing imbalances—one bearish and one bullish—are acting as major directional barriers. As long as price remains contained between them, the pair is effectively trapped in a compression phase, awaiting a decisive breakout. The next clear move will likely arise when either the upper or lower FVG gives way, allowing the market to target the liquidity zones that lie beyond these imbalances.
Daily Bearish FVG
Above current price sits the daily bearish fair value gap, which is acting as a strong resistance area. If EURUSD manages to break through this upper FVG with conviction, it would indicate that buyers have reclaimed control. A clean break above this zone would open the path toward the liquidity area located at the top of the chart. This region is where a large cluster of stop orders and resting buy-side liquidity is likely positioned. A move into this area would be a natural target as price seeks to rebalance inefficiencies and tap into the liquidity pool above previous highs.
Daily Bullish FVG
Below the current range lies the daily bullish fair value gap, functioning as a major support zone. If EURUSD breaks below this lower FVG, it would signal a shift in momentum back to the downside. Such a move would send price toward the liquidity zone at the bottom, where sell-side liquidity rests beneath prior lows. This would align with typical market behavior in a bearish continuation—first taking out inefficiencies, then reaching into the liquidity pools that form below structural lows.
Conclusion
EURUSD is currently confined between two major daily FVG levels, creating a tightly compressed structure where the next breakout will dictate direction. Until price decisively breaks either the bearish FVG above or the bullish FVG below, the pair remains in a waiting phase. The eventual breach of one of these imbalances will determine whether EURUSD hunts liquidity at the top or at the bottom, making this a critical moment for directional clarity in the market.

EURUSDHello Traders! 👋
What are your thoughts on EURUSD?
EUR/USD has broken its descending trendline and has now completed a clean pullback to the broken level. In this zone, we expect the pair to consolidate briefly and then move toward the identified resistance area.
A confirmed breakout above this resistance will open the way for the next upside targets and act as a strong confirmation of the continuation of the bullish move.
Don’t forget to like and share your thoughts in the comments! ❤️

Why Manual Forex Trading Is Officially Dead 📘 Why Manual Forex Trading Is Officially Dead — And AI Will Bury It in 2026
________________________________________
1. 🚨 Executive Summary
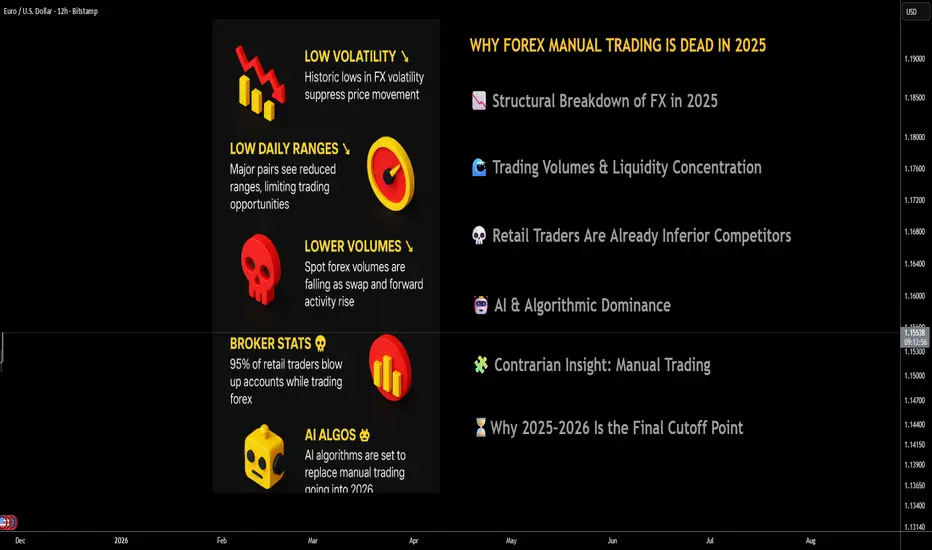
Manual FX trading is not merely declining—it is entering its terminal phase. As of 2025, the confluence of record-low volatility, crushed daily ranges, shrinking spot volumes, and hyper-efficient AI execution frameworks has dismantled the edge discretionary traders once possessed.
Regulators report that 74–89% of retail CFD/FX traders lose money, with internal broker statistics showing even higher failure rates—often pushing the informal industry estimate of 90–95% account blow-up rates. The structural market environment now exacerbates those figures: less movement, tighter spreads, and faster AI-driven price formation leave no oxygen for manual decision-making.
The verdict is clear: manual FX trading is no longer a competitive activity—it's an anachronism.
________________________________________
2. 📉 Structural Breakdown of FX in 2025: A Market That No Longer Moves
The fundamental requirement for profitable manual FX trading—price movement—has been suppressed. According to multiple 2023–2024 analyses (Reuters, BIS), FX markets entered a multi-year period of historically subdued volatility, with the CVIX (Currency Volatility Index) sitting near multi-cycle lows.
Major pairs like EUR/USD and USD/JPY are posting 1/3 to 1/2 of their historical daily ranges, compressing intraday opportunity. What used to be 80–120 pip swings are now 30–50 pip oscillations dominated by micro-structure noise rather than directional moves.
In this environment, manual traders have insufficient statistical runway to generate returns, while AI systems can still monetize tiny dislocations at millisecond speed.
________________________________________
3. 🌊 Trading Volumes & Liquidity Concentration: The Game Has Moved On
The 2022 BIS Triennial Survey already documented a shift: spot FX volumes stagnated while swap and forward activity increased, driven by hedging and treasury optimization rather than speculative flows.
By 2025, institutional venues show continued softness in spot volumes, and even the leading eFX platforms reported lower activity during prolonged volatility droughts. This matters because:
• Lower volume = fewer sustained directional trends
• More volume concentrated among algos = fewer exploitable inefficiencies
• Liquidity providers internalize flow before it ever becomes visible to retail charts
Manual trading can’t survive structural liquidity centralization reinforced by machine execution.
________________________________________
4. 💀 Retail Traders Are Already Inferior Competitors and the Data Shows It
Manual traders are not just competing against the market—they are competing against:
• Prime brokers running internal AI risk engines
• HFT firms reading order books at microsecond resolution
• Banks using reinforcement-learning execution algos
ESMA’s regulatory disclosures show 74–89% of retail FX/CFD accounts lose money, but internal broker studies often cite 90–95% destruction rates, especially when volatility is muted.
The brutal truth: manual traders blow up because the game is no longer designed for human reaction speed or intuition.
________________________________________
5. 🤖 AI & Algorithmic Dominance: The 2026 Regime Shift
By 2026, FX will be AI-first, not human-first. Institutional adoption of AI execution is growing double digits annually (per GMI, GrandView), and retail brokers are already rolling out AI-assisted trade generation, AI signal clusters, and AI risk models.
AI advantages include:
• Predictive ability using LSTM/transformers trained on terabytes of tick data
• Zero-latency execution across fragmented liquidity pools
• Ability to profit in low-volatility regimes via microstructure edge
• Adaptive models that rewrite themselves every 24 hours
• No fatigue, no bias, no emotional degradation
In contrast, manual traders operate on slow cognition, subjective pattern recognition, and outdated chart heuristics. This is not a fair fight. Manual trading is no longer a skill—it's an obsolete hobby.
________________________________________
6. 🧩 Contrarian Insight: Manual Trading Isn't Just Dying—It’s Being Engineered Out
Here are non-obvious, high-conviction insights that institutional investors should consider:
(1) Market makers WANT low volatility
Low volatility increases internalization efficiency and reduces hedging costs. Human traders thrive on chaos; AI thrives on order. Who does the system favor?
(2) AI reduces liquidity available to humans
Liquidity is increasingly “dark” inside internal matching engines, meaning price discovery happens before retail traders ever see the candle.
(3) Manual trading can’t survive the “fractionalization” of edge
AI doesn’t need large moves—it monetizes micro-micro-inefficiencies in ways humans never could.
(4) Spread compression kills human R:R ratios
With 0.1–0.3 pip spreads on majors, AI can scalp micro-spreads—humans cannot.
(5) Behavioral inefficiencies have been minimized
Classic manual strategies—breakouts, fib levels, candlestick patterns—worked because humans created predictable behavioral cycles.
Now? AI models detect and arbitrage those behaviors instantly.
The most contrarian conclusion?
Manual trading didn’t die naturally—the market evolved to eliminate it.
________________________________________
7. ⏳Why 2025–2026 Is the Final Cutoff Point
Three forces collide in this window:
1. Volatility compression (structure-driven, not temporary)
2. AI adoption exceeding human adaptability
3. Retail traders facing the worst statistical environment in 15 years
This is the first time in FX history where:
• Human intuition has zero measurable edge
• AI dominance is irreversible
• Market conditions structurally reject manual trading
The past cycles always argued “vol will return.”
In 2025–2026, that is no longer a credible investment thesis.
________________________________________
8. 📈 Implications for Investors & Brokers
Investors should allocate to:
• AI-driven FX funds
• ML-enhanced macro strategies
• Data infrastructure feeding predictive FX models
Brokers should:
• Pivot to AI-based trading tools
• Monetize analytics subscriptions
• Shift away from promoting discretionary trading education
The firms that expect a retail manual trading revival will be structurally misaligned with market evolution.
________________________________________
________________________________________
🔥 Final Conclusion: Manual Traders Will Be Left Behind in 2026
The logic is now overwhelming:
low volatility + low ranges + reduced volumes + AI dominance = endgame for manual FX trading.
Human discretionary trading cannot survive in a marketplace designed for—and increasingly ruled by—data-driven, sub-millisecond, self-learning AI engines.
Manual traders in 2026 will not fight the bots.
They will simply be trading inside a system architected by the bots, reacting slowly to patterns that no longer exist.
The era is over.
The market has moved on.
Market Mispricing? EURUSD Ready to Surge on FED PivotHey Traders,
In today’s trading session we are monitoring EURUSD for a buying opportunity around the 1.15300 zone. The pair has been trading in a clear uptrend, and is now entering a healthy correction phase, approaching a key trend support / S&R confluence at 1.15300.
Fundamentals continue to lean strongly in favor of EURUSD bulls:
Markets now expect the FED to cut rates in December, a clear bearish driver for the USD as easing expectations gain traction.
Rumors yesterday suggested that Kevin Hassett is now the top contender for the next FED Chair.
Hassett is widely viewed as the most dovish possible pick, which only deepens downside pressure on the Dollar.
With USD sentiment turning increasingly soft and price nearing a major technical support, the 1.15300 area becomes a highly strategic zone to look for bullish continuation.
Trade safe,
Joe.

EURUSD: Fake Breakout Reversal Points to 1.1580 ResistanceHello everyone, here is my breakdown of the current Euro setup.
Market Analysis
EURUSD is currently trading within a broader Upward Channel, maintaining a medium-term bullish structure despite several corrective pullbacks. The chart shows that price has repeatedly respected both the channel’s lower boundary (around 1.1500–1.1510) and its upper boundary near 1.1650–1.1660, confirming the validity of this rising structure. Earlier in the move, EURUSD formed a Range Phase, followed by a clean Breakout, which established bullish momentum and pushed the pair higher toward the channel midpoint. Each breakout retest acted as support afterward, signaling strong buyer interest. However, the most recent movement shows a fake breakout below 1.1500, where sellers temporarily pushed price under support before it sharply recovered — a classic liquidity grab near the channel’s lower boundary.
Currently, EURUSD is trading just above the Support Zone (1.1500–1.1510) and forming an early bullish reaction. This area has repeatedly acted as demand and aligns with both channel support and the prior fake breakout region. The nearest obstacle for buyers remains the 1.1580 Resistance Level, which has consistently served as a rejection zone on multiple attempts. A sustained break above this level would confirm bullish control and allow price to retest higher channel areas.
My Scenario & Strategy
As long as EURUSD holds above the 1.1500–1.1510 Support Zone and stays within the upward channel, the bullish scenario remains valid. A corrective move upward is likely, with the first target at 1.1580 Resistance — a key level that aligns with previous breakout and retest points. A clean breakout above 1.1580 would signal continuation of bullish momentum, opening the path toward 1.1650–1.1660, located near the channel’s upper boundary and previous reaction zones.
Alternatively, if EURUSD fails to break 1.1580 and forms another rejection, sellers may attempt to push price back into the support area. A confirmed breakdown below 1.1500 would invalidate the current bullish structure and could shift the market toward a broader bearish correction. For now, long positions remain favorable while price stays above the channel’s lower boundary, with bullish continuation dependent on overcoming the 1.1580 resistance level.
That's the setup I'm tracking. Thank you for your attention, and always manage your risk.

EURUSDEUR/USD previously moving within a large descending channel marked by two downward-sloping trend lines. Price consistently respected these lines, confirming bearish control for several days.
However, the market eventually broke above this descending structure, signalling a potential shift in momentum. After breaking out, price retraced back toward the trend line area, which now acts as new support — a classic retest scenario often seen before a trend reversal.
The chart shows EUR/USD bouncing from this support after a mild pullback. The white curved arrow illustrates the expected reaction: a short-term dip toward the support, followed by an upward continuation. This aligns with common market behaviour where price “retests before it rallies.”
🔹 Final Target – Major Resistance
The green area highlights the projected bullish move toward the major resistance zone around 1.16750 – 1.17000. This zone has historical significance as previous highs and a strong selling area. If buyers gain enough momentum, this is the logical destination for the next major push.
⚠️ Note
This description explains the technical reasoning behind a bullish forecast, but it is for educational purposes only, not financial advice. Always manage risk and adapt to changing market conditions.
If your find it helpful please like and comments this post and share thanks.

EURUSD Poised for Further Downside as Bearish Structure HoldsEURUSD Poised for Further Downside as Bearish Structure Holds
From our previous analysis, EURUSD reached our first target and found a strong support near 1.5300
EUR/USD continues to trade within a clear bearish structure after breaking down from the large symmetrical triangle formation earlier this month.
The pair is struggling to gain bullish traction, and every short-term recovery has been met with selling pressure.
Price is currently retesting the minor support area around 1.1530, but momentum remains weak.
The next support levels to watch are:
🔹 1.1470
🔹 1.1400
As long as the pair remains below 1.1665 resistance, the overall outlook favors further declines.
You may find more details in the chart!
Thank you and Good Luck!
❤️PS: Please support with a like or comment if you find this analysis useful for your trading day❤️

EURUSD Long: Buyers Eye a Push Toward 1.15700 Supply ZoneHello traders! EURUSD continues to trade within a broader bearish market structure, remaining below the long-term Supply Line, which acts as dynamic resistance and keeps the pair under selling pressure. The chart shows several pivot points forming along both the supply trendline and the rising demand trendline, confirming the current wedge-like structure. Earlier, the pair created a Rounding Top Pattern near the upper boundary of the structure, which signaled weakening bullish momentum and triggered a sharp decline toward the Demand Line. After touching the demand trendline around 1.1500, EURUSD formed a strong bullish reaction at the pivot point, showing buyers stepping in to maintain support. However, the recent breakout and retest of minor structure levels still leave the pair below the key 1.15700 Supply Zone, where price has reacted multiple times in the past. This zone aligns with horizontal supply and the descending Supply Line — forming a high-confluence resistance area.
Currently, the pair is attempting to recover toward 1.15700, which is the nearest upside target. If price reaches this level, it may face strong selling pressure once again, as previous breakouts from this zone turned into bearish rejection candles. As long as EURUSD remains trapped between the Demand Line and Supply Line, the overall structure stays corrective and heavily dependent on reactions at these key zones.
My scenario as long as EURUSD holds above the Demand Zone at 1.1500–1.1510, buyers may attempt a short-term recovery toward 1.15700, which acts as the nearest structural resistance. A clean breakout above 1.15700 would confirm bullish strength and could open the way for a deeper correction toward the descending Supply Line. However, if the pair gets rejected at the Supply Zone again, sellers may regain control and push price back toward 1.1510–1.1500, where demand is expected to react. A confirmed break below 1.1500 would invalidate the bullish recovery potential and could signal continuation of the broader bearish trend. For now, EURUSD supports a short-term bullish retracement, but the larger trend remains bearish while price stays below the descending Supply Line. Manage your risk!

EURUSD: Targets focus on declines to 1.1480 support levelHello everyone, here is my breakdown of the current Euro setup.
Market Analysis
EURUSD continues to trade within a clear Downward Channel, maintaining a strong bearish structure characterized by consistent lower highs and lower lows. Early in the chart, the pair formed a prolonged Range Phase, signaling indecision before sellers eventually took control and pushed the price downward. After breaking below the range, EURUSD repeatedly retested the Resistance Area around 1.1550, where the market showed strong bearish reactions. Each bounce into this resistance zone resulted in a clear rejection, proving that sellers consistently defend this area. The chart also highlights multiple Breakout attempts, all of which failed to sustain upward continuation, confirming a lack of bullish strength. Additionally, the chart shows the formation of a Triangle Pattern, with price reacting between the Triangle Resistance Line and the Triangle Support Line. Despite temporary recoveries, every move upward was limited and capped by descending trendline pressure.
Currently, EURUSD broke below the minor structure support again, demonstrating that bearish momentum remains dominant. Price is now heading toward the Support Zone near 1.1480, which aligns with both horizontal demand and the Triangle Support Line. This confluence makes it a key level to watch. As long as EURUSD trades below the 1.1550 Resistance Area and stays inside the Downward Channel, the bearish structure remains intact. Any bullish recovery is likely to be corrective rather than trend-changing unless buyers manage to break above major resistance.
My Scenario & Strategy
I expect EURUSD to continue edging lower toward the 1.1480 Support Zone, following the recent rejection from resistance. A minor upward correction may occur, potentially retesting broken support or the Triangle Resistance Line, but such a move would likely be short-lived without strong bullish confirmation.
A confirmed breakdown below 1.1480 would open the path for deeper bearish continuation within the Downward Channel. Only a solid breakout above 1.1550, backed by strong buying pressure, would challenge the prevailing bearish trend. For now, selling the pullbacks remains the more favorable strategy while price stays below major resistance.
That's the setup I'm tracking. Thank you for your attention, and always manage your risk.

EURUSD Downside Outlook: Price Eyes Retest of 1.1540 Buyer ZoneHello traders! Here’s my technical outlook on EUR/USD based on the current market structure. After testing the Seller Zone near 1.16000–1.16200, the price once again faced rejection, forming a fake breakout around the descending Resistance Line. This confirms that sellers are still defending this area and keeping the pair inside a broader bearish structure. From there, EUR/USD pulled back toward the Buyer Zone, located between 1.15400–1.15000, which has acted as a reliable support area multiple times. The market is now moving inside a corrective pattern, showing weakening bullish momentum as it approaches support. As long as the pair trades below the Seller Zone and the descending trendline, bearish pressure remains dominant. The chart suggests a likely continuation toward the TP1 target at 1.15400, where buyers previously stepped in and produced notable recoveries. A clean bounce from this zone may trigger another short-term bullish correction — but without a breakout above 1.16000, any upside is likely to remain limited. A breakdown below 1.15400 could open the way for deeper declines toward lower support levels, while a confirmed breakout above the Seller Zone would shift short-term sentiment. Please share this idea with your friends and click Boost 🚀

Hellena | EUR/USD (4H): SHORT to the MIN of wave "3" 1.14647.We continue to monitor the decline in downward momentum. In the last forecast the target was almost reached, but the correction turned out to be stronger than we thought, which does not cancel the forecast, but just gives us an opportunity to enter a short position once again quite favorably.
I expect that the small wave “b” is either over or almost over and the price is about to start its decline to the support area at 1.14647.
This movement should be a confirmation of the completion of the large correction (red) “ABC”.
Manage your capital correctly and competently! Only enter trades based on reliable patterns!

EURUSD buy ideaWe are now looking at EURUSD because we know that the H4 swing structure is bullish and the M15 swing structure is also bullish. Now we will take the trade from the M15 timeframe. So currently, on M15, the swing structure is bullish and the market is in a pullback phase. We are watching it until the market reaches the blue zone. As soon as the market reaches this blue zone, we will take a buy.
Blue zone: 1.15612 – 1.15472
Now, why are we looking to buy from the blue refine? This is because the previous blue buy zone (1.15500 – 1.15588) was swept, and the buy went through. So now, a new blue zone has formed (1.15612 – 1.15472). As soon as the market reaches here, we will look for a buy signal from this zone and take a buy.

EURUSD: Support & Resistance Analysis for Next Week 🇪🇺🇺🇸
Here is my latest support and resistance analysis
for EURUSD for next week.
Consider these structures for pullback/breakout trading next week.
❤️Please, support my work with like, thank you!❤️
I am part of Trade Nation's Influencer program and receive a monthly fee for using their TradingView charts in my analysis.

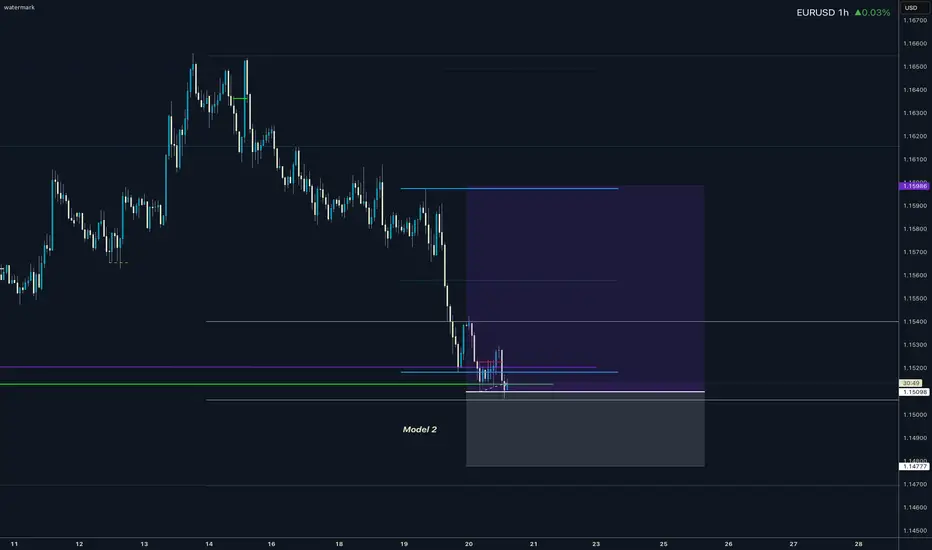
EURUSD I Daily CLS Model 1 I Monthly I Model 2Hi friends, new range created. As always we are looking for the manipulation in to the key level around the range. Don't forget confirmation switch from manipulation phase to the distribution phase to make the setup valid. Stay patient and enter only after change in order flow. If price reaches 50% of the range take partial or full close.
📌HTF - Higher Timeframe view
🧩 Complete proces and Strategy explained 👇 Click Below
🎯 Why your market approach also should be mechanical ?
NO Fixed Mechanical Trading Logic - You are guessing random patterns
NO Defined trading plan - Every trade different logic
NO Same logic in each trade - Not possible to backtest
NO Backtests on at least 300 trades - Not knowing Statistics
➡️ No Statistics ➡️ No Edge ➡️ Mindset ProblemS
🧠 Core of mindset problems
If you don't know your statistics on large enough data sample. You don't know your probabilities of win rate once the losing streak happen and it happens to every strategy. You will start doubting, hesitating to take next trade because you don't know statistics of your losses. In the end you will be doubting strategy and then jump to different one. You will be in the endless loop for years, looking for new better strategy. 👊 Your ultimate goal as a trader is not to be a generalist who knows 10 000 patterns. But rather create one system with narrowed criteria of each element of the trade to remove subjective and emotional decisions as much as possible and stick to this system no matter what. Practice it 10 000 times become a MASTER.
✨ Trading Mastery is reflection of your life
Have a longterm plan, No Alcohol & Drugs, Ignore others, Focus on your journey , Backtest regularly, Review your weeks, Journal mistakes, Exercise, Sleep well, Read books, Walks in nature (no phone) , Meditate, Reduce social media time, Spend time with family, Live Life.
Trading is hard, but not impossible. I believe in you 💪
David Perk aka Dave Fx Hunter
EURUSD – Technical Target Analysis...📊 EURUSD – Technical Target Analysis (Based on my Chart)
1️⃣ Trendline Breakout
Price has clearly broken above the descending trendline, which often signals that the prior bearish momentum is weakening and a corrective move upward is likely.
2️⃣ Ichimoku Structure
Price pushed into and through the cloud, showing early bullish pressure.
A bullish continuation is possible if price holds above the cloud and above the breakout level.
---
🎯 Target Levels Based on my Chart
My chart shows two target zones, and the market structure supports them:
🔵 Target 1 (Short-term / Conservative)
📍 1.1570 – 1.1580 zone
This area is:
The first horizontal resistance
A point where previous selling pressure appeared
A logical TP1 for a breakout-pullback setup
A pullback into this zone is common after a trendline breakout.
---
🔵 Target 2 (Extended / Stronger Move)
📍 1.1615 – 1.1622 zone
This area aligns with:
Major structural resistance on my chart
The upper measured-move extension my marked
Previous swing highs
If momentum continues, this is the next logical upside target.
---
🧭 Summary of Targets
Target Price Zone Reason
Target 1 1.1570 – 1.1580 First resistance + measured breakout level
Target 2 1.1615 – 1.1622 Major resistance + full extension

Lingrid | EURUSD Bear Market Digging Lower TerritoryFX:EURUSD is trading under the weekly high after rejecting the upward trendline, confirming another lower high inside the broader bearish channel. Price is now slipping toward the mid-range zone, where the breakout failed earlier, showing that buyers are losing control. The upward trendline has already been broken once, and the it is forming a corrective structure that typically precedes a deeper decline.
If momentum stays weak, price may push toward 1.14500, which aligns with the major support area on the 4H chart. Fundamentally, the euro remains under pressure as markets scale back expectations for ECB tightening, while USD strength persists ahead of key U.S. data this week — reinforcing the bearish scenario.
➡️ Primary scenario: continuation lower toward 1.14500 support.
⚠️ Risk scenario: reclaiming 1.15570 and breaking the red trendline would open a bullish correction.
If this idea resonates with you or you have your own opinion, traders, hit the comments. I’m excited to read your thoughts!

EURUSD BearishChannel–Watching for Rejection Near TrendlineEURUSD is currently moving within a clear bearish channel on the 4H timeframe, with price consistently respecting both the upper and lower boundaries of the structure. The overall trend remains corrective to bearish, as each retest of the channel’s upper trendline has led to downward continuation.
In the latest swing, price has approached the upper boundary once again, an area that has acted as a significant reaction point multiple times in the past. This zone combines trendline resistance with recent CHoCH (Change of Character) shifts that highlight where momentum has previously reversed. If the market maintains its respect for this structure, this region may serve as an area of interest for monitoring price behavior.
The midline of the channel, as shown on the chart, has also played an important role throughout the trend—often serving as a dynamic support/resistance guide for price rotations within the channel. A rejection at the top could lead price back toward this midline or potentially to the lower boundary, where previous reactions have formed temporary bullish relief rallies.
This analysis focuses on identifying market structure, trend continuation behavior, and historical reaction points, rather than providing trade signals or predictions. Price may break, retest, or consolidate around these levels, and traders should always verify setups with their own strategy and risk management system before making decisions.
This idea is shared purely for educational and analytical purposes, helping traders understand how price interacts with channel structures and key reaction zones.

EURUSD: Bullish Push to 1.167?FX:EURUSD is eyeing a bullish breakout on the 4-hour chart , with price rebounding from a key support zone near recent lows, converging with cumulative sell liquidation and a potential entry area that could spark upside momentum if buyers hold against short-term pullbacks. This setup hints at a reversal opportunity after the recent downtrend, targeting higher resistance levels with strong risk-reward.
Entry between 1.1490–1.1500 for a long position (aggressive entry right here with proper risk management is recommended). Targets at 1.1590 (first), 1.1670 (second). Set stop loss on a close below 1.14685 , delivering a clean risk-reward ratio of ~1:4+ (full run). Watch for bullish confirmation on lower timeframe breakout or strong green candle with volume surge.⚡
Fundamentally , peace talks between Russia and Ukraine are gaining traction in November 2025, with US officials (including Army Secretary Dan Driscoll) engaging in secret negotiations in Abu Dhabi under a proposed Trump-backed plan, where Ukraine has agreed in principle but minor details remain, though Russia shows reluctance and may reject revisions. This could positively impact the euro's upward trend by reducing geopolitical risks, stabilizing European energy markets, and boosting investor confidence in the region's economy.
📝 Trade Setup
🎯 Entry (Long):
1.1490 – 1.1500
(Aggressive entry at current levels is acceptable with strict risk management.)
🎯 Targets:
• TP1: 1.1590
• TP2: 1.1670
❌ Stop Loss:
• Close below 1.14685
⚖️ Risk-to-Reward:
• ~1:4+ full target
👇 Share your thoughts below! 👇

EUR/USD Consolidation — Bullish Bias DevelopingEURUSD is currently consolidating as the market waits for key news events that could trigger a stronger move. The U.S. dollar has paused its recent momentum, allowing EURUSD to rebound quickly from support levels.
Price action suggests developing bullish interest, with the pair trading in a range while preparing for a possible breakout.
If buyers are able to push above the current resistance zone, the bullish structure would be confirmed. In that scenario, the next potential upside area traders may monitor lies around 1.16200–1.16500.
You may find more details in the chart.
Trade wisely best of Luck Buddies,
Ps; Support with like and comments for better analysis Thanks for Supporting.

EURUSD at a Critical Turning Point!EURUSD Analysis – tuseday, November 25
Welcome traders! 👋
I’m glad to have you here — we’re all learning and growing together in this amazing trading journey.
Let’s dive into today’s analysis on EURUSD 👇
As mentioned in the previous analysis, EURUSD remains bearish on the weekly timeframe.
However, on the daily timeframe, price is currently in a decision stage:
If the price breaks the range from above, the bullish trend may continue.
If the price breaks the range from below, market structure will shift back to a stronger bearish trend.
On the 4H timeframe, the market is very choppy, showing consolidation with no clear directional strength.
If price breaks a weak high, bullish continuation becomes likely.
Given this structure, I am watching two main scenarios for today:
Scenario 1 (bullish continuation)
Price sweeps sell-side liquidity below, aligned with the Asia session low.
Price taps into the POI (demand zone).
From the POI, price moves upward toward the OBS, breaking the internal weak high.
After breaking structure, bullish continuation becomes valid.
Scenario 2 (bullish continuation from above)
Price sweeps Asia session high liquidity.
It then taps into the OBS, creating a reaction.
From the OBS, price moves downward toward the POI.
After balancing price and taking liquidity, price pushes upward again and breaks the weak high, continuing bullish.
Important Notes
⚠️ The market is not 100% predictable — always wait for confirmation before taking any entry.
⚠️ Risk management is essential, especially during uncertain, choppy phases.
📌 If you have any questions, drop a comment below.
📘 Educational Note:
This analysis is for educational purposes only. Always follow your trading plan, confirm setups with your strategy, and manage risk carefully.
🚀 Empowering traders through clarity, confidence & clean charts.
Follow 👉 parisa_tl for more SMC setups and weekly insights 💙
#EURUSD #Forex #ForexAnalysis #PriceAction #SmartMoneyConcepts #SMC #Liquidity #OrderBlock #Breakout #FXTrading #ForexTrader #MarketStructure #DayTrading #SwingTrading #TechnicalAnalysis #TraderLife #TradingView #FXMarket #ForexSetups #ForexSignals

EURUSD Long: Upside Pressure Targets Retest of 1.1610 LevelHello traders! EURUSD is forming a clear technical structure after reacting precisely to both the Supply and Demand levels, creating a clean sequence of trend shifts and breakout points. Earlier, the pair moved inside a strong Descending Channel, where each retest of the upper boundary produced sharp bearish impulses. This confirmed that sellers were fully in control during that phase. A breakout from the channel led to a short consolidation Range, showing temporary buyer accumulation before a trend reversal. Following this accumulation, EURUSD entered an Ascending Channel, where price consistently made higher highs and higher lows. Multiple breakouts occurred along the way, showing how buyers gained strength while defending each pullback. However, an important Fake Breakout near 1.1570 revealed that bullish momentum was still fragile, and price slipped back into the channel before resuming the upward movement.
Currently,, the market formed a clear Inverse Head and Shoulders reversal pattern at the bottom, located directly inside the 1.1500–1.1520 Demand Zone. This zone acted as a major support cluster, generating strong bullish reactions. After confirming the neckline breakout, EURUSD rallied aggressively toward the current structure. At the moment, price is pushing higher and approaching the 1.16100 Supply Zone, which has repeatedly acted as resistance in previous market swings. This level is now the main obstacle for bulls and the next key reaction zone.
My scenario as long as EURUSD remains above the 1.15700 Demand Zone, the bullish trend structure remains intact. A continuation toward the 1.16100 Supply Zone (TP1) is the most likely scenario. This level is expected to create the next significant reaction, as it aligns with previous selling pressure. A clean breakout above 1.16100 would reinforce the bullish momentum and open the path toward the next upside levels. However, if EURUSD rejects the supply area, a pullback toward 1.15700–1.15500 may occur before buyers attempt another upward move. Only a breakdown below the demand zone would weaken the bullish outlook and shift momentum back toward sellers. For now, the market favors buying pullbacks into demand while monitoring reactions closely at the 1.16100 resistance. Manage your risk!
