USDEUX trade ideas

Fundamental Market Analysis for June 10, 2024 EURUSDThe EUR/USD exchange rate remained under pressure for the second consecutive day, falling to a three-week low during the Asian session on Monday. Spot prices are currently trading around 1.07750, indicating continued vulnerability to breakout momentum following the NFP publication.
The closely watched monthly employment report from the US Department of Labor showed that the US economy added 272,000 jobs in May, compared to an expected 185,000 and an upwardly revised 175,000 in the previous month. In addition, average hourly earnings beat consensus estimates and rose 4.1% in the 12 months to May, eclipsing the rise in the unemployment rate to 4.0%.
Nonetheless, the data prompted investors to abandon expectations of a Federal Reserve (Fed) rate cut in September and kept US Treasury yields elevated. This, along with cautious sentiment in stock markets, supports the safe-haven US Dollar (USD) and becomes a key factor exerting downward pressure on EUR/USD.
Conversely, the common currency is being undermined by exit poll results showing that Eurosceptic nationalists made the biggest gains in Sunday's European Parliament elections. Furthermore, French President Emmanuel Macron's decision to call a snap election later this month adds to political uncertainty in the eurozone's second-largest economy and favours euro bears.
This suggests that the most straightforward path for EUR/USD is downwards. However, traders may refrain from making aggressive directional bets ahead of Wednesday's important FOMC policy decision. Ahead of this key central bank risk event, traders will face the release of the latest US consumer inflation data, which will boost the dollar and give it meaningful momentum.
Trade recommendation: Trading mainly by Sell orders from the current price level.

NON FARM PAYROLL Successful Trade NON FARM PAYROLL Successful Trade
Non farm payroll is not a day to trade according to my teacher. Which I support following this logic.
I did want to test my theory of where Price would gravitate to what liquidity and why. I suspected that with Price shifting seasonly it seemed very likely for Price to seek a huge range to the sell side. I had a couple targets and put my take profit of below the range I thought it could go to.
London created a short term high and a short term low. At 7 am the judus swing to press up and take the short term buys in London.
I studied the DXY and this chart the noght before and identifed that it seemed likely for DXY to seek higher prices to FVGs and stops. It seemed very likely that noted lower TF FVG and Liquidity is what Price would seek for EURUSD. I was at the airport getting ready to board and felt so strong where Price was going so I trade my idea.
I entered the trade once I saw the energetic displacement on the 809 candle that broke structure. Followed by a bearish order block tipping its hand further, I had to move my stop loss once to prevent me from getting knocked when Price pressed up.
I exited and closed the trade at 1.08393. Great trade because I trusted my analysis and desired to test myself. This will not be a habit but its fun to see if I can analyze where Price is headed.

EurUsd Breaks structure.. to 1.057 Monthly Level?Hello Traders. EurUsd has been ranging for the last 3 weeks ever since May CPI data. We attempted to break to the upside last monday but this resulted in a failed breakout and better than forecasted US Jobs data pulled USD down with strong momentum. Price retreated all the way to the bottom of the daily range on friday at 1.08 Daily support level. It appears this momentum has sustained itself as price gapped down over the weekend and we observed a further selloff during the first trading session of the week , moving another 25 pips. I do see some buying pressure off 1.07478 moving into London trading and to begin the week. Looking at the June Monthly candle, we are just pulling straight down thus far. Can we extend to the bottom of the Monthly range at 1.057? It seems likely the dollar will remain strong for some time given the strong labor market data and the Higher for Longer Interest rates concept. Safe trading.

EURUSD Trading Journal Analysis EURUSD Trading Journal Analysis
Price is delivering to a discount market on the weekly.
I anticipate for Price to seek the sell side liquidity and bear to my noted sell side liquidity. I do feel we could reach to 1.06695 for the weeks low.
That said I do anticipate for Price to rebalance the daily SIBI for the weeks high at range 1.08884.

EurUSd GAPI like these gpas when they give us some extra pips to trade against after the open. I think the EURUSD is at a good point to accumulate longs for the gap fill. The trade is marked on the chart, I wont actually have a stop though I will just keep adding small position sinto the fill.


EURUSD analysis after positive Nonfarm data📌EUR/USD plummets to weekly lows near 1.0800 following US jobs data. EUR/USD is under heavy pressure and trades at a one-week low near 1.0800. The US dollar continued to gain strength following upbeat jobs data, which showed Nonfarm Payrolls increased by 272,000 in May and put pressure on the pair.
📌Markets are focused on the European Parliament Elections, today. Besides important US economic reports such as CPI, FOMC, PPI and UoM Consumer Preliminary Market Sentiment.
📌After breaking through the trendline and the important support zone at 1.08350, gold approached the stronger support level of 1.079. From there a small trading price margin is formed. The recovery next week of EURUSD is insignificant with the highest level being the Break out price range around 1.08600. The pair's decline is favored with a record hit of the 1.07300 support zone possible.
Resistance: 1,083-1,086
Support: 1,079-1,073
BUY EURUSD zone 1.073-1.072 SL 1.070
SELL EURUSD zone 1.086-1.088 SL 1.090

EURUSD Trading Journal Analysis EURUSD Trading Journal Analysis
Price delivering to discount market on the weekly.
Mondays huge price swing from taking the buy stops from April and declining to the 50% of the noted FVG.
Tuesday Price higher creating a new swing high leaving buy stops liquidity while stying just above the 50% equilibrium.
Non farm payroll volatility on Friday created the low of the week while Price rebalanced the lower TF FVG at range 1.07981.
Great delivery this week to my noted sentiments. Celebrate.

EURUSD H4 | Bullish Bounce?Based on the H4 chart analysis, we can see that the price is falling to our buy entry at 1.0743, which is a pullback support.
Our take profit will be at 1.0796, a pullback resistance.
The stop loss will be placed at 1.0679, which is an overlap support level.
High Risk Investment Warning
Trading Forex/CFDs on margin carries a high level of risk and may not be suitable for all investors. Leverage can work against you.
Stratos Markets Limited (www.fxcm.com):
CFDs are complex instruments and come with a high risk of losing money rapidly due to leverage. 68% of retail investor accounts lose money when trading CFDs with this provider. You should consider whether you understand how CFDs work and whether you can afford to take the high risk of losing your money.
Stratos Europe Ltd, previously FXCM EU Ltd (www.fxcm.com):
CFDs are complex instruments and come with a high risk of losing money rapidly due to leverage. 70% of retail investor accounts lose money when trading CFDs with this provider. You should consider whether you understand how CFDs work and whether you can afford to take the high risk of losing your money.
Stratos Trading Pty. Limited (www.fxcm.com):
Trading FX/CFDs carries significant risks. FXCM AU (AFSL 309763), please read the Financial Services Guide, Product Disclosure Statement, Target Market Determination and Terms of Business at www.fxcm.com
Stratos Global LLC (www.fxcm.com):
Losses can exceed deposits.
Please be advised that the information presented on TradingView is provided to FXCM (‘Company’, ‘we’) by a third-party provider (‘TFA Global Pte Ltd’). Please be reminded that you are solely responsible for the trading decisions on your account. There is a very high degree of risk involved in trading. Any information and/or content is intended entirely for research, educational and informational purposes only and does not constitute investment or consultation advice or investment strategy. The information is not tailored to the investment needs of any specific person and therefore does not involve a consideration of any of the investment objectives, financial situation or needs of any viewer that may receive it. Kindly also note that past performance is not a reliable indicator of future results. Actual results may differ materially from those anticipated in forward-looking or past performance statements. We assume no liability as to the accuracy or completeness of any of the information and/or content provided herein and the Company cannot be held responsible for any omission, mistake nor for any loss or damage including without limitation to any loss of profit which may arise from reliance on any information supplied by TFA Global Pte Ltd.
The speaker(s) is neither an employee, agent nor representative of FXCM and is therefore acting independently. The opinions given are their own, constitute general market commentary, and do not constitute the opinion or advice of FXCM or any form of personal or investment advice. FXCM neither endorses nor guarantees offerings of third party speakers, nor is FXCM responsible for the content, veracity or opinions of third-party speakers, presenters or participants.

EURUSD is in the uptrend direction.This Asset is trying to go in the uptrend direction to reach my given targets. The deep technical and fundamental analysis done while using various methods, and now I have cleared that the EURUSD is trying to reach the upper resistance to gain some more respect.
LIKE👍, COMMENT 💬 & FOLLOW ➕, these figures can encourage me to analyze more efficiently for you. My all followers are requested to support me, comment my ideas and share your thoughts in comment box and new comers are invited to follow and support me.

Heading into overlap resistance, could it reverse from here?EUR/USD is rising towards a resistance level which is an overlap resistance that lines up with the 23.6% Fibonacci retracement and could potentially reverse from this level to our take profit.
Entry: 1.07943
Why we like it:
There is an overlap resistance level which aligns with the 23.6% Fibonacci retracement.
Stop loss: 1.08406
Why we like it:
There is an overlap resistance level which is slightly above the 50% Fibonacci retracement.
Take profit: 1.07299
Why we like it:
There is an overlap support level that lines up with the 61.8% Fibonacci retracement.
Please be advised that the information presented on TradingView is provided to Vantage (‘Vantage Global Limited’, ‘we’) by a third-party provider (‘Everest Fortune Group’). Please be reminded that you are solely responsible for the trading decisions on your account. There is a very high degree of risk involved in trading. Any information and/or content is intended entirely for research, educational and informational purposes only and does not constitute investment or consultation advice or investment strategy. The information is not tailored to the investment needs of any specific person and therefore does not involve a consideration of any of the investment objectives, financial situation or needs of any viewer that may receive it. Kindly also note that past performance is not a reliable indicator of future results. Actual results may differ materially from those anticipated in forward-looking or past performance statements. We assume no liability as to the accuracy or completeness of any of the information and/or content provided herein and the Company cannot be held responsible for any omission, mistake nor for any loss or damage including without limitation to any loss of profit which may arise from reliance on any information supplied by Everest Fortune Group.

E/U 10-06-24top down analysis using SMC made live for you so that eventually you can also understand how i operate on live markets
if you want to know how i enter trades or how i see a certain asset just follow me, message me and i will most likely do a custom video for you.

EURUSD Short Possibility!The pair is currently correcting downwards, and as indicated on the chart, we can expect the E Wave to hit the 0.382, 0.5 or 0.618 Fibonacci levels at 1.07845, 1.07494, 1.07143, respectively.

EURUSD - CORRECTION UP AND IMPULSE DOWN EURUSD - CORRECTION UP AND IMPULSE DOWN
Last week npf drop the market and target archive if market correct upside then another impulse down will come.
V.Ragu

EU LongD: Downtrend, price retraced 61.8% and came close to -27 on daily FIB
4H: Upptrend, price retraced 38.2% and hit -27 on 4H FIB, consolidating above monthly level
1H: Consolidating, price broke below upward trendline and dropped to previous zone, @ 4H trendline
CURRENTLY: There's bullsih divergence on minor TF RSI + opening price has a 20 pip gap to close.
I'm looking for price to go long and close the gap, then go as far as the monthly key level

EURUSD Trendline Breakout Ready for a Long BullHello Traders
In This Chart EURUSD HOURLY Forex Forecast By FOREX PLANET
today EURUSD analysis 👆
🟢This Chart includes_ (EURUSD market update)
🟢What is The Next Opportunity on EURUSD Market
🟢how to Enter to the Valid Entry With Assurance Profit
This CHART is For Trader's that Want to Improve Their Technical Analysis Skills and Their Trading By Understanding How To Analyze The Market Using Multiple Timeframes and Understanding The Bigger Picture on the Charts

idea on a chartWe have a great trend that id forming lets wait and see where the chart takes us. Next week looks great for trades.
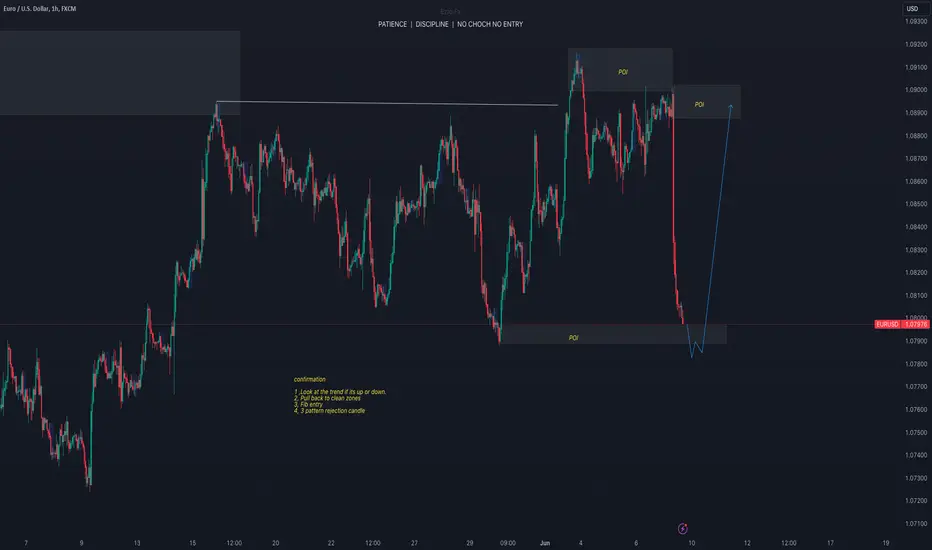
EURUSD POSSIBLE MOVEJune NFP data caused price to create a liquidity void in the downside due to the high impact of the news. This coming days um expecting the price to break through 1.07890 swig low then after that um expecting the price to fill the void where um expecting to see price trading in a ranging mode which is likely to be a rising channel. filling 70% (OTE) of the channel then continues with the bearish move.

EURUSD POSSIBLE MOVEJune NFP data caused price to create a liquidity void in the downside due to the high impact of the news. This coming days um expecting the price to break through 1.07890 swig low then after that um expecting the price to fill the void where um expecting to see price trading in a ranging mode which is likely to be a rising channel. filling 70% (OTE) of the channel then continues with the bearish move.

CHART BREAKDOWN EURUSD: Key Levels, Targets and Thoughts!Brief Description🖊️:
The chart provides insights into critical market levels, emphasizing an essential supply zone (low-risk sell zone) spanning from 1.0906 to 1.0909. Additionally, one low-risk buy zone between 1.0800-1.0790, respectively, is highlighted.
Things I Have Seen👀:
Important Supply Zone🟢: Identified between 1.0906 to 1.0909, serving as a low-risk sell.
Important Demand Zone🟢: Identified between 1.0800-1.0790, serving as a low-risk buy.
Bullish Targets📈:
1.0812: Possible retracement area.
1.0840: Possible retracement area.
1.0855: Possible retracement area.
1.0870: Possible retracement area.
1.0906: Significant supply zone.
Ultimate Target: 1.0915- Liquidity area.
Bearish Targets📉:
1.0880: Possible retracement area.
1.0868: Possible retracement area.
1.0835: Possible retracement area.
1.0815: Essential Demand Zone
Ultimate Target: 1.0770- Laying Low Liquidity
What's Important Now❗
Currently, the crucial approach is to wait and observe the price action at this level. We need to assess how the market reacts before considering any decisive moves. Stay observant and responsive to real-time developments in the market.


EURUSD Finishing Wave A of E, Ichimoku & HA Bearish
EURUSD may be near the end of wave A of the final wave E of a contracting triangle. Ichimoku Cloud and Heiken Ashi are bearish on the 4h, 1h, 15m, and 5m charts.
