Potential bearish continuation?EUR/USD is rising towards the resistance level, which is a pullback resistance that aligns with the 61.8% Fibonacci retracement and could reverse from this level to our take profit.
Entry: 1.1601
Why we like it:
There is a pullback resistance that aligns with the 61.8% Fibonacci retracement.
Stop loss: 1.1637
Why we like it:
There is an overlap resistance level.
Take profit: 1.1542
Why we like it:
There is a multi-swing low support level.
Enjoying your TradingView experience? Review us!
Trade ideas

EUR/USD Technical Analysis – Sellers Regain Control After False On the H1 timeframe, EUR/USD continues to respect its bearish market structure, with price failing to sustain above short-term resistance near 1.1635 – 1.1650. The pair recently attempted a bullish breakout, but the move was quickly rejected, leading to a strong bearish engulfing candle that brought price back into the prior range.
This rejection confirms the presence of active sellers near the upper boundary of the consolidation zone, suggesting that the market is preparing for another push toward the support zone at 1.1575 – 1.1580.
Key Technical Levels
Resistance Zone: 1.1635 – 1.1650
Major Resistance: 1.1680 – 1.1700
Immediate Support: 1.1575 – 1.1580
Next Support: 1.1540
Trading Plan
Bias: Bearish – focus on short positions after failed breakout confirmation
Entry Zone: 1.1625 – 1.1635
Stop-Loss: Above 1.1655
Take-Profit Targets:
TP1: 1.1580
TP2: 1.1540
Risk-Reward Ratio: 1:2 or better
Technical Outlook
The broader sentiment remains negative for the euro as the U.S. dollar continues to strengthen amid rising Treasury yields and cautious risk sentiment. Unless EUR/USD closes above 1.1655 on the H1 or H4 timeframe, the path of least resistance remains to the downside.
Look for bearish rejections or RSI rollover near resistance to confirm renewed selling pressure.
Stay disciplined and follow for more daily market insights and professional trade setups designed for price-action traders.

EURUSD⬆️ Buy Entry: 1.15830 - 1.15680
⏹️ Stop Loss: 1.15210
*️⃣ Take Profit: 1.16460 - 1.16800
🔠 The US Federal Reserve said it would end quantitative easing, and thus stop shrinking its balance sheet, by December 1, 2025.

Heading into 50% Fibonacci resistance?The Fiber (EUR/USD) is rising towards the pivot, which is an overlap resistance that aligns with the 50% Fibonacci retracement and could reverse to the 1st support.
Pivot: 1.1621
1st Support: 1.1576
1st Resistance: 1.1656
Disclaimer:
The above opinions given constitute general market commentary, and do not constitute the opinion or advice of IC Markets or any form of personal or investment advice.
Any opinions, news, research, analyses, prices, other information, or links to third-party sites contained on this website are provided on an "as-is" basis, are intended only to be informative, is not an advice nor a recommendation, nor research, or a record of our trading prices, or an offer of, or solicitation for a transaction in any financial instrument and thus should not be treated as such. The information provided does not involve any specific investment objectives, financial situation and needs of any specific person who may receive it. Please be aware, that past performance is not a reliable indicator of future performance and/or results. Past Performance or Forward-looking scenarios based upon the reasonable beliefs of the third-party provider are not a guarantee of future performance. Actual results may differ materially from those anticipated in forward-looking or past performance statements. IC Markets makes no representation or warranty and assumes no liability as to the accuracy or completeness of the information provided, nor any loss arising from any investment based on a recommendation, forecast or any information supplied by any third-party.

EURUSD Short: Retest of Resistance Before Next Leg DownHello traders! The overall market structure for EURUSD continues to favor the bears, following a sharp rejection from the 1.1720 supply zone. This area marked a strong pivot point where the price failed to sustain any further bullish momentum and began forming a clear descending channel, establishing a consistent pattern of lower highs and lower lows.
Currently, the pair is trading within this descending channel, maintaining strong downside momentum. After a short-term recovery attempt, the price reached the upper boundary of the channel and reacted with a noticeable rejection from the resistance line, reinforcing bearish pressure.
My scenario for the next move suggests that this corrective rally is now complete. I expect the price to resume its downward trajectory from this resistance area and move toward the 1.1560–1.1540 demand zone, where the next key reaction level lies.If sellers remain dominant and manage to break through this demand area, the next wave could extend toward new lows, continuing the broader bearish trend. Therefore, my target (TP) is set at 1.1560, anticipating the continuation of the main downward impulse. Manage your risk.

EURUSD - Signal#EURUSD - Signal
H4 - Formation of a local double top + trendline breakout. Stop loss beyond the high of wave 1. Risks should not increase, as news is expected.
Entry: 1.16235
TP: 1.15775 - 1.15405 - 1.14868 - 1.14282
Stop: 1.16724

EUR/USD Daily AnalysisPrice continues to respect the bearish structure after reacting from the supply zone and forming another lower high. The market is showing steady selling pressure, and we expect this to continue into next week.
Our next target is the support area around 1.1500 – 1.1450, giving about 165 pips of potential movement.
This setup aligns with the broader downtrend, showing clean market structure and clear momentum.

Euro Coils Ahead of Fed / ECBEuro plummeted more than 3.1% from the yearly highs with price exhausting into technical support for the past three-weeks and the focus is on possible inflection into this zone with the medium-term risk still weighted to the downside while below the monthly open (1.1734).
Initial weekly support rests with the July low-week close (LWC) / 61.8% retracement of the July advance at 1.1586/93 and is backed by 1.1497-1.1505- a region defined by the March 2020 high, the 2022 high, and the 100% extension of the September decline. Look for a larger reaction there IF reached with a break / weekly close below needed to suggest a more significant high is in place / a larger correction is underway within the broader uptrend. Subsequent support objectives eyed at the Aril high close at 1.1394 with the next major technical consideration eyed at the 2024 high-week close (HWC) / 38.2% retracement of the yearly range at 1.1228/54.
Weekly resistance is eyed at the 1.1747/75- a region defined by the 2025 HWC, the June high-close, and the 61.8% retracement of the September decline. A breach / weekly close above this pivot zone is needed to mark resumption of the broader uptrend with key resistance steady at the 100% extension of the 2022 advance / 38.2% retracement of the broader 2008 decline at 1.1917-1.2020 (area of interest for possible exhaustion / price inflection IF reached. Subsequent resistance eyed at the 2021 HWC at 1.2218 in the event of a breakout.
Bottom line: Euro is trading just above support, and the focus is on inflection off this zone in the days ahead with a weekly close below needed to fuel the next leg of this pullback. From a trading standpoint, rallies should be limited to 1.1734 IF price is heading lower on this stretch with a close below 1.1497 needed to fuel the next leg of the decline.
-MB

Heading into pullback resistance?EEUR/USD is rising towards the resistance level, which is a pullback resistance that is slightly below the 78.6% Fibonacci retracement and the 61.8% Fibonacci projection and could reverse from this level to our take profit.
Entry: 1.1686
Why we like it:
There is a pullback resistance that is slightly below the 78.6% Fibonacci retracement and 61.8% Fibonacci projection.
Stop loss: 1.1723
Why we like it:
There is a swing high resistance level.
Take profit: 1.1638
Why we like it:
There is an overlap support level.
Enjoying your TradingView experience? Review us!
Please be advised that the information presented on TradingView is provided to Vantage (‘Vantage Global Limited’, ‘we’) by a third-party provider (‘Everest Fortune Group’). Please be reminded that you are solely responsible for the trading decisions on your account. There is a very high degree of risk involved in trading. Any information and/or content is intended entirely for research, educational and informational purposes only and does not constitute investment or consultation advice or investment strategy. The information is not tailored to the investment needs of any specific person and therefore does not involve a consideration of any of the investment objectives, financial situation or needs of any viewer that may receive it. Kindly also note that past performance is not a reliable indicator of future results. Actual results may differ materially from those anticipated in forward-looking or past performance statements. We assume no liability as to the accuracy or completeness of any of the information and/or content provided herein and the Company cannot be held responsible for any omission, mistake nor for any loss or damage including without limitation to any loss of profit which may arise from reliance on any information supplied by Everest Fortune Group.
Enjoying your TradingView experience? Review us!

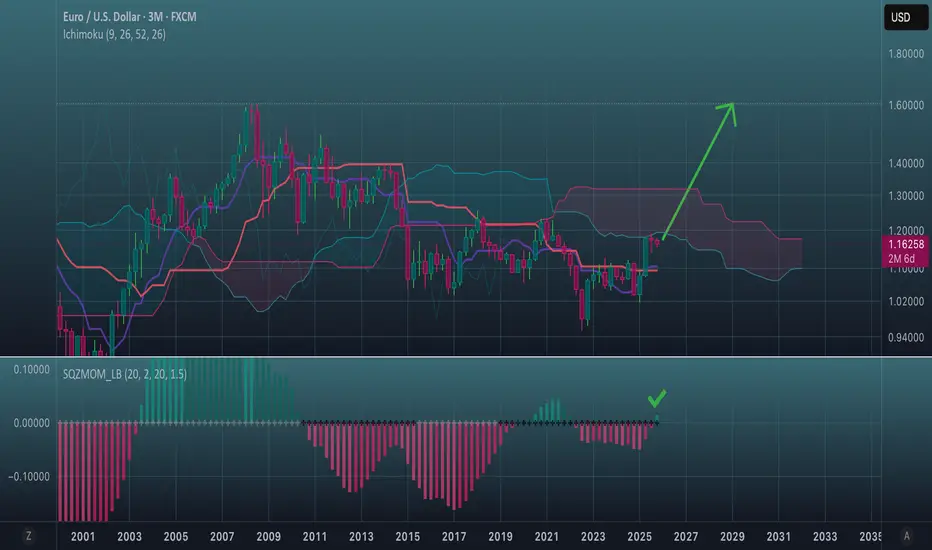
EURUSD Huge Bearish Divergence and Cross targets 1.12000.The EURUSD pair has been trading within a 3-year Channel Up since the September 28 2022 market bottom. On September 17 2025 it hit its top (Higher Highs trend-line) for the first time since the July 18 2023 High.
The current Bullish Leg has almost been the same as the previous one (around +18%) and is about to form a 1D MA50 (blue trend-line) - 1D MA100 (green trend-line) Bearish Cross. That will be the first such pattern since September 25 2023. Along with the already established 1D RSI Bearish Divergence, it is more likely to see the pattern start the new Bearish Leg now (max extension +18.28% at 1.20450).
The first Target of the previous Higher High rejection was the 0.5 Fibonacci retracement level. Our Target is again slightly above it at 1.12000.
-------------------------------------------------------------------------------
** Please LIKE 👍, FOLLOW ✅, SHARE 🙌 and COMMENT ✍ if you enjoy this idea! Also share your ideas and charts in the comments section below! This is best way to keep it relevant, support us, keep the content here free and allow the idea to reach as many people as possible. **
-------------------------------------------------------------------------------
💸💸💸💸💸💸
👇 👇 👇 👇 👇 👇

Bearish reversal off 50% Fibonacci resistance?EUR/USD could rise towards the resistance level, which is a pullback resistance that aligns with the 50% Fibonacci retracement and could reverse from this level to our take profit.
Entry: 1.1650
Why we like it:
There is. pullback resistance that aligns with the 50% Fibonacci retracement.
Stop loss: 1.1675
Why we like it:
There is a pullback resistance that is slightly above the 61.8% Fibonacci retracement.
Take profit: 1.1619
Why we like it:
There is a pullback support level that aligns with the 38.2% Fibonacci retracement.
Enjoying your TradingView experience? Review us!
Please be advised that the information presented on TradingView is provided to Vantage (‘Vantage Global Limited’, ‘we’) by a third-party provider (‘Everest Fortune Group’). Please be reminded that you are solely responsible for the trading decisions on your account. There is a very high degree of risk involved in trading. Any information and/or content is intended entirely for research, educational and informational purposes only and does not constitute investment or consultation advice or investment strategy. The information is not tailored to the investment needs of any specific person and therefore does not involve a consideration of any of the investment objectives, financial situation or needs of any viewer that may receive it. Kindly also note that past performance is not a reliable indicator of future results. Actual results may differ materially from those anticipated in forward-looking or past performance statements. We assume no liability as to the accuracy or completeness of any of the information and/or content provided herein and the Company cannot be held responsible for any omission, mistake nor for any loss or damage including without limitation to any loss of profit which may arise from reliance on any information supplied by Everest Fortune Group.

Approaching Potential SuuportAfter a strong reaction from 1.19187 and then near 1.18200, more distribution has been seen on the top left near 1.17750 zone, on this 30 min chart.
The distribution was followed by a trending move on the downside, contained at 1.15400 zone with a double bottom formation. RSI divergence and absorption signs on the volume profile made it a valid but risky buy.
Above 1.16310 resistance zone, the pair broke the LL-LH streak and pushed up strongly to 1.17283 which comes within the previous distribution zone on the left.
The sharp reaction is representing a change in behavior but at the same time, the 1.16310 zone can't be neglected as this may now act as support.
Although the RSI is entering in its oversold zone yet further evidence like RSI divergence or absorption in volume profile may further confirm if a solid reversal trade is possible in the zone or not.
In simple words, some slow down near the key level mentioned above, after grabbing some liquidity below 1.16432, would be a preliminary sign of strength.
On the flipside, a vertical fall past 1.16310 may take it to the next important level, that is below 1.15275 zone. Any signs of reversal at this level may offer a quick sharp move on the upside.
What are your views on the pair? Do you think it will resume up or down?
Do comment and boost for more such ideas.
#The above analysis is for educational purpose, not a buy sell recommendation.

EUR/USD – Triangle Breakout (CPI Data ahead)EUR/USD – Buy Entry (M30- Channel Breakout Pattern)
The EUR/USD Pair, Price has been trading within a Triangle Breakout Pattern on the M30 chart, forming consistent higher highs and higher lows. Price action is now testing the upper boundary of the Pattern, signalling a possible breakout.
✅Market Context:
1️⃣Strong Upward Structure Inside the Pattern.
2️⃣Buyers are showing strength near Resistance.
3️⃣Breakout above the Trendline indicates Momentum continuation toward higher zones.
✅Trade Plan:
Entry: Buy after Confirmed Breakout above the Resistance (m30 candle close above trendline or retest of the breakout).
💰Take Profit (TP): At the Key Zone – a Major Resistance area identified ahead.
🛑Stop Loss (SL): Below the Pattern Structure.
✅Psychological Discipline :
1️⃣Stick to plan – No Revenge Trades.
2️⃣Accept losing trades as Part of the Strategy.
3️⃣Risk only 1–2% of your account balance per trade.
💬 Support the community: If you found this useful, drop a 👍 like and share your thoughts in the comments!
⚠️ Disclaimer: This analysis is for educational purposes only and does not constitute financial advice. Forex trading involves high risk. Trade only with capital you can afford to lose and always do your own research.

EURUSD: Bulls Regain Momentum as Dollar SoftensAfter weeks of choppy downside swings, EURUSD is finally showing signs of recovery. The pair has bounced strongly from recent lows, and price action is now leaning toward the upside with buyers testing resistance zones. With US dollar momentum softening and euro sentiment improving, this could be the start of a corrective leg higher.
Current Bias
Bullish – momentum has shifted toward the upside with clear higher lows forming on the 4H chart.
Key Fundamental Drivers
USD: Pressure from slowing US data and expectations of a gradual Fed easing path weigh on the dollar.
EUR: Support from improved German Ifo sentiment and stabilizing eurozone inflation outlook.
Relative Rates: The ECB is moving cautiously, but the market expects fewer cuts compared to the Fed, giving EUR a relative edge.
Macro Context
Interest Rates: Fed easing expectations are rising as growth slows, while the ECB signals patience in its path to normalizing policy.
Economic Growth: The eurozone economy is sluggish but showing tentative stabilization, while the US economy faces weakening labor momentum.
Geopolitical Themes: US tariff tensions continue to support short-term USD spikes, but broader positioning favors a softer dollar.
Primary Risk to the Trend
A surprise hawkish Fed comment or stronger US inflation/consumer data could revive dollar strength and cap EURUSD upside.
Most Critical Upcoming News/Event
US PCE inflation and labor market reports.
Eurozone CPI flash estimate.
Central bank speeches (ECB and Fed officials).
Leader/Lagger Dynamics
EURUSD acts as a leader in the FX market, often setting the tone for USD flows across majors. Movements here will heavily influence crosses like EURJPY, EURCHF, and EURGBP.
Key Levels
Support Levels: 1.1637, 1.1561, 1.1542
Resistance Levels: 1.1713, 1.1775, 1.1850 (extended zone)
Stop Loss (SL): 1.1561
Take Profit (TP): 1.1713 (first), 1.1775 (extended)
Summary: Bias and Watchpoints
EURUSD is currently leaning bullish as buyers regain control and push toward 1.1713 and 1.1775. The setup favors upside trades with SL placed below 1.1561 to protect against a sudden dollar rebound. The critical watchpoints remain US inflation data and eurozone CPI, both of which could dictate near-term momentum. With the Fed more likely to cut rates sooner than the ECB, the short-term balance tilts in favor of euro strength, keeping this recovery path intact as long as 1.1561 holds.

EURUSD-H4-Bear or Bull but Bear short-term (TP1.15435)Currently, Daily chart indicates EU goes to Down.
But the major trend is still under Bull.
I decide trade SELL for short term as shown below.
H4 Trading.
SL : 1.16474 (1.16309)
TP : 1.15435
If price is dropped 1.14480 below, then, Major Trend will change to Bearish.
Good Luck.

EUR/USD Technical AnalysisThe EUR/USD pair continues to trade within a well-defined ascending channel on the 15-minute chart. Price is currently testing the lower boundary of the channel around 1.1623, showing early signs of support as buyers attempt to defend this key zone.
From a structural standpoint, the uptrend remains valid as long as the lower trendline holds. The RSI shows mild exhaustion on the downside, suggesting a potential short-term rebound. In addition, the price aligns closely with the 38.2% Fibonacci retracement of the recent upward leg, adding further confluence to this support area.
Support zone: 1.1610 – 1.1620
Resistance zone: 1.1648 – 1.1660
Trend bias: Intraday bullish while above 1.1610
Strategy:
Buy zone: 1.1620 – 1.1615
Take profit: 1.1648
Stop loss: 1.1610
If the pair manages to sustain above 1.1620, a rebound toward the upper channel boundary near 1.1648 remains highly probable. However, a decisive break below 1.1610 would invalidate the bullish setup and could trigger a short-term correction toward 1.1580.
Traders are advised to monitor the 1.1620 key pivot for directional clues as the European session unfolds.
Remember to follow this analysis for continuous EUR/USD updates and refined entry setups based on real-time market reaction.

EURUSD Finds Its Footing Bulls Step Back In.EURUSD continues to recover from its support zone after a clean rebound, showing signs of a short-term bullish correction. The pair formed a Fair Value Gap (FVG) and now aims to retest the resistance area as buyers step in above key intraday support.
Key Levels:
Buy Entry: 1.16150
Take Profit: 1.16450
Stop Loss: 1.15990
Reasoning:
Technically, the market has confirmed a break of structure followed by strong rejection from the support zone, forming higher lows that signal bullish intent. The FVG area supports the idea of a potential push toward resistance.
Fundamentally, slight weakness in the U.S. dollar and improving Euro sentiment ahead of upcoming data favor a short term upside move.
Disclaimer:
This analysis is for educational purposes only and not financial advice. Always manage risk before executing any trade.

It's a pretty recognizable structure. The assault on the historic peak of $1.60 begins.
Given the monetary situation in the US, this seems logical.
The candles will enter the red cloud and begin to break through this resistance.
EUR/USD Bearish Setup – Liquidity Zone or Last Stand for Bulls?💼 EUR/USD “FIBRE” – Metals Market Profit Playbook (Swing / Day Trade)
Plan: 🐻 Bearish Setup
EUR/USD (aka “The Fibre”) is stepping into a profit ambush zone!
Price currently approaching a liquidity trap region, where sellers have quietly stacked their orders like it’s a secret vault raid.
📉 Technical Breakdown:
Price tapping into Police Barricade Resistance Zone @ 1.1500 🧱
Market showing overbought conditions with divergence signals flashing red 🚨
Strong supply block + liquidity trap = high probability rejection zone
Momentum losing steam — bears could reload for another downside sweep 💣
🎯 Target: 1.1500 zone (expected rejection region)
🧨 This area is where the “Police Barricade” holds strong — better take your profits before the market cuffs your gains.
💣 Stop-Loss (Thief’s personal SL): 1.1650
⚠️ Dear Ladies & Gentlemen (Thief OG’s), I’m not recommending to copy my SL — it’s just my personal risk plan. You can trade your own story, make your own money, and take your profits responsibly.
🧩 Related Market Correlations to Watch
Keep an eye on these correlated pairs — they often move in sync or opposite flow with EUR/USD:
💵 TVC:DXY (US Dollar Index) → Inverse correlation; if DXY rises, EUR/USD usually dips.
💷 FX:GBPUSD (“Cable”) → Tends to follow similar directional flow with EUR/USD.
💴 FX:USDJPY (“Ninja”) → Watch for dollar strength confirmation.
OANDA:XAUUSD (Gold) → Dollar sentiment can reflect through gold momentum.
📊 These pairs give confirmation clues — when the dollar flexes, the Fibre usually folds.
💬 Final Words from Thief OG
This analysis isn’t a financial signal — it’s my Thief-style trading playbook, crafted for entertainment and education only.
Trade smart, respect your risk, and remember — every profit is a successful heist only if you exit before the market catches you. 😎💰
✨ “If you find value in my analysis, a 👍 and 🚀 boost is much appreciated — it helps me share more setups with the community!”
Disclaimer: This is a Thief-style trading strategy just for fun and educational insights only. Not financial advice.
#EURUSD #ForexAnalysis #SwingTrade #DayTrading #PriceAction #TechnicalAnalysis #DXY #Fibre #ForexCommunity #TradingView #BearishSetup #SmartMoneyConcepts #LiquidityTrap #SupplyDemand #FXStrategy

EurusdEUR/USD on the daily timeframe is in a downtrend, and it bounced up to the golden Fibonacci zone with confirming candles signaling the end of the correction.
Attached are the targets from my personal view

EURUSD - BUY Now TP : 1.1705I had failed my trade.
Now, the 1HR Bull has been confirmed.
My TP : 1.1705 or 1.17347.
SL : 1.163
Good luck.

A second chance entry on a high probability structure setupYesterday I posted an idea for a High Probability Market Structure Setup (Short) on EUR/USD.
Here
Based on market structure statistics, we observe that the last internal low has a 69% probability of being broken - providing very favorable probabilities for short biased trades.
The move kicked off with the smallest of inducements (smaller than we were expecting) and many may have missed the entry.
This idea provides a second chance entry level to take advantage of the statistical advantage we have on this trade.
Here are the details:
The level we can look to short from is the 1- VWAP (anchored to prior internal low) and 2- The LVN (low volume node) in the volume profile for the last push to the upside.
The confluence of these two factors make this level a high probability entry area to take advantage of further downside.
You can play this entry two ways:
1- Risk entry right on the level
2- Confirmation entry:
Drop down to a 5 or 15 minute timeframe and wait for the first bearish imbalance (Fair Value Gap). Set a limit entry order on that FVG, with your stop just above the high preceding the FVG.
If you choose a Risk entry, you'll have to consider a wider stop - which I'd recommend is near the SD1 band of the VWAP (first band above the vwap).
However, even with that wide of a stop, you still have a very favorable risk to reward as we're playing a break of the prior internal low.
Trade smart,
Cheers!

Bullish on USDThe USD has been showing strength lately, but the question is how much further can this bullish momentum really go?
We’ve had supportive fundamentals (resilient economy, cautious Fed, geopolitical risk premium), yet at the same time, inflation data and dovish expectations for 2025 rate cuts are slowly capping that upside.
Technically, DXY is approaching key resistance zones - so while the bias remains bullish for now, it’s worth asking whether this is the final leg before a broader correction.
In short: still bullish, but with one foot on the brake.
