Eurusd possible reversal spottedI am not sure if someone out there is gonna take this trade with me, but this is what I see happening over the next couple of weeks probably.
Trade ideas

EURUSD BUY!!Price reacted inside a 2hrly breakerblock , then created clear a break of the last height , anticipating price to come back into the orderblock below before moving to target.

EUR/USD – Triangle Breakout After Fed’s Cautious CutThe Fed cut rates by 25 bps, but Powell’s cautious tone killed the dovish mood — hinting this might be the last cut for a while. That shift powered the USD back up, leaving the euro on the defensive.
Technically, EUR/USD broke out below a contracting triangle that had been squeezing price for days. The breakout near 1.1615 shows that the range has resolved to the downside, confirming fresh bearish momentum. As long as the pair trades below 1.1650, I’m eyeing 1.1550–1.1530 as the next target zone.
For me, both sides align perfectly — fundamental disappointment + technical breakout = clean bearish setup.

Short trade
📘 Trade Journal Entry
Pair: EURUSD
Direction: Sell-Side Trade
Date: Thu 30 Oct 25
Time: 3:30 am
Session: London Session AM
Timeframe: 15 Min
🔹 Trade Details
Metric Value
Entry 1.16190
Profit Level (TP) 1.15480 (+0.61%)
Stop Level (SL) 1.16379 (–0.16%)
Risk–Reward (RR) 3.76 R
🔸 Technical Context
Market Structure:
Price printed a lower-high formation following a weak London open. After multiple sweeps above intraday liquidity, the pair shifted structure with a clear CHOCH (15 min) and BOS confirmation.
Key Zones:
Entry Zone: 1.1618 – 1.1620 (Sell-side rejection area / FVG 15 min)
Target Zone: 1.1548 – 1.1540 (Demand + daily low cluster)
Stop Zone: Above previous swing high and adaptive MA crossover
Confluences:
Price rejection at KAMA (adaptive MA) acting as dynamic resistance.
5 min BDS and FVG overlap aligned with premium pricing.
Volume expansion on the bearish impulse post-CHOCH.
Liquidity draw visible below prior daily lows (1.1550 handle).
🔹 Narrative & Bias
The short entry follows a liquidity sweep + structure break model within the London session.
The 15 min CHOCH signalled that buy-side liquidity was exhausted, creating a sell-off aligned with the higher-timeframe narrative of Euro correction and renewed USD demand.
Sentiment Context:
Macro tone supported by stronger USD data and intraday Dollar index recovery.
Euro showing exhaustion after prior session rallies; correlated GBP pairs confirm relative Euro out-performance but broader USD dominance.
Projection:
Expect price to continue seeking sell-side liquidity toward 1.1550 – 1.1540 before consolidation or a retracement into the broken structure zone for potential re-entry.

EURUSD Long: Buyers Targeting a Move Toward 1.1670 ResistanceHello traders! EURUSD has recently shown a structural shift after forming a strong rejection from the Demand Zone near 1.1560, which also acted as a key pivot area. This reaction marked the end of the previous bearish phase inside the Descending Channel, leading to the formation of a new Ascending Channel — indicating the potential start of a medium-term recovery.
After the price reached the Supply Line, a fake breakout occurred around 1.1670, followed by a brief pullback to retest the lower boundary of the channel. This move trapped early sellers, and the quick rebound suggests that buyers are still active and defending the structure.
At the moment, EURUSD is trading around 1.1640, aiming for another test of the 1.1670 resistance zone, which aligns with both the supply line and the upper boundary of the channel. A successful breakout above this area could confirm bullish continuation, targeting higher levels. However, a strong rejection from this resistance might trigger another short-term correction back toward 1.1600–1.1580, where demand could once again reappear. Overall, the structure remains bullish-to-neutral in the short term, with 1.1670 acting as the critical breakout level to watch. Manage your risk!

EURUSD Ready for a Downside Reversal | Strong Sell SetupEURUSD – SELL IDEA 🔥 | Strong Rejection from Key Resistance Zone
📉 SELL @ 1.1640
🎯 Targets:
• TP1 → 1.1600 ✅
• TP2 → 1.1550 ✅
• TP3 → 1.1500 ✅ (Extended Target)
⛔ Stop Loss: 1.1700
⸻
📌 Analysis
EURUSD is showing strong bearish pressure after rejecting the 1.1650 resistance area, where sellers previously dominated.
Key reasons for this setup:
✅ Price failed to break above major structure resistance
✅ Bearish candlestick formations confirm sellers are active
✅ DXY strength increasing = Pressure on Euro
✅ Risk-to-Reward ratio favorable (R:R > 2)
If price breaks below 1.1600, downside momentum could accelerate toward 1.1550 & 1.1500.
⸻
⚠️ Risk Management
Forex is a probability game, not certainty.
Always use a Stop Loss and avoid over-leveraging.
⸻
✅ Follow for More
If you find this helpful, follow me for daily profitable setups and send me a message for guided trading support. 🚀📈

EURUSD Bullish Continuation: VWAP & Volume Profile Trade PlanI’m currently analyzing EUR/USD, and on the 4-hour timeframe, the pair continues to show a strong bullish trend 📈. Earlier in the session, price broke structure to the upside, confirming bullish intent.
In this breakdown, we utilized both the VWAP and the Anchored Volume Profile 🧭 to plan a potential trade setup — focusing on how these tools help identify key liquidity zones, volume imbalances, and value areas.
We also discussed broader market structure, price action, and the three-drive pattern 🌀 — demonstrating how combining these concepts can give traders a strategic edge in timing entries and managing risk.
As always, this is not financial advice — purely educational content intended to enhance your market analysis skills. ⚠️

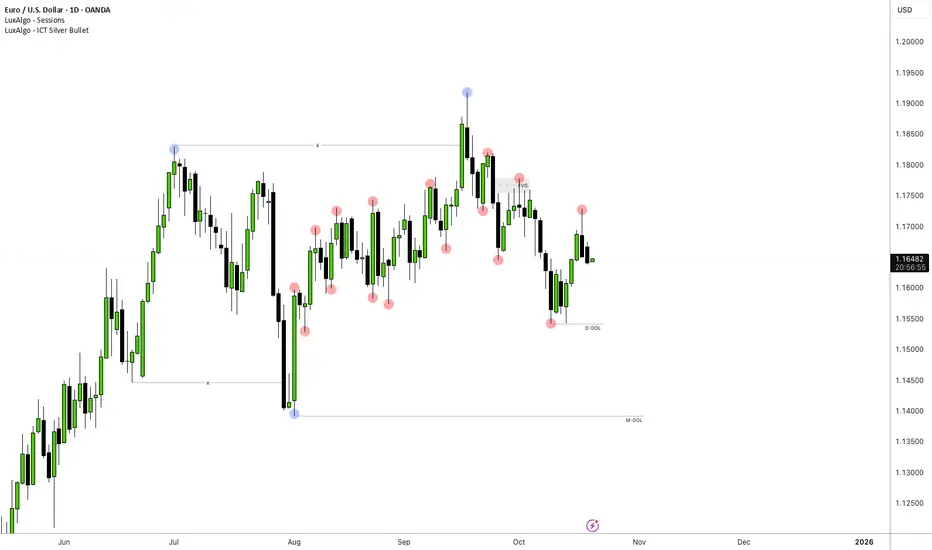
EUR/USD – Buyer Zone Activation | Wave Projection 🌊We’re currently watching EUR/USD retrace into the buyer zone (1.1620–1.1645).
This area aligns perfectly with Wave D of the ongoing corrective structure, setting up for a potential Wave C impulse toward 1.16925.
📊 Technical Outlook:
Structure: ABCD completion before impulsive C
Key Support Zone: 1.1620–1.1645
Target Zone: 1.1690–1.1700
Bias: Bullish from buyers’ zone
Timeframe: 1H
⚠️ Invalidation:
If price closes below 1.1620, structure may extend into a deeper correction.
🧠 Insight:
Smart money often accumulates within such retracement zones before the next impulsive leg. Patience at key levels builds confidence and accuracy.


Eurusd Longs Looking for a long with rsi below 30 and we have a Weekly low with p line trade. Looking for a recovery after fomc

EUR/USD H1 SMC Bearish Order Block PlayThe EUR/USD H1 chart signals a potential bearish move after price action showed rejection from two marked supply order blocks. The recent Change of Character (CHOCH) and Break of Structure (BOS) confirm a shift from an uptrend to a downtrend, indicating that sellers are now in control. With price failing to make new highs and reversing at supply zones, the likelihood increases for a move to the next lower support area around 1.15764.
This analysis is based on observing where major buy and sell orders cluster in the market, known as order flow, along with identifying key supply and demand levels. If sellers maintain control, EUR/USD could continue its decline as mapped on the chart.
This analysis is for informational purposes only and does not constitute financial advice. Trading forex involves significant risk of loss and is not suitable for all investors, especially due to leverage and volatility. Always conduct your own research, consider your risk tolerance, and consult with a licensed financial advisor before making trading decisions. Past performance does not guarantee future results, and no responsibility will be accepted for any loss incurred from relying on this

EURUSD Buy Setup | Liquidity Sweep + OB + LTF Confirmation📈 On EURUSD , the market has been moving within a corrective phase, showing early signs of potential bullish reaction zones forming.
There’s a clear liquidity pool from the Asian session, and just below that sits a bullish Order Block (OB) — the perfect area for smart money to accumulate orders before driving price higher.
💧 Liquidity Context:
During the Asian session, the market built liquidity both above and below short-term structure.
Now, we can see resting liquidity above the OB, which makes this area a prime zone for manipulation and reversal setups.
The plan is to wait for the market to sweep all liquidity — including Asian highs/lows and inducement above OB — before reacting from the OB zone.
💡 Setup Plan:
1️⃣ Wait for the Asian session liquidity to be taken — price should collect liquidity above OB.
2️⃣ Once the liquidity sweep is done and price taps into the OB, focus on the Lower Timeframe (LTF) (1M–5M) for strong bullish confirmation.
3️⃣ Confirmation examples:
✅ Clear MSS / CHOCH in the bullish direction,
✅ Strong rejection candle or engulfing formation,
✅ LTF structure shift forming higher highs & higher lows.
4️⃣ After confirmation, we’ll plan for buy entries, following the new order flow shift upward.
5️⃣ If no LTF confirmation, no trade — patience is key 🧘♂️
🎯 Target:
Aim for the next swing high, liquidity pool above recent structure, or potential intra-session high depending on momentum.
🧩 Setup Summary:
Market Bias → Bullish (Liquidity + OB Reaction)
Confluence → Asian Session Liquidity + OB + Inducement Sweep
Entry → Only after strong LTF confirmation (1M–5M)
Target → Next Swing High / Liquidity Pool Above
Type → Scalp to Intraday Buy Setup
Risk Rule → Confirmation required — no confirmation, no entry ❌
⚠️ Disclaimer:
This is my personal analysis and not financial advice.
Always confirm with your own analysis and manage risk properly before executing any trade.

EURUSD FRGNT Daily Forecast 2 - Q4 | W44 | D28| Y25 | 📅 Q4 | W44 | D27| Y25 |
📊 EURUSD FRGNT Daily Forecast 2
🔍 Analysis Approach:
I’m applying Smart Money Concepts, focusing on:
Identifying Points of Interest on the Higher Time Frames (HTFs) 🕰️
Using those POIs to define a clear trading range 📐
Refining those zones on Lower Time Frames (LTFs) 🔎
Waiting for a Break of Structure (BoS) for confirmation ✅
This method allows me to stay precise, disciplined, and aligned with the market narrative, rather than chasing price.
💡 My Motto:
"Capital management, discipline, and consistency in your trading edge."
A positive risk-to-reward ratio, paired with a high win rate, is the backbone of any solid trading plan 📈🔐
⚠️ Losses?
They’re part of the mathematical game of trading 🎲
They don’t define you — they’re necessary, they happen, and we move forward 📊➡️
🙏 I appreciate you taking the time to review my Daily Forecast.
Stay sharp, stay consistent, and protect your capital
— FRNGT
OANDA:EURUSD


EURUSD 1H TF Forecast. I'm using Order flow and FVGsEURUSD 1H TF Forecast. I'm using Order flow and FVGs

EURUSD Daily TF Forecast. I'm using Order flow and FVGsEURUSD Daily TF Forecast. I'm using Order flow and FVGs

Can EUR/USD Continue Lower? MA Breakout Signals Weakness📊 EUR/USD "The Fiber" - Bearish Breakout Setup | Thief's Layer Entry Strategy 🎯
🔍 Market Overview
Asset: EUR/USD (The Fiber)
Market: Forex
Strategy Type: Swing/Day Trade
Bias: 🐻 BEARISH CONFIRMED
📉 Technical Analysis
The Euro has shown bearish momentum with a confirmed moving average breakout to the downside. This technical signal suggests potential continuation of the downtrend as sellers maintain control. The setup presents a structured approach for traders looking to capitalize on this bearish pressure.
🎯 The "Thief Strategy" - Layered Entry Approach
💡 What's the Thief Strategy?
This method uses multiple sell limit orders (layering technique) to scale into positions after confirmation. Think of it as setting multiple traps at key levels rather than going all-in at once!
📍 Entry Levels (Sell Limit Layers):
⚠️ CRITICAL: Only set these limit orders AFTER the breakout is confirmed. Don't jump the gun!
Layer 1: 1.16200
Layer 2: 1.16000
Layer 3: 1.15800
Layer 4: 1.15600
Note: You can add more layers based on your risk appetite and account size
🛑 Stop Loss:
Thief's SL: 1.16600
⚠️ Risk Disclaimer: This is my stop loss level, but YOU are the captain of your own ship! Set your SL based on YOUR risk tolerance and account management rules. Trade at your own risk, legends!
🎯 Take Profit Target:
Primary TP: 1.14400
Why this level?
✅ Strong historical support zone
✅ Oversold conditions likely
✅ Potential bull trap area
💰 Smart Money Move: Consider taking partial profits along the way and secure your gains before the target. Don't be greedy, be strategic!
⚠️ Profit Disclaimer: This is my target, but remember - YOU decide when to take YOUR money off the table. Manage your trades actively!
🔗 Related Pairs to Watch (Correlation Play)
Keep an eye on these correlated pairs for confluence:
GBP/USD (Cable) - Often moves in tandem with EUR/USD; bearish EUR typically means bearish GBP
DXY (US Dollar Index) - Inverse correlation; strong DXY = weak EUR/USD
EUR/GBP - Cross pair that shows relative Euro strength/weakness
XAU/USD (Gold) - Risk-off asset; if EUR falls alongside gold, confirms broader USD strength
🇺🇸 Key Point: This setup assumes USD strength. Watch Federal Reserve commentary and US economic data for catalysts that could accelerate or reverse this move.
⚙️ Trade Management Tips
✅ Wait for confirmation before setting limit orders
✅ Scale in using the layer strategy - don't use full position size on one entry
✅ Move SL to breakeven after Layer 2-3 fills
✅ Take partial profits at psychological levels (1.15000, 1.14500)
✅ Monitor DXY and US data for trend continuation signals
📊 Risk-Reward Profile
With proper layering and stops:
Potential Risk: ~40-60 pips (depending on entry)
Potential Reward: ~160-180 pips to target
R:R Ratio: Approximately 1:3+ 🎯
🎭 The Thief's Final Word
This is a strategic layered approach designed for traders who prefer calculated entries over gambling. The market is a game of probabilities, not certainties. Stay sharp, manage your risk, and remember - preserve capital first, make profits second!
Happy hunting, Thief OG's! 🏴☠️💰
✨ If you find value in my analysis, a 👍 and 🚀 boost is much appreciated — it helps me share more setups with the community!
⚠️ Disclaimer
This analysis represents the "Thief Style" trading strategy and is shared for educational and entertainment purposes only. This is NOT financial advice. Forex trading involves substantial risk of loss. Always conduct your own research, use proper risk management, and never trade with money you cannot afford to lose. Past performance does not guarantee future results.
#EURUSD #Forex #ForexTrading #TechnicalAnalysis #PriceAction #SwingTrading #DayTrading #TheFiber #BearishBreakout #LayerEntry #ForexStrategy #ForexSignals #TradingView #ForexAnalysis #USD #CurrencyTrading #ForexSetup #RiskManagement #TradingStrategy #ForexCommunity

EURUSD 1H TF Ideaif the price hold at 70% Fib then
higher time frame trend will continue
everything is on the chart
Goodluck

EURUSD Weekly DowntrendIts that time for a continuation. From a weekly standpoint we have been in a downtrend for quite some time. Markets appear erratic with whats going on. I foresee a drop in the EUR between now and 2028.
Alex

EURUSD Smart Money Setup in Action FVG + OTE ConfluenceHello Billionaires!!
The EURUSD is showing a clean Smart Money Concept (SMC) setup — a potential short opportunity forming after multiple liquidity sweeps and Fair Value Gap (FVG) fills.
📊 Market Insights:
🟣 OTE Zones perfectly aligned with previous premium areas
🔵 FVG acting as a retracement zone before bearish continuation
🔻 Liquidity Sweep above short-term highs before reversal
🟧 Targeting the BPR / Demand zone around 1.1480–1.1500
⚙️ Bearish momentum expected after internal liquidity grab near 1.1600–1.1620
💡 Smart Money Outlook:
Price likely to retrace into FVG or OTE zone, mitigate imbalances, and continue bearish toward the discount zone for deeper liquidity collection.

EURUSD Will Go Lower! Sell!
Take a look at our analysis for EURUSD.
Time Frame: 2h
Current Trend: Bearish
Sentiment: Overbought (based on 7-period RSI)
Forecast: Bearish
The market is approaching a key horizontal level 1.160.
Considering the today's price action, probabilities will be high to see a movement to 1.157.
P.S
The term oversold refers to a condition where an asset has traded lower in price and has the potential for a price bounce.
Overbought refers to market scenarios where the instrument is traded considerably higher than its fair value. Overvaluation is caused by market sentiments when there is positive news.
Like and subscribe and comment my ideas if you enjoy them!

