EUR/USD long: Roll with the punchesHello traders
My last trade worked out as expected but needed some intensive care for a few hours.
My opinion is that this two steps forward, one step back, is the prevailing market mood with all the uncertainty and chaos created by the current administration. So, roll with the punches and keep the position sizes realistic.
I have entered into a long position.
The charts support the idea with weekly closes still ticking higher. The data that may move markets this week will be Euro Zone PMI's and USD jobless claims AND CPI. Both readings will be critical to determine the FOMC rate decision on October 29th.
However, do not get too excited about this data(unless it is way out of line with the forecasts) or even the FOMC rate decision.
The Supreme Court decision on upholding or overturning the legality of the sweeping tariffs will determine where markets are heading for some time to come. This decision will likely come down within the first two weeks in November. So, it may be a Happy or Unhappy Thanksgiving this year. The price of gold, the fear factor trade, is not comforting for what the market is expecting.
The American consumer is struggling. Credit card debit hit $1.21 trillion at the end of the second quarter which is a clear indication of the carnage these tariffs are causing.
As always, do your own research and make your own decisions on profit and stop levels.
Best of luck
Trade ideas

EURUSD LONGEURUSD shows bullish move last week which makes the structure bullish as well. I would like to join the trend. I can see continuation slcalled SNRC1.
Re-entry setup of daily, aligned with bystra SNRC1

EURUSD Oct. 20, 2025The information and publications are not meant to be, and do not constitute, financial, investment, trading, or other types of advice or recommendations.

Analyzing Market Structure, Order Blocks, and Liquidity: A EUR/UBased on the technical analysis and annotations provided on the EURUSD 1-hour chart, here are the possible entry areas for long and short positions.
This analysis is based on "Smart Money Concepts" (SMC) principles like Break of Structure (BOS), Order Blocks (OB), and Liquidity Sweeps (LS) indicated on your chart.
Potential Long (Buy) Entry
The chart identifies a clear area of interest for a long position, based on a recent bullish shift in market structure.
Reasoning: The price created a "Swing Low" and then rallied, causing a bullish "Break of Structure" (BOS). In this trading style, traders look to buy when the price pulls back into the demand zone or "Order Block" (OB) that initiated this break.
Area of Interest: The chart has explicitly marked a large green box labeled "H4 OB" (a 4-Hour Order Block), which sits directly on top of the "Swing Low." This is the primary demand zone.
Possible Entry Price: The potential long entry zone is the entire area defined by this green box, which is approximately between $1.1536 (the "Swing Low") and $1.1590 (the top of the H4 OB).
Potential Short (Sell) Entry
A short position would be based on the idea that the overall bearish trend (as seen from the "Swing High" and multiple downside "BOS") is still in effect, and the recent rally was just a pullback.
Reasoning: The most recent rally (starting from the "Swing Low") stopped and reversed after running into a key supply level. This level is marked with "LS" (Liquidity Sweep), indicating that price swept the liquidity resting above a previous high before turning lower.
Area of Interest: The most logical supply zone for a short entry is this recent high, where the liquidity sweep occurred.
Possible Entry Price: A potential short entry would be on a retest of this supply zone, which is approximately at $1.1715 - $1.1720.

Nothing to do on EUR/USD but Wait - A BIG Move is Coming! 10/20In today´s video I explain how this chops comes really as no surprise as we remain within the moving averages until the markets decides what to do.
In the mean time, unless you´re a pro scalper, I recommend taking the day to prepare for this upcoming breakout. For this you´ll need to know what to look for, this video also explains briefly how this will come to pass, both in case of a bullish or a bearish scenario
As always if you have any questions don´t hesitate to ask


EURUSD: Bulls Are Winning! Long!
My dear friends,
Today we will analyse EURUSD together☺️
The market is at an inflection zone and price has now reached an area around 1.16566 where previous reversals or breakouts have occurred.And a price reaction that we are seeing on multiple timeframes here could signal the next move up so we can enter on confirmation, and target the next key level of 1.16659.Stop-loss is recommended beyond the inflection zone.
❤️Sending you lots of Love and Hugs❤️

EUR/USD (15-Minute Timeframe) - LONGTrading Idea: EUR/USD (15-Minute Timeframe)
This setup focuses on a Liquidity Sweep and Last Breakdown Low (LBL) concept.
Market Context:
The market has been in a downward structure, forming lower highs and lower lows. After a strong bearish leg, price consolidated near the previous structural low area, indicating potential liquidity buildup below that level.
Key Levels & Concepts:
LBL (Last Breakdown Low):
The LBL marks the point where price previously broke structure to the downside, creating a key area of interest for potential liquidity grabs.
As shown, price swept liquidity below this level, grabbing stop-losses of early buyers before reacting sharply upward.
Liquidity Sweep (xxx Liquidity Sweep xxx):
Price made a false move below the LBL to collect liquidity, then reversed, signaling potential short-term bullish intent or relief rally.
Equal Highs (Label “1”):
The prior equal highs around 1.1675 acted as liquidity resting above, serving as a clear target for the market before the next bearish continuation.
Trading Idea:
Scenario 1 (Bullish Reversal):
If price holds above the LBL after the liquidity sweep and confirms a higher low on the lower timeframe, it may push back toward the equal highs at 1.1675 for a short-term retracement play.
Scenario 2 (Bearish Continuation):
If price fails to sustain above LBL and reclaims the liquidity zone (gray area), it signals continuation to the downside, targeting lower liquidity zones around 1.1635–1.1640.
Bias:
Short-term bearish, until a confirmed break and retest above 1.1675.

EUR/USD - Long BIAS Analysis EUR/USD Long Bias Analysis 💶📈
The price has recently swept significant liquidity levels, including the Previous Day’s Low (PDL), the prior Asian session low, and the London session low.
We also have previous Asia Low and London Low forming EQ Lows right above our POI.
This liquidity grab aligns with a key point of interest (POI), identified as an unfilled Fair Value Gap (FVG) on the daily timeframe.
From this POI, we anticipate a bullish reaction, with price likely to rebound towards out draw on liquidity (DOL), targeting the London session high and an unfilled Sell-side Imbalance Buy-side Inefficiency (SIBI) on the H4 timeframe.

EURUSD Bulls and BearsFor a moment I have softened my consecutive bullish position stance following an observation of recent performance of the pair. Today I maintain that the momentum is fading away unless there is an introduction of a new catalyst as the CPI. Trump already softened the 100% tariff on China which has resulted to a slow down in bullish momentum as opposed to last week. Where the pair is we are likely to experience a short term sell in form of an aim to reverse. But also close to 1.15800 to 1.1500 zone we are likely to experience some buyers with an aim to maintain the bullish trajectory and retest on the reversal.
What I can do for this week given that the month is also coming to an end is focus on buying or selling those key points indicated on my chat towards CPI.

Uptrend in EURUSDThe trend of this currency pair is completely bullish according to the previous analysis, we can expect the price to correct and then move upwards. Personally, I would wait for the price to correct first and then enter the trade.

A retest of a key level on EURUSDA key level is being retested on the EURUSD pair. Moreso, there are liquidities just above the order block. I will wait to see how the order block will react before going in. Happy trading!


EURUSD BUY ORDER SIGNALS!!!!!!!EURUSD bias still remains bullish we are only watching to see price revisit 1.15772 which is a minor pull back for the big rally to the upside I will be on watch once price hits my POI for a possible entry opportunity...


EURUSD: USD sentiment holds firmDuring the previous week market sentiment on the US market was led by fundamentals, considering that there are still no official macro data posted, due to the Government “shutdown”. The US President commented on social networks on Friday that 100% tariffs on China imports is not quite sustainable. Previously, Fed Chair Powell was a guest at NABE Conference, where he noted that further cuts are still on the table, but their timing will depend on data. The market reacted positively to both statements.
The Wholesale Prices in Germany were higher by 0,2% in September, or 1,2% on a yearly basis, which was a bit higher from forecasted -0,1% m/m and 0,9% y/y. Inflation rate final for September in Germany was standing at 0,2% in September and 2,4% y/y, in line with market consensus. The ZEW Economic Sentiment Index in October for Germany reached 39,3 which was a bit higher from forecasted 38. The Industrial Production in the Euro Zone in August was down by -1,2% for the month, leading to an increase of 1,1% for the year. Both figures were better from forecasted -2,2% m/m and -0,7% y/y. The Inflation rate in the Euro Zone final for September was standing at 0,1% for the month and 2,2% on a yearly basis.
Regardless of a “shutdown” it could be noted that the general sentiment toward the US Dollar was positive during the previous week. The week started by USD further strengthening, where the level of 1,1560 was tested again on Monday and Tuesday. However, as this level could not be breached, the market reverted toward the upside, where a short term resistance and 1,17 has been tested on Friday. The RSI moved toward the level of 37, but a clear oversold market side has not been reached on this occasion. The index is still moving below the level of 50. The MA50 started to modestly converge toward the MA200, but the distance between lines shows that there will not be a cross in the future period.
Without a strength to break the 1,16 level, the market reverted its course to the 1,17 resistance. At the start of the week, it could be expected that this level will be tested for its potential for higher levels. In case that 1,17 is breached, then the next stop of eurusd will be between 1,1780 and 1,8 levels. In case that the market reverts back for one more time, then 1,16 is the level to watch.
Important news to watch during the week ahead are:
EUR: Producers price Index in Germany in September, HCOB manufacturing PMI flash for October for Germany,
USD: Existing Home Sales in September, Inflation rate in September, University of Michigan Consumer Sentiment final for October. Due to Government “shutdown” in the US, it is unclear whether other important macro data for the US will be posted.

Demand Zone in Focus: MSS Shift Signals Potential LongHello Traders,
Wishing everyone a productive week ahead! Today, price action is sitting at a clearly defined demand zone, and we’ve just seen a shift in market structure (MSS). Based on this, I’m looking to go long from the potential demand area.
However, keep in mind there’s still a strong external bearish trend. For added confirmation, consider waiting for a break of the last lower high (LH) before entering a long position.
Stay sharp and trade safe! 💪

POSSIBLE FLUECUTATION OF EURUSD 20-24 OCT 25 If we have a favorable economic calendar this week, we may see an initial bullish price action up to 1.16900, followed by a bearish movement down to 1.16490

Nasdaq, Bitcoin, Gold, Dollar Index and Fiber Weekly OutlookMajor insights on all the above instruments and the possible draw on liquidity along with entry mechanisms.

Monday Setup You Don’t Want to Miss | EUR/USD ForecastWelcome traders! 👋
I’m glad to have you here — we’re all learning and growing together in this amazing trading journey.
Let’s dive into today’s analysis on EUR/USD 👇
🧠 Weekly Outlook (October 21st – Monday)
On the weekly timeframe, EUR/USD remains in a bullish trend.
However, this week we might see liquidity sweep below the double-bottom lows, with potential movement toward the 50% of the previous weekly candle’s wick — a key zone that may get filled.
On the daily timeframe, the pair is still bearish, currently in a bullish corrective phase.
Meanwhile, on the 4-hour timeframe, buy-side liquidity has been taken and price started dropping afterward.
🎯 Monday Scenarios
I’m watching two possible setups for the start of the trading week:
Scenario 1:
Price reacts to the 4H imbalance / supply zone (P.I.), then drops toward the identified liquidity pool (X – Obstacle zone).
Scenario 2:
Price skips the 4H P.I. zone, drops directly, and sweeps sell-side liquidity below the recent lows.
Remember: The market is never 100% certain.
Always wait for confirmation before entering any trade, manage your risk wisely, and keep an eye on economic news this week.
⚠️ This analysis is valid for Monday only.
Let me know your thoughts below 💬
Do you agree with this outlook or see a different setup forming?
📘 Educational Note:
This analysis is for educational and illustrative purposes only.
Always follow your own plan, confirm with your strategy, and manage risk carefully.
Success in trading comes from discipline, patience, and consistency. 💪
🚀 Empowering traders through clarity, confidence & clean charts.
Follow 👉 parisa_tl for more liquidity setups and weekly insights 💙
#EURUSD #forexanalysis #smartmoneyconcepts #smcstrategy #forexeducation #priceaction #tradingpsychology #liquiditytrading #forexsetup #eurusdforecast #mondayanalysis #forexcommunity #marketstructure #fxtrader #eurusdstrategy #forexmentor #technicalanalysis #forexcharts #fxsetup #supplyanddemand #forexsignals #smartmoney #fxinsight #smccommunity #forexlife #tradingview

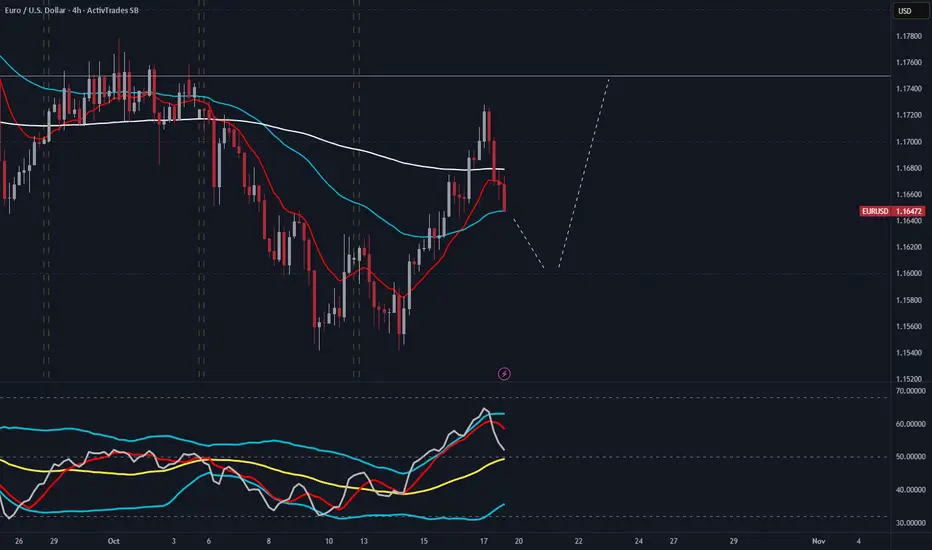
EUR/USD 4H Analysis EURUSD provided a double bottom and rallied it's away towards 1.17 then pulling back shortly after. I'd like to see the market reverse and continue the bullish rally after it's done with the pullback.
EURUSD: Bullish Continuation & Long Signal
EURUSD
- Classic bullish setup
- Our team expects bullish continuation
SUGGESTED TRADE:
Swing Trade
Long EURUSD
Entry Point - 1.1655
Stop Loss - 1.1642
Take Profit - 1.1682
Our Risk - 1%
Start protection of your profits from lower levels
Disclosure: I am part of Trade Nation's Influencer program and receive a monthly fee for using their TradingView charts in my analysis.
❤️ Please, support our work with like & comment! ❤️
