Falling towards key support?Fiber (EUR/USD) is falling towards the pivot which has been identified as an overlap support and could bounce to the 1st resistance.
Pivot: 1.1370
1st Support: 1.1092
1st Resistance: 1.1651
Disclaimer:
The opinions given above constitute general market commentary and do not constitute the opinion or advice of IC Markets or any form of personal or investment advice.
Any opinions, news, research, analyses, prices, other information, or links to third-party sites contained on this website are provided on an "as-is" basis, are intended to be informative only, and are not advice, a recommendation, research, a record of our trading prices, an offer of, or solicitation for, a transaction in any financial instrument and thus should not be treated as such. The information provided does not involve any specific investment objectives, financial situation, or needs of any specific person who may receive it. Please be aware that past performance is not a reliable indicator of future performance and/or results. Past performance or forward-looking scenarios based upon the reasonable beliefs of the third-party provider are not a guarantee of future performance. Actual results may differ materially from those anticipated in forward-looking or past performance statements. IC Markets makes no representation or warranty and assumes no liability as to the accuracy or completeness of the information provided, nor any loss arising from any investment based on a recommendation, forecast, or any information supplied by any third party.
U.S. DOLLAR / EURO REFERENCE RATE
No trades
Trade ideas

EUR/USD – SMT Divergence + Monthly VWAP Zone ReactionEURUSD formed a clear SMT divergence with GBPUSD, showing relative weakness while both pairs pull liquidity from recent lows.
Price is currently trading just under the monthly VWAP and its ±1 deviations, and sits inside a low-volume pocket on the profile.
My expectation:
I'm watching for a short-term push upward into the monthly VWAP deviation / low-volume node to grab liquidity, followed by a rejective move downward.
If confirmed, the next target lies near 1.1490, which aligns with the cleaner liquidity pool

EURUSD – Clean Bearish Setup AheadEURUSD is showing a clean bearish structure. We had a perfect retest of the zone, and as long as price stays below this level, the downside remains the higher-probability scenario.
Risk/Reward on this setup is strong, and the target aligns with the full imbalance correction below.
Let’s see if the market will complete the range

EUR/USD) Bearish trend analysis Read The captionSMC Trading point update
Technical analysis of summary for the EUR/USD H1 chart you shared:
---
Overall Bias: Bearish
Market structure and Smart Money Concepts indicate downside continuation after mitigation of a major H4 Fair Value Gap (FVG).
---
Key Technical Points
Price recently rejected a strong H4 supply + FVG zone
Located around 1.1530 – 1.1565
Price trading below both EMA 50 (blue) and EMA 200 (black)
→ Full bearish momentum alignment
Structure
Lower highs & lower lows forming
Bearish correction pattern drawn indicating continuation wave
Rejection from EMAs acting as dynamic resistance
Target Point 1.14540 – 1.14600
Major demand area & liquidity pool
---
Trade Idea Concept
Entry idea:
Wait for a minor pullback for better entries (in the bearish corrective pattern), preferably near EMA 50 or last supply.
Target:
1.14540 zone
Invalidation / SL level:
Break and close above 1.1565 (top of FVG zone) invalidates bearish setup.
---
Smart Money Concept Interpretation
Supply filled & mitigation done
BOS (Break of Structure) confirmed bearish direction
EMAs provide extra confluence
Targeting liquidity sweep under equal lows area
Mr SMC Trading point
---
Summary
EUR/USD shows high probability for continued downside, respecting premium-to-discount move. As long as price remains below 1.1530 – 1.1565, sellers remain in full control.
---
Please support boost 🚀 this analysis

EURUSD is in a Downside DirectionHello Traders
In This Chart EURUSD HOURLY Forex Forecast By FOREX PLANET
today EURUSD analysis 👆
🟢This Chart includes_ (EURUSD market update)
🟢What is The Next Opportunity on EURUSD Market
🟢how to Enter to the Valid Entry With Assurance Profit
This CHART is For Trader's that Want to Improve Their Technical Analysis Skills and Their Trading By Understanding How To Analyze The Market Using Multiple Timeframes and Understanding The Bigger Picture on the Charts

EURUSD idea 11.11.2025I am watching two potential levels in this market, the first short level is interesting from a liquidity perspective around the price of 1.18 where the daily level is nearby, the next long level could be interesting with the sfp below the current low at a price of around 1.15 where is also vwap


EURUSD – Short-Term Downturn with Rebound ScenarioPrice has extended lower within a descending sequence, and short-term exhaustion could lead to a corrective recovery in the coming sessions. If buyers step in, a push toward the highlighted zone becomes a plausible development as momentum shifts and structure evolves.
Disclosure: We are part of Trade Nation's Influencer program and receive a monthly fee for using their TradingView charts in our analysis.

EURUSD TRADE SETUPWait for retest the entry level and bearish momentum then take a trade for Sell otherwise skip this setup

Analysis of the New Dimension of Multi-Core Logic TradingSubdivided highlights of the economic recovery in the Eurozone provide fundamental support: The Eurozone economy is not completely weak; there are structural recovery highlights that support the euro. The comprehensive PMI in October rose to 52.2, reaching a new high in 17 months, and has maintained an expansionary trend for 10 consecutive months. Among the core economies, Germany performed outstandingly, with its PMI index reaching the best since May 2023. Industrial orders rebounded month-on-month, and export data also showed signs of recovery. As the engine of the Eurozone economy, Germany's recovery provided a solid economic foundation for the euro. At the same time, the Eurozone's CPI rose by 2.2% year-on-year in September, approaching the 2% inflation target of the European Central Bank. This moderate inflation state avoided the risk of deflation and did not require concerns about aggressive policy adjustments due to excessive inflation, creating favorable conditions for the stable strengthening of the euro.
Increased potential weakness scenarios for the US dollar are beneficial for the euro's upward movement: The current resilience of the US dollar is not flawless, and there are multiple factors that may trigger a correction. On the one hand, the market's expectation for a 12-month Fed rate cut has reached 65%. If the subsequent US consumer or employment data shows a slight decline, it will further strengthen the expectation of a rate cut, putting pressure on the US dollar index. On the other hand, the US dollar index has been fluctuating around 99.50 recently, lacking the strong momentum for continuous upward movement. If it fails to break through, a large number of profit-taking sell orders may trigger a rapid decline in the US dollar. While the euro is the main rival currency of the US dollar, it often gains significant upward momentum when the US dollar weakens. This provides a favorable external environment for the euro to rise against the US dollar.
Short-term technical indicators show a bullish launch signal: From the short-term K-line perspective, the euro against the US dollar has formed a small upward trend with gradually rising lows at the 1-hour level. At the indicator level, the 5-day moving average is diverging upward, providing effective support for the exchange rate. Although the MACD indicator once contracted the red energy bar, it showed signs of expanding again after the low point of 1.1515, indicating that the short-term bullish momentum is reaccumulating. At the same time, the recent price movement has seen an increase in trading volume simultaneously, with good volume-price coordination, confirming the validity of the current upward trend, and the RSI indicator is in the neutral to strong range of 55, not reaching the overbought threshold, indicating that there is still upward space in the short term, providing technical basis for short-term bullish trading.
Trading Strategy for EUR/USD
buy:1.15000-1.15100
tp:1.15500-1.15800
sl:1.14800

EURUSD: Targets focus on declines to 1.1480 support levelHello everyone, here is my breakdown of the current Euro setup.
Market Analysis
EURUSD continues to trade within a clear Downward Channel, maintaining a strong bearish structure characterized by consistent lower highs and lower lows. Early in the chart, the pair formed a prolonged Range Phase, signaling indecision before sellers eventually took control and pushed the price downward. After breaking below the range, EURUSD repeatedly retested the Resistance Area around 1.1550, where the market showed strong bearish reactions. Each bounce into this resistance zone resulted in a clear rejection, proving that sellers consistently defend this area. The chart also highlights multiple Breakout attempts, all of which failed to sustain upward continuation, confirming a lack of bullish strength. Additionally, the chart shows the formation of a Triangle Pattern, with price reacting between the Triangle Resistance Line and the Triangle Support Line. Despite temporary recoveries, every move upward was limited and capped by descending trendline pressure.
Currently, EURUSD broke below the minor structure support again, demonstrating that bearish momentum remains dominant. Price is now heading toward the Support Zone near 1.1480, which aligns with both horizontal demand and the Triangle Support Line. This confluence makes it a key level to watch. As long as EURUSD trades below the 1.1550 Resistance Area and stays inside the Downward Channel, the bearish structure remains intact. Any bullish recovery is likely to be corrective rather than trend-changing unless buyers manage to break above major resistance.
My Scenario & Strategy
I expect EURUSD to continue edging lower toward the 1.1480 Support Zone, following the recent rejection from resistance. A minor upward correction may occur, potentially retesting broken support or the Triangle Resistance Line, but such a move would likely be short-lived without strong bullish confirmation.
A confirmed breakdown below 1.1480 would open the path for deeper bearish continuation within the Downward Channel. Only a solid breakout above 1.1550, backed by strong buying pressure, would challenge the prevailing bearish trend. For now, selling the pullbacks remains the more favorable strategy while price stays below major resistance.
That's the setup I'm tracking. Thank you for your attention, and always manage your risk.

[CRT] Early-Week Outlook for EURUSD [Candle Range Theory]Context:
During the week of November 10th, the European currencies EURUSD and GBPUSD attempted to attack their previous weekly high on Friday afternoon, so we speculated that the direction for the week of November 17th would be bearish, targeting the low of the week of November 3rd.
Last week this hypothesis was confirmed, with the weekly candle closing outside the body of the previous one:
For this week:
This week the same thing has happened but in the opposite direction. However, this time it’s different because the move failed while going in the direction of the bias, so we anticipate a bullish start to the week in order to position for new sells:
Although from a CRT perspective, if we drop to the daily timeframe, the range would be invalidated. DXY and GBPUSD do give us directional clues for a small retracement at the start of the week:
Here we can observe DXY:
And here GBPUSD:
Even though we have clearly defined upside targets on GBP and downside targets on DXY, we must not forget that it is very likely they will not be fully completed, since the broader direction for European currencies remains bearish continuation.
So in conclusion, we speculate with more cautious, lower-risk buys at the start of the week, since it makes sense for price to begin by pushing upward — not to shift the overall bias, but to complete the PO3 of the weekly candle. Once that weekly PO3 is formed, we will then look to join the sells when direction realigns with the broader bearish continuation.
Wishing everyone many profits!

EURUSD Weakens at Resistance — Pullback Toward 1.1480 ExpectedHello traders! Let’s break down the current EURUSD structure. EURUSD continues to trade inside a broad descending channel, where both the resistance and support lines have been respected multiple times, forming a steady sequence of lower highs and lower lows. Each touch of the upper boundary resulted in a clear Turned Around reaction, confirming the strength of seller control within the overall bearish trend. Earlier, the pair entered a range phase in the left section of the chart, where price consolidated before breaking to the downside. This breakout accelerated bearish momentum, pushing EURUSD toward the lower half of the channel. Subsequent attempts at recovery formed shallow corrections, each aligning with the mid-channel dashed trendline, signaling persistent downward pressure. Recently, price approached the Buyer Zone near the 1.1480–1.1500 region, which also overlaps with the broader Support Level and the lower boundary of the descending channel. This area has previously acted as a strong reaction zone, and buyers are once again attempting to hold this level. At the moment, the EURUSD pair is showing early signs of a potential corrective rebound, with the price aiming for the nearest resistance level around 1.1540, which also coincides with the seller's zone. This region previously acted as support, and is now expected to serve as a barrier for a retest. As long as the pair remains below the descending resistance line, the broader trend remains bearish. A short-term correction to the level around 1.1540 is likely if buyers continue to defend the support level. However, a deviation from the resistance cluster could trigger renewed selling pressure, potentially sending EURUSD back to the channel bottom for another reaction. In my opinion, the price will move towards TP1 with a target of 1.14800. A confirmed break above the descending resistance line would be the first sign of a possible bullish shift, opening the door for a stronger recovery. Please share this idea with your friends and click "Boost" 🚀

EURUSD further sell off?💹 Trade Setup EUR/USD
EUR/USD has signficanlty dropped last week with maintaining series lower highs and lower low's signaling continued down trend. 20ema and 10ema crossed from each other and multiple liquidty sweep at 1.1550 level driving the price further below.
with positive NFP data, has boosted the DXY which eventually lowered the EURUSD which may this contue to at least to current support at 1.1468
if price breaks below and candle close, looking at below 1.1391
📈Trading Idea :
Look for bearish setup on pullback at at 1.15288 or above
✈️Targets
1st support 1.14686
2nd support 1.13918
🔴Stop level 1.1552 or above
Follow for more ideas like this!

EURUSD: Support & Resistance Analysis for Next Week 🇪🇺🇺🇸
Here is my latest support and resistance analysis
for EURUSD for next week.
Consider these structures for pullback/breakout trading next week.
❤️Please, support my work with like, thank you!❤️
I am part of Trade Nation's Influencer program and receive a monthly fee for using their TradingView charts in my analysis.

EURUSD Poised for Further Downside as Bearish Structure HoldsEURUSD Poised for Further Downside as Bearish Structure Holds
From our previous analysis, EURUSD reached our first target and found a strong support near 1.5300
EUR/USD continues to trade within a clear bearish structure after breaking down from the large symmetrical triangle formation earlier this month.
The pair is struggling to gain bullish traction, and every short-term recovery has been met with selling pressure.
Price is currently retesting the minor support area around 1.1530, but momentum remains weak.
The next support levels to watch are:
🔹 1.1470
🔹 1.1400
As long as the pair remains below 1.1665 resistance, the overall outlook favors further declines.
You may find more details in the chart!
Thank you and Good Luck!
❤️PS: Please support with a like or comment if you find this analysis useful for your trading day❤️

eurusd 4h🔹 Overall Outlook and Potential Price Movements
In the charts above, we have outlined the overall outlook and possible price movement paths.
As shown, each analysis highlights a key support or resistance zone near the current market price. The market’s reaction to these zones — whether a breakout or rejection — will likely determine the next direction of the price toward the specified levels.
⚠️ Important Note:
The purpose of these trading perspectives is to identify key upcoming price levels and assess potential market reactions. The provided analyses are not trading signals in any way.
✅ Recommendation for Use:
To make effective use of these analyses, it is advised to manually draw the marked zones on your chart. Then, on the 15-minute time frame, monitor the candlestick behavior and look for valid entry triggers before making any trading decisions.

EURUSD Possible Buy ideaAfter posting a Monthly Time Frame chart on EurUsd...i broke it down to Daily time Frame .
Looking for buys at Prce Range $1.38/$1.42 to upside to take pevious High around $1.24

Weekly watchlist – Reviewing the setup on EURUSDPrice has been moving around this support area for almost 265 days, which makes this level highly reliable and significant.
However, if you look closely at the recent reactions, you can see that every bounce from this support has become weaker, showing a clear loss of bullish momentum.
If this support gets broken this week with a strong and confirmed 4H candle, it could create a high-quality short setup.
The first target would be the yellow zone marked on the chart.

Mirrored Trades, EU HnL + GU SH+PLOverall DXY Bias is Bullish, EU trade 1:1 activated first, then one hour later DXY confirmation (SL+PL) and GU (SH+PL) are both activated at the same time, so I entered second trade on GU, scenario worked fine

EU SL+PL Hedging an ongoing GU sell trade as DXY started to show reversal signs against WH resistance

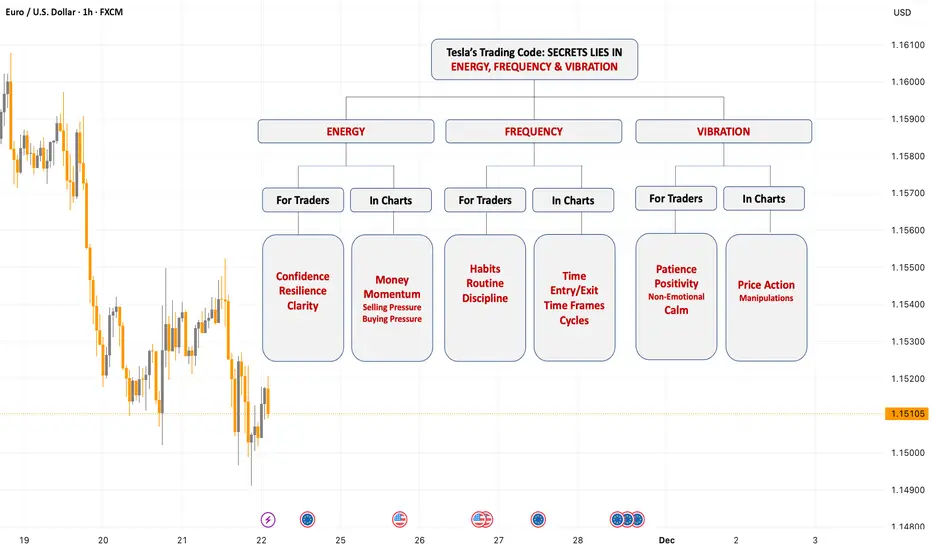
Decoding Trading Charts and Psychology in NIKOLA TESLA'S way! Hey, how are you all! Let's dive deep into a powerful concept inspired by Nikola Tesla’s famous quote: “If you wish to find the secrets of the universe, think in terms of ENERGY, FREQUENCY, and VIBRATION.” This idea, though from the realm of physics, it beautifully translates into the world of trading—both in developing the individual’s right trading mindset and understanding price charts.
Disclaimer:
This post is dedicated solely to educational content and community-driven insights. All information shared here—including strategies, trade setups, and opinions—are for informational purposes only and should not be considered as financial, investment, or trading advice.
Viewers are solely responsible for their own investment decisions.
Trading and investing in financial markets involve risk, and the channel will not be held responsible for any losses or damages incurred as a result of actions taken based on the content presented.
Please consult with a qualified financial advisor before making any investment decisions.
Let’s break down each component and see how you can apply it practically to your trading journey.
At first, let’s talk about the Energy: The Driving Force in Mindset of an individual and Money in Markets.
Energy —Tesla described it as the fundamental driving force behind everything. In trading mindset, energy is your mental and emotional vitality. It’s the passion that fuels your motivation to study markets daily, the focus that keeps you glued to charts during sessions, and the resilience that helps you bounce back from losses without losing confidence.
Imagine two traders: One wakes up excited, ready to analyse and follow their strategy, maintaining positivity even after a tough day. The other wakes up tired and doubtful, easily frustrated by every small loss. The difference? Their energy levels. High, consistent energy levels mean a trader can handle stress better, maintain discipline, and stick to a well-thought plan rather than acting impulsively.
On the market side, think of it as the driving force in the universe of trading. In trading, energy directly corresponds to Money. Money represents the real driving power or driving force behind price movement. It is the buying or selling pressure that injects momentum into the market.
When big chunks of money flow into a stock, like institutional buying, it fuels powerful upward moves. Conversely, large sell-offs drain energy, pushing prices down. Understanding where money is concentrated and how much “Energy” in the form of “Money” is behind the moves lets you anticipate strong trends or reversals.
Secondly, It’s time to discuss about Frequency: The Discipline of an individual and the Time factor in Trading.
Frequency, which for Tesla referred to the rate at which something vibrates or repeats. In trading mindset, frequency is the rhythm of your actions—your habits, your routine, and your discipline. Are you consistently reviewing charts at time intervals? Do you stick to your risk management and trading plan day after day? That regularity creates a frequency that stabilise your results.
Consider a trader who trades instantly, jumping into random setups at different hours without a plan. Their frequency is erratic, and their results are often inconsistent. Contrast that with a trader who enters the market with a fixed routine, analysing and executing trades in well-defined sessions. This disciplined frequency builds confidence and clarity, reducing emotional reactions like fear and greed.
For market charts, the context is in which price move happen in market hours, trading sessions, days, weeks, or months. Frequency is about the rhythm or cycle of these movements. The time of entry and exit of a trade needs understanding of the time factor to achieve better results. For example, price Accumulation and Distribution within an area represent the range of price movements in the near future.
It relates to the timing of price moves. This includes how often prices spend in a particular area without sweeping their highs and lows. The more time spent on it can potentially be how directional the price can behave.
At last, it is Vibration we must look into: It is the Emotional State of an individual and Price Action in charts.
Vibration: On a psychological level, vibration reflects your emotional states—the subtle feelings influencing how you react to market moves. Positive vibrations like calmness, confidence, and patience help you stay grounded, while negative ones like fear, frustration, and impatience can cause poor decisions.
For example, a trader who can stay calm during a price pullback might hold their position with confidence, trusting their analysis. Another who feels anxious might exit too early or overtrade to compensate, resulting in losses.
On the chart side, vibration is best understood as the actual Price Action on the charts—the patterns, candlesticks, and trends that represent how the market feels and behaves at any moment.
Just as vibration represents waves or oscillations in physics, price action is the ever-changing market vibration, reflecting trader sentiment, supply and demand shifts, and market psychology.
For example, a strong bullish trend or bearish trend are vibrations signalling increasing pressure. Sideways or choppy price action indicates indecision and low vibration energy. Learning to read these vibrations means interpreting the real-time mood and momentum of the market.
vibration is the actual price action—the patterns, trends, and candlestick formations that “vibrate” with market sentiment. Sharp price spikes, steady trends, or choppy sideways movement all represent different vibrations of the market. Learning to “read” these vibrations lets you align your trades with what the market is truly expressing.
Bringing It All Together>>>>>>>>>>>
So, how do we use these three—energy, frequency, and vibration—in practical trading mastery?
- First, cultivate your energy by maintaining a positive mindset, managing stress, and staying passionate about learning how, where and when the money is being exchanged.
- Next, build your frequency by developing and sticking to disciplined routines and timing your trades in harmony with market rhythms.
- Lastly, heighten your awareness of vibration by controlling your emotions and learning to interpret price action signals accurately.
Mastering these interconnected elements doesn’t just help you with strategy—it transforms your entire trading psychology, turning you into a more consistent and confident trader.
If this perspective adds value and if you have any inputs to this understanding about trading, Share your experiences or questions in the comments below—I love hearing the application of this thought into charts. Until next time, focus on your energy, maintain your frequency, and tune into the vibrations. Trade smart, and stay disciplined!
EURUSD: Long Signal with Entry/SL/TP
EURUSD
- Classic bullish setup
- Our team expects bullish continuation
SUGGESTED TRADE:
Swing Trade
Long EURUSD
Entry Point - 1.1515
Stop Loss - 1.1509
Take Profit - 1.1527
Our Risk - 1%
Start protection of your profits from lower levels
Disclosure: I am part of Trade Nation's Influencer program and receive a monthly fee for using their TradingView charts in my analysis.
❤️ Please, support our work with like & comment! ❤️
