My Plan To Improve My Win/Loss Ratio In Forex TradingThe trading plan that I have been designing based on SMC was amazingly beautful in terms of its mechanics. Yet, it had a terrible Win/Loss ratio.
Because I loved its mechanics, I didn't want to drop it all together, and was looking for ways to enhance it. I tried to merge it with the classical school and with some Volume indicator, but things still went south.
Finally, I came by some educational material that showed me a couple of things on using Stochastic. I loved it, and this will be my addition, and what I will test in the coming week.
My plan will include the same SMC rules, and the Stochastic. I will draw the support and resistance zones and maybe trendlines.
I will be using the daily timeframe on two different sets of settings for the stochastic, one is long term and another is shorter term.
I will be coming back with my test results next week.
Trade ideas

EURUSD Trading Opportunity! BUY!
My dear friends,
Please, find my technical outlook for EURUSD below:
The price is coiling around a solid key level - 1.1655
Bias - Bullish
Technical Indicators: Pivot Points Low anticipates a potential price reversal.
Super trend shows a clear buy, giving a perfect indicators' convergence.
Goal - 1.1684
Safe Stop Loss - 1.1640
About Used Indicators:
The pivot point itself is simply the average of the high, low and closing prices from the previous trading day.
Disclosure: I am part of Trade Nation's Influencer program and receive a monthly fee for using their TradingView charts in my analysis.
———————————
WISH YOU ALL LUCK

EUR-USD Free Signal! Buy!
Hello,Traders!
EURUSD The pair is expected to revisit the horizontal demand zone early next week as liquidity builds around the 1.1650 handle. A clean reaction from this area could initiate another bullish push toward the recent swing high.
-------------------
Stop Loss: 1.1636
Take Profit: 1.1676
Entry: 1.1655
Time Frame: 3H
-------------------
Buy!
Comment and subscribe to help us grow!
Check out other forecasts below too!
Disclosure: I am part of Trade Nation's Influencer program and receive a monthly fee for using their TradingView charts in my analysis.

EUR/USD Technical & Fundamental AnalysisTechnical Analysis:
EUR/USD has shown a strong rebound after sweeping liquidity lows and forming a Strong Low (1H) around the 1.1600 area, followed by a clear bullish move.
The pair successfully broke above the descending trendline and reached a Weak High (1H) near 1.1710, before starting a minor correction.
Currently, the price is hovering around 1.1650, within a short-term support zone. A continuation of the pullback toward 1.1628 – 1.1602 (coinciding with FVG / OB 1H zones) is expected before a potential bullish continuation.
📈 Expected Scenario:
If the price holds above 1.1600 and shows bullish confirmation, upside targets are:
1.1710 → Retesting the weak high.
1.1940 → Main bullish target for the next wave.
However, a clear break below 1.1580 would invalidate the bullish setup and open the door for a deeper correction toward 1.1500.
🔹 Fundamental Analysis:
EUR/USD is currently moving under the influence of U.S. monetary policy pressure and European economic weakness:
1️⃣ Federal Reserve Policy:
Despite expectations for rate cuts in 2026, recent hawkish comments from Fed members reminded markets that monetary easing may be delayed — providing temporary support for the USD.
2️⃣ Weak Eurozone Data:
The Eurozone continues to struggle with slowing growth and weak industrial activity, leaving the ECB caught between supporting the economy and maintaining price stability.
3️⃣ Geopolitical Developments:
Any improvement in global trade relations could support the euro, while renewed tensions in Eastern Europe would likely weigh on it.
4️⃣ Global Risk Sentiment:
An improvement in risk appetite tends to favor the euro against the dollar, especially if safe-haven demand for the USD weakens.
📊 Conclusion:
Technically, the 1.1600 zone remains the key pivot for direction.
Fundamentally, the pair is caught between USD strength and Eurozone fragility.
Holding above 1.1600 could pave the way toward 1.1940 in the coming weeks.

EUR/USD Daily Chart Analysis For Week of Oct 17, 2025Technical Analysis and Outlook:
Last week, we had an interesting trading session! The Euro demonstrated a considerable increase after reaching our crucial Mean Support level at 1.155. Nevertheless, this significant upward reversal fell marginally short of the Mean Resistance at 1.174, leading to a subsequent decline in the currency.
Current market indicators suggest that this Active Inner Rebound movement is unlikely to be sustainable. Ongoing market sentiment consistently reflects a retracement toward the Outer Currency Dip, designated at 1.145. Should this downward trend persist, it may extend further to the Key Support level of 1.140.
Conversely, it is essential to acknowledge and be aware of the emergence of an Auxiliary Inner Rebound following the Outer Currency Dip at 1.145, in conjunction with the Key Support level of 1.140.

EUR/USD Breakdown Just Starting? Institutions Loading USD Longs🔹 COT (Commitment of Traders)
Euro (EUR):
Non-commercial longs: 252,472 (−789)
Non-commercial shorts: 138,127 (+2,625)
→ Hedge funds slightly trimmed their long exposure while adding to shorts, signaling a loss of bullish momentum on the euro.
US Dollar Index (DXY):
Non-commercial longs: 14,032 (+1,541)
Non-commercial shorts: 24,376 (−1,009)
→ Positioning shows a clear strengthening of the dollar, as speculators close shorts and increase longs.
📊 Interpretation:
Institutional flow remains decisively in favor of the USD, reflecting renewed dollar strength and moderate euro weakness — keeping a bearish bias on EUR/USD in the short term.
🔹 FX Sentiment
50% long / 50% short
📌 The market is perfectly balanced, showing no contrarian extremes at the moment. However, this neutral sentiment after weeks of long dominance indicates a shift in retail perception, likely preceding a consolidation phase before another bearish leg.
🔹 Seasonality
Based on Market Bulls historical data for EUR/USD:
October has historically been negative, with average declines between −0.20% and −0.60% across 10–20 year datasets.
Seasonality improves from November onward, but October remains a period of weakness for the euro.
📌 Conclusion: The seasonal context is bearish, aligning with institutional positioning and current price structure.
🔹 Price Action
EUR/USD has broken the ascending trendline from August and is now consolidating below the 1.1750–1.1800 supply zone, strongly rejected earlier this month.
The pair trades inside a descending channel, with key support at 1.1550–1.1500 and resistance near 1.1720–1.1750.
The RSI is neutral but showing bearish divergence, hinting at a possible short-term pullback before the next leg lower.
🎯 Base scenario: a corrective bounce toward 1.1700–1.1750, followed by renewed downside pressure targeting 1.1450, with potential extension to 1.1380.
❌ Invalidation: Daily close above 1.1780.

EURUSD VIEW🔍 Chart Analysis (4H Timeframe)
Trendline Breakout:
The pair has broken above a long-term descending trendline.
This signals a potential trend reversal from bearish to bullish.
Retest Zone:
The price is now pulling back toward the broken trendline and a horizontal support zone near 1.1600–1.1620.
This area acts as a strong confluence support (trendline + horizontal zone).
Bullish Structure:
After the retest, you’ve projected a move back up toward 1.1750–1.1850.
That aligns with a continuation of higher highs and higher lows, confirming bullish momentum.
📈 Bullish Outlook
If the price holds above 1.1600, expect a strong bullish continuation toward:
1.1720 (first target)
1.1850 (major target)
Break and close below 1.1580 would invalidate the bullish setup short-term and suggest more consolidation.

EURUSD Bullish move toward upper resistanceAfter breaking the resistance on the 30-minute timeframe and confirming the breakout, we expect the price to move toward the 2-hour resistance zone, which is marked on the chart.
The golden zone on the 5-minute timeframe is identified as the entry point, offering a very favorable risk-to-reward ratio.
As always — stay patient, follow your plan, and trust your analysis.

The Rise of Blockchain in Global Trading1. Introduction
The financial world has been continuously evolving with the help of emerging technologies, and among the most transformative is blockchain. Originally conceptualized as the underlying framework of Bitcoin, blockchain has now transcended its initial purpose to revolutionize a wide range of industries—especially trading and finance. The introduction of blockchain-based trading platforms has redefined how assets are exchanged, tracked, and settled globally.
In essence, blockchain trading refers to the use of distributed ledger technology (DLT) to record, verify, and settle trades in a transparent, secure, and decentralized manner. It eliminates intermediaries such as brokers, clearing houses, and banks, allowing participants to transact directly. From cryptocurrency trading to tokenized assets, blockchain technology is reshaping how markets function and how value is transferred.
2. Understanding Blockchain Technology
At its core, a blockchain is a decentralized, immutable digital ledger that records transactions across multiple computers, ensuring transparency and security. Each transaction is grouped into a “block,” linked chronologically to previous ones, forming a “chain.”
Key features of blockchain include:
Decentralization: No single authority controls the network.
Transparency: All participants can view the ledger’s records.
Immutability: Once recorded, data cannot be altered.
Security: Cryptographic algorithms protect transactions.
These features are particularly valuable in the trading world, where trust, speed, and transparency are crucial.
3. Evolution of Trading Systems
Traditionally, trading systems relied heavily on centralized intermediaries. For example, in stock trading, a buyer and seller do not interact directly; instead, their orders are processed through brokers, exchanges, and clearinghouses. This structure ensures trust but adds costs, delays, and risks such as counterparty default.
With the introduction of electronic trading in the late 20th century, markets became faster but still retained centralized control. The next logical evolution is blockchain-based trading, which removes unnecessary middle layers and offers real-time peer-to-peer settlement.
4. Blockchain in Financial Markets
Blockchain’s integration into trading is already visible in multiple segments of the financial market:
Cryptocurrency Exchanges:
These platforms allow the trading of digital currencies like Bitcoin, Ethereum, and stablecoins. They can be centralized (Binance, Coinbase) or decentralized (Uniswap, PancakeSwap).
Tokenized Securities:
Stocks, bonds, or real estate can be “tokenized” — represented as digital tokens on a blockchain. This allows fractional ownership, global accessibility, and faster settlement.
Smart Contracts in Derivatives Trading:
Smart contracts are self-executing contracts coded on the blockchain. They automatically enforce the terms of agreements without intermediaries, ideal for futures, options, or swaps.
Commodity and Forex Trading:
Blockchain can streamline supply chain verification in commodities and ensure transparency in forex settlements using stablecoins or central bank digital currencies (CBDCs).
5. How Blockchain Enhances Trading Efficiency
Blockchain improves trading systems in several critical areas:
a. Transparency
Every participant on a blockchain can view and verify transactions. This openness reduces fraud, market manipulation, and insider trading, fostering a more trustworthy market environment.
b. Real-Time Settlement
Traditional trading systems often take two to three days for trade settlement (T+2). Blockchain enables instant settlement (T+0), freeing up capital and reducing counterparty risk.
c. Reduced Intermediaries
Blockchain allows direct peer-to-peer transactions, reducing fees charged by brokers, clearinghouses, and custodians.
d. Security and Fraud Prevention
The cryptographic structure of blockchain ensures that transactions cannot be tampered with. This makes fraudulent alterations or hacking extremely difficult.
e. Accessibility
Blockchain platforms operate globally and are accessible 24/7. This democratizes trading, allowing individuals from any country to participate in financial markets.
6. Types of Blockchain Trading Platforms
There are primarily three models of blockchain trading ecosystems:
Centralized Exchanges (CEXs):
Run by private entities that control user data and funds. Examples: Binance, Kraken. These offer liquidity and user-friendly interfaces but compromise decentralization.
Decentralized Exchanges (DEXs):
Operate on smart contracts without intermediaries. Examples: Uniswap, SushiSwap. Users retain full control over their funds and trade directly from their wallets.
Hybrid Exchanges:
Combine the liquidity of CEXs and the autonomy of DEXs. They offer regulated trading environments while maintaining blockchain transparency.
7. Tokenization: The New Frontier in Trading
Tokenization refers to the process of converting real-world assets (RWAs) such as stocks, real estate, commodities, or even art into digital tokens stored on a blockchain.
For instance:
A $1 million property can be divided into 1,000 tokens worth $1,000 each.
Investors worldwide can trade these tokens, creating liquidity in traditionally illiquid assets.
Benefits of Tokenization:
Increased liquidity for physical assets.
Global market participation.
Fractional ownership opportunities.
Automated compliance through smart contracts.
Tokenized assets are becoming a cornerstone of blockchain-based trading, with major financial institutions exploring blockchain infrastructure for digital securities issuance and settlement.
8. Smart Contracts: Automating the Trading Process
Smart contracts are self-executing programs that perform predefined actions when certain conditions are met. In trading, they enable:
Automated settlement of trades once both parties meet conditions.
Execution of derivatives based on market triggers.
Instant clearing without manual intervention.
For example, in a decentralized options trading setup, a smart contract automatically releases funds when a price reaches a target level. This reduces disputes, delays, and operational costs.
9. Blockchain in Commodity and Supply Chain Trading
Blockchain is not limited to financial instruments—it’s transforming commodity trading and supply chain finance as well.
In oil trading, blockchain tracks shipments, verifies authenticity, and automates payment on delivery confirmation.
In agriculture and metals, blockchain ensures ethical sourcing and transparency, helping traders comply with global regulations.
For instance, companies like Vakt and Komgo use blockchain to digitalize post-trade processes in commodity markets, significantly cutting costs and paperwork.
10. Role of Stablecoins and CBDCs in Blockchain Trading
Volatility is a major concern in cryptocurrency markets. Stablecoins—cryptocurrencies pegged to fiat currencies like USD—bridge this gap by offering stability and liquidity.
Similarly, Central Bank Digital Currencies (CBDCs), issued by national authorities, can integrate directly into blockchain trading platforms, enabling regulated digital settlements with the efficiency of crypto transactions and the trust of fiat currency.
11. Regulatory Challenges and Risks
While blockchain offers immense potential, several challenges hinder its mainstream adoption in trading:
Regulatory Uncertainty:
Governments worldwide are still formulating policies around digital assets and decentralized platforms.
Market Manipulation and Scams:
Lack of oversight in some exchanges can lead to pump-and-dump schemes or rug pulls.
Security Risks:
Smart contract vulnerabilities or poor wallet management can lead to fund losses.
Scalability and Energy Consumption:
Early blockchains like Bitcoin face scalability issues and high energy usage, though newer models (like Proof-of-Stake) are solving this.
Lack of Interoperability:
Different blockchains often operate in isolation, making cross-platform trading complex. However, emerging technologies like cross-chain bridges and interoperable protocols are addressing this.
12. Blockchain-Based Trading in Practice
Major financial institutions are already adopting blockchain for trading operations:
JP Morgan’s Onyx platform uses blockchain for real-time interbank settlements.
Nasdaq and London Stock Exchange are experimenting with blockchain for securities issuance and post-trade processes.
DeFi (Decentralized Finance) platforms like Aave and Compound enable borrowing, lending, and yield trading directly through blockchain networks.
These developments mark a shift from blockchain as a niche technology to a mainstream financial infrastructure.
13. Advantages for Traders and Investors
Blockchain trading offers multiple benefits for both retail and institutional participants:
Faster settlement cycles (T+0)
Lower transaction fees
Enhanced transparency and security
24/7 global access
Improved liquidity through tokenization
Reduced counterparty and credit risks
This creates a more inclusive, efficient, and secure financial environment, empowering individuals and reducing dependency on traditional institutions.
14. Future of Trading with Blockchain
The future of trading will likely be defined by digital integration, automation, and decentralization. Blockchain will play a central role in enabling:
Global decentralized exchanges for all asset classes
Interoperable networks connecting banks, regulators, and traders
Tokenized stock markets and real estate platforms
AI-powered blockchain analytics for predictive trading
As blockchain merges with Artificial Intelligence (AI), Internet of Things (IoT), and quantum computing, trading systems will become smarter, more transparent, and self-regulating.
15. Conclusion: The New Era of Trustless Trading
Blockchain has introduced a paradigm shift in the trading ecosystem. By eliminating intermediaries, enabling transparency, and automating settlements, it provides a trustless yet trustworthy infrastructure. Traders gain greater control, investors enjoy faster access to opportunities, and institutions achieve operational efficiency.
While challenges remain in terms of regulation, scalability, and global standardization, the trajectory is clear — blockchain is redefining the future of trading. From cryptocurrencies to tokenized equities and beyond, this technology is laying the foundation for a decentralized financial world where efficiency, trust, and innovation coexist seamlessly.

will it play out llike this?find out this week..
slight push down the hits support on monthly and weekly level then reverses to the upside

EURUSD is consolidatingEURUSD is consolidating. Next week pricement will bre guided by fundamental news.

EUR/USD Trade Alert🚨 EUR/USD Trade Alert 🚨
━━━━━━━━━━━━━━━━━━━
Type: 🟢 Buy Stop
Entry: 1.15913
Take Profit (TP): 🎯 1.17250
Stop Loss (SL): ❌ 1.15218
━━━━━━━━━━━━━━━━━━━
📅 Signal Time: 10 Oct 2025
📈 Status: Pending Activation
💡 Analysis: Price has moved above the original entry level, showing bullish momentum. Buyers are active, suggesting a possible trend continuation. Wait for confirmation before triggering the order.

EUROUSD NEW OUTLOOK According to H1 analysis EURUSD market running in selling pressure from last few hour now market will be going in buy and touch the RESISTANCE LEVEL and it will be falling again so be careful use proper money management
TRADE AT YOUR OWN RISK
REGARD ALBERT

EURUSD BOUNCE BACK BULLISH SCENARIO Overall Market Structure
The market is currently moving within a descending channel, showing a bearish trend since the last impulse leg.
Price is trading below the trendline, indicating that the sellers are still in control.
However, a short-term retracement (correction) is visible, suggesting a possible pullback before the next drop.
⚙️ Key Technical Areas
Resistance Area: Around 1.16680 – 1.17000
This zone aligns with the upper trendline of the channel.
It’s the next possible retest area before sellers may re-enter the market.
Support Area: Around 1.15000 – 1.15200
🔍 Current Price Action (1.1620)
Price is attempting to form a small corrective wave (shown near the “eye” symbol).
A pullback toward the minor trendline or the 1.1640–1.1668 region is expected.
If the price fails to break above the trendline resistance, a new bearish impulse leg may start toward 1.1550–1.1500.

EUR/USD – Bearish Continuation SetupHey Everyone,
Price has been in a steady lower-low, lower-high sequence since the Fed’s last move.
Lagarde’s comments gave the Euro a quick bounce, but that rally stalled right into old support that’s now acting as resistance.
We’ve already broken the daily trendline, and now price is pulling back to retest key levels. Unless bulls reclaim the 1.1780 area, the structure remains bearish.
Levels I’m Watching
> 1.1645 → first area of interest for shorts
> 1.1675–1.1712 → second resistance zone if price pulls back deeper
> Targets: 1.1542 first, with an extended move possible down to 1.1389
Invalidation: sustained move above 1.1780
Trade Idea
Looking to short rejection candles at either resistance zone. Stops go above 1.1780, with partials at 1.1542 and final TP at 1.1389.
The risk/reward here is solid... around 2.5R to the first target and over 4R to the second. Patience is key, I want to see rejection before entering.

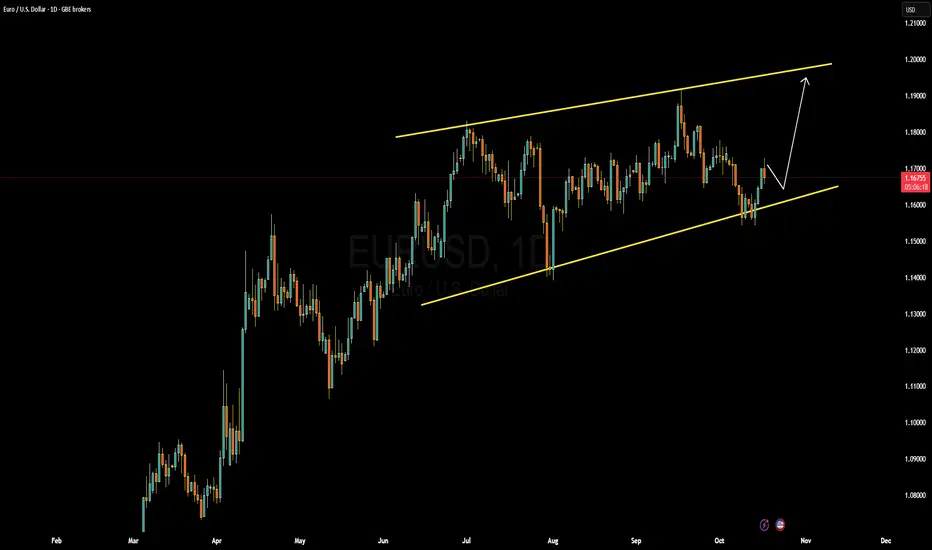
EURUSD Forming Ascending ChannelEURUSD is currently respecting a well-defined ascending channel on the daily chart, with price recently bouncing from the lower boundary near the 1.1600 zone. This area has acted as a strong demand region multiple times, signaling active buying pressure from institutional players. The pair is now retracing upward, but I anticipate a short-term pullback before continuation toward the upper channel resistance around the 1.1950–1.2000 region. As long as price holds above the rising trendline, the bullish structure remains intact, offering a high-probability trend continuation setup.
From a fundamental perspective, the euro is gaining mild support as expectations grow that the European Central Bank may maintain restrictive policy for an extended period to combat inflation, while the US dollar is facing pressure amid increasing speculation of potential rate cuts from the Federal Reserve if economic slowdown deepens. Recent softer US labor data and weaker consumer sentiment have weighed on the dollar index, giving EURUSD upside momentum. However, volatility could increase ahead of key economic releases such as US GDP figures and eurozone CPI updates.
I’ll be watching for a controlled correction toward the 1.1700–1.1650 area. If buyers defend that zone with strong rejection patterns, I’ll be looking to position for long entries targeting the upper channel boundary. This setup aligns both technically and fundamentally, making it one of the cleanest swing opportunities on the board. Patience on the pullback will secure better entry and maximize profit potential.
EURUSD: Strong Bearish Sentiment! Short!
My dear friends,
Today we will analyse EURUSD together☺️
The price is near a wide key level
and the pair is approaching a significant decision level of 1.16744 Therefore, a strong bearish reaction here could determine the next move down.We will watch for a confirmation candle, and then target the next key level of 116601.Recommend Stop-loss is beyond the current level.
❤️Sending you lots of Love and Hugs❤️

Everyone’s Watching EUR/USD Wrong! Use this Strategy!In this video, we break down the current EUR/USD trading scenario using pure algorithmic structure — no indicators, no noise.
You’ll see how the market is already revealing the next possible paths before they even happen.
By analyzing how algorithms interact within the chart, we can understand which side of the market currently holds control.
Every move the price makes leaves behind a pattern — a clue — that tells us what’s likely coming next.
Most traders react late because they focus on lagging tools. Here, we focus on the why behind price movement.
We’ll map out the bullish and bearish scenarios that can unfold from this level and what each would mean for traders.
This isn’t about guessing direction — it’s about understanding structure and probability.
Whether you trade short-term or just want to see how deep analysis works, this breakdown will give you clarity.
Watch closely, because once you start seeing the algorithms in action, you’ll never look at EUR/USD the same way again.
Let’s get into the chart.
As always let me know if you have any questions

How Algorithms Let You See the Market’s Next Move - EUR/USD I’m not exaggerating when I say this — if you give yourself the chance, algorithms can completely change the way you see the market.
In this video (and many of my previous ones), I show real examples where I successfully outlined a scenario before the price followed it. This doesn’t happen because I have a crystal ball — it happens because I use algorithms to understand the current set of possibilities the market is likely to explore next.
Once you start seeing the market through this lens, trading stops feeling random. You begin to see how price actually moves — the logic, the structure, and the hidden battles that shape every candle.
This knowledge is too powerful to keep to myself, so I’ll continue sharing these insights here on TradingView. I hope you’ll join this growing community of traders who are learning to see the market for what it truly is.
As always, thank you for watching — and if you have any questions, drop them in the comments. I’ll be happy to help.

LONG ON EUR/USDEU has given us a nice bullish push from a demand zone.
I will be buying EUR/USD looking to catch 50-80 pips.


EURUSD: Expecting Bearish Continuation! Here is Why:
The analysis of the EURUSD chart clearly shows us that the pair is finally about to tank due to the rising pressure from the sellers.
Disclosure: I am part of Trade Nation's Influencer program and receive a monthly fee for using their TradingView charts in my analysis.
❤️ Please, support our work with like & comment! ❤️
