USD/MXN Faces Another Key Support ZoneOver the last three sessions, the USD/MXN pair has posted a depreciation of around 0.8%, with selling pressure remaining in favor of the Mexican peso. This move is mainly driven by speculation around the upcoming release of U.S. inflation (CPI) data, scheduled for tomorrow. Markets are looking to co
Related currencies

Will USD/MXN Break Above its Bearish Channel?USD/MXN is showing signs of a potential shift after months of steady declines within a well-defined descending channel.
The pair recently found a floor near 18.50, which aligns with the lower boundary of the channel, and has since rebounded back above its 50-day SMA for the first time in weeks. Thi

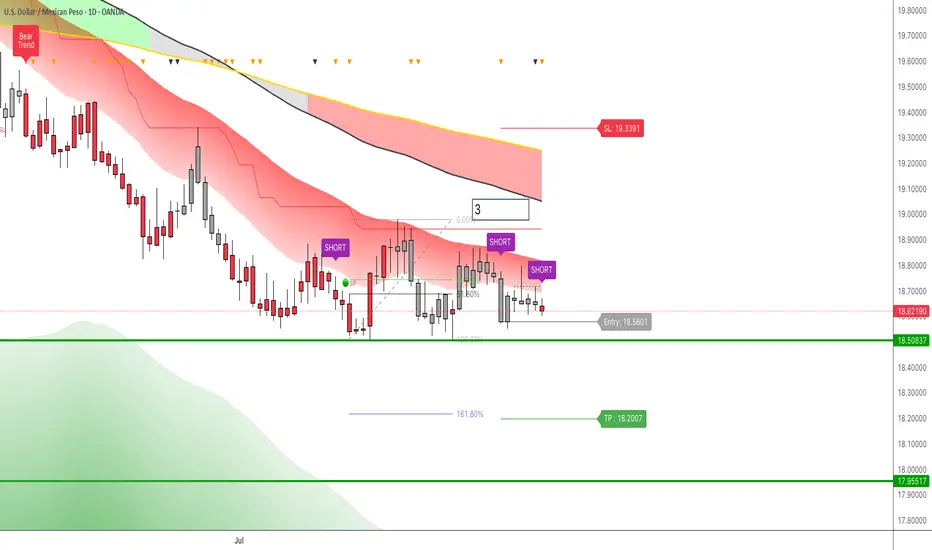
USDMXN: Short TriggerHello fellow traders,
today I share the UsdMxn chart in which we have a new Short trigger signal from LuBot.
The signal appears on the daily timeframe and is a very good trigger for the following reasons:
1. Red candles: the short structure returns bearish in favor of the main trend.
2. Downswing
USD/MXN Analysis (330 words) The current movement of USD/MXN isUSD/MXN Analysis (330 words)
The current movement of USD/MXN is defined by a fierce contest between global monetary policy and Mexico's unique domestic strengths. **Broad USD strength** serves as the core upward catalyst, as persistent market expectations for delayed Federal Reserve rate cuts conti

Mexican Peso VS US Dollar - Fight against the Emerging marketsTriple Top has formed on USD/MXN.
Price<20 and 200MA
Target 17.55
If you look at the last analysis I did on the USD/ZAR (South African Rand) you'll see there is weakness to come for the USD still.
And with this currency, it shows a similar move.
There are further reasons for the MExican Peso

USD/MXN Downtrend Probing Support AgainTechnical outlook:
Trend: The pair remains locked in a downward channel since late April, with price respecting both the upper and lower boundaries. This confirms a well-defined bearish structure.
Resistance: The upper channel line and the 50-day SMA (18.75) converge as a strong cap. Above that, t

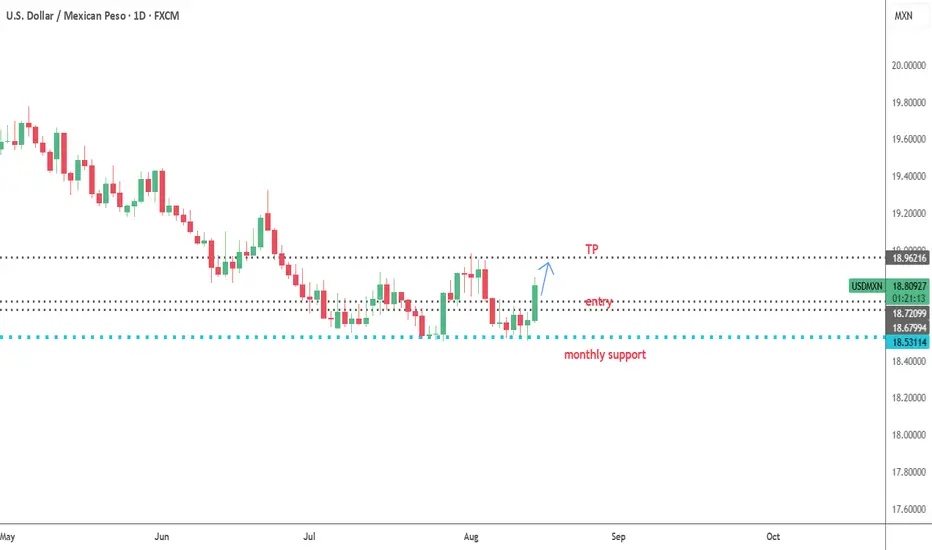
USDMXN--LONG--strong upward reaction at the long term monthly support
-entry, TP levels are as shown on chart
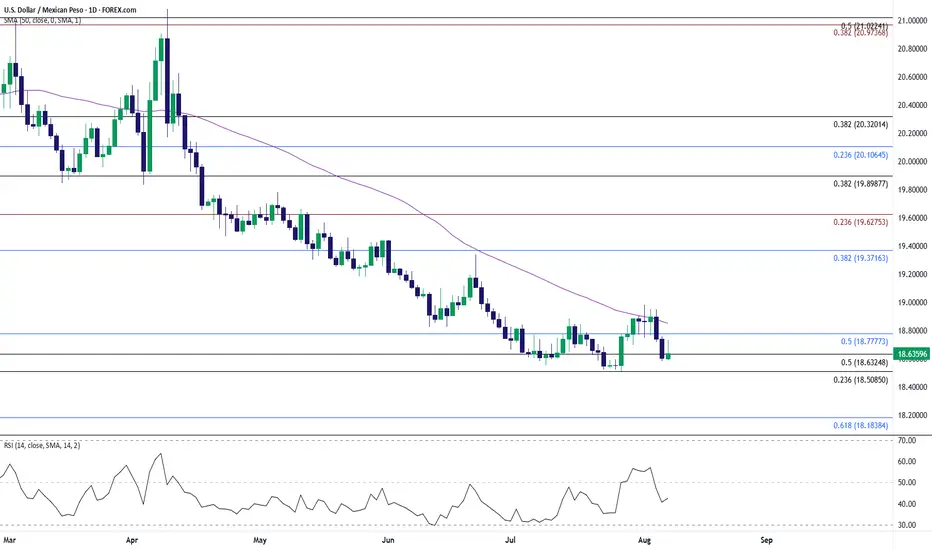
USD PESO- Support, Fib and other reasons LONGHello fellow traders!
Good news! good NEWS GOOOOOOD News for USA! here is the idea- support holding hence going for the 19.10-19.11 level of resistance Aldo the drop of the price seen well on a weekly/monthly chart hit the 0.5 fibs normally being reaction level and with a new trades and America is

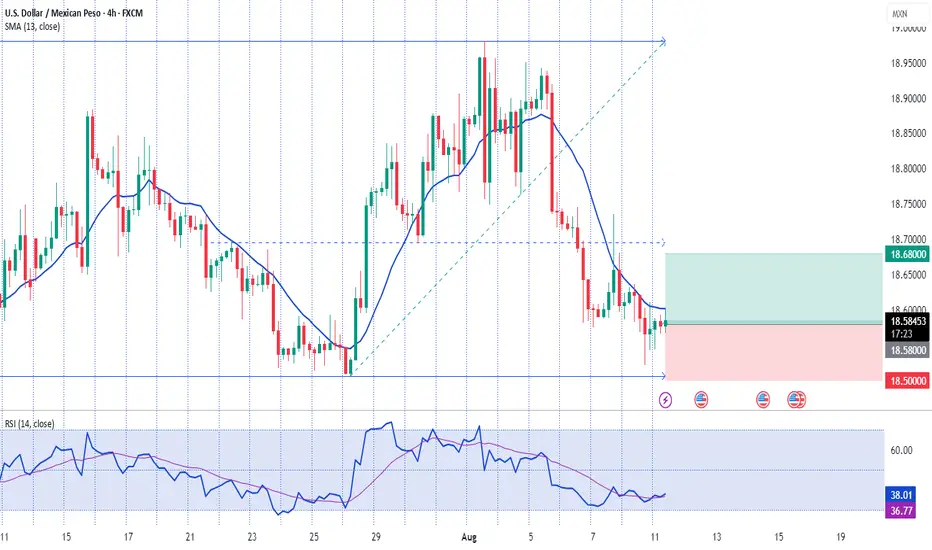
USD/MXN Defends Rebound from July LowUSD/MXN seems to be defending the rebound from the July low (18.5116) as it attempts to retrace the decline from earlier this week.
A breach above 18.7780 (50% Fibonacci retracement) may push USD/MXN toward the monthly high (18.9810), with a move/close above 19.3720 (38.2% Fibonacci retracement) op
See all ideas
Summarizing what the indicators are suggesting.
Oscillators
Neutral
SellBuy
Strong sellStrong buy
Strong sellSellNeutralBuyStrong buy
Oscillators
Neutral
SellBuy
Strong sellStrong buy
Strong sellSellNeutralBuyStrong buy
Summary
Neutral
SellBuy
Strong sellStrong buy
Strong sellSellNeutralBuyStrong buy
Summary
Neutral
SellBuy
Strong sellStrong buy
Strong sellSellNeutralBuyStrong buy
Summary
Neutral
SellBuy
Strong sellStrong buy
Strong sellSellNeutralBuyStrong buy
Moving Averages
Neutral
SellBuy
Strong sellStrong buy
Strong sellSellNeutralBuyStrong buy
Moving Averages
Neutral
SellBuy
Strong sellStrong buy
Strong sellSellNeutralBuyStrong buy
Displays a symbol's price movements over previous years to identify recurring trends.
Frequently Asked Questions
The current rate of USDMXN is 18.65365 MXN — it has increased by 0.14% in the past 24 hours. See more of USDMXN rate dynamics on the detailed chart.
The value of the USDMXN pair is quoted as 1 USD per x MXN. For example, if the pair is trading at 1.50, it means it takes 1.5 MXN to buy 1 USD.
The term volatility describes the risk related to the changes in an asset's value. USDMXN has the volatility rating of 0.38%. Track all currencies' changes with our live Forex Heatmap and prepare for markets volatility.
The USDMXN showed a −0.04% fall over the past week, the month change is a −1.15% fall, and over the last year it has decreased by −5.14%. Track live rate changes on the USDMXN chart.
Learn how you can make money on rate changes in numerous trading ideas created by our community.
Learn how you can make money on rate changes in numerous trading ideas created by our community.
Currencies are usually traded through forex brokers — choose the one that suits your needs and go ahead. You can trade USDMXN right from TradingView charts — just log in to you broker account. Check out the list of our integrated brokers and find the best one for your needs and strategy.
When deciding to buy or sell currency one should keep in mind many factors including current geopolitical situation, interest rates, and other. But before plunging into a deep research, you can start with USDMXN technical analysis. The technical rating for the pair is strong sell today, but don't forget that markets can be very unstable, so don't stop here. According to our 1 week rating the USDMXN shows the sell signal, and 1 month rating is sell. See more of USDMXN technicals for a more comprehensive analysis.