Related currencies

USD/MXN: Super Peso Defies Dollar StrengthHere is the revised article with all hyperlinks removed, maintaining the professional formatting and analysis.
The Mexican peso continues to frustrate dollar bulls, maintaining a defiant stability despite broad greenback strength.
Over the last five sessions, the USD/MXN pair moved just 0.4%. Th

USD/MXN Breaks Channel Resistance as Momentum Turns PositiveThe U.S. Dollar is showing renewed strength against the Mexican Peso, breaking above the descending channel that has contained price action since April. This breakout coincides with a push above the 50-day simple moving average (SMA), signaling a potential shift in momentum after months of consolida

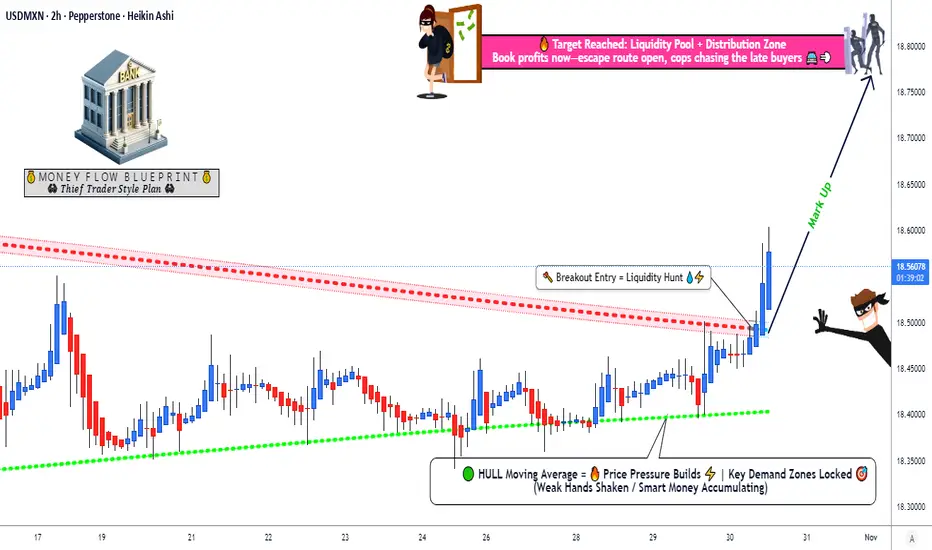
USD/MXN Bulls Prepare for Breakout as Momentum Rebuilds🕵️♂️💰 Thief Trader’s Heist on USD/MXN! 💹💎
“US Dollar vs Mexican Peso – Profit Pathway Setup (Swing / Day Trade)”
🧭 Plan Overview
We’re going BULLISH 🟢 on USD/MXN — quiet before the breakout 💥
✅ Confirmation comes from HULL Moving Average pullback
✅ + Triangular Moving Average breakout 🔺
Once that
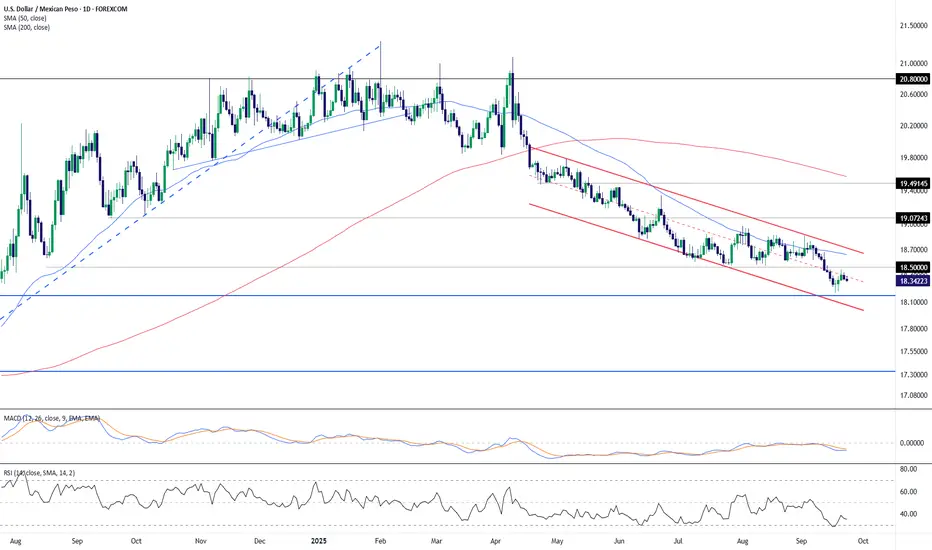
USD/MXN Tests Upper Channel Resistance as Momentum ImprovesUSD/MXN continues to trade within a well-defined descending channel that has guided price action since March. The pair recently rebounded from the lower boundary of this structure near 18.20 and is now testing the upper trendline resistance around 18.55–18.60.
The 50-day SMA (18.55) aligns closely


USD/MXN Loses Ground Toward the Weekly CloseOver the last three trading sessions, USD/MXN has posted a gain of more than 0.6% in the short term in favor of the U.S. dollar. For now, buying pressure has remained steady, partly due to the ongoing government shutdown in the United States, which has allowed the dollar to recover in the short term

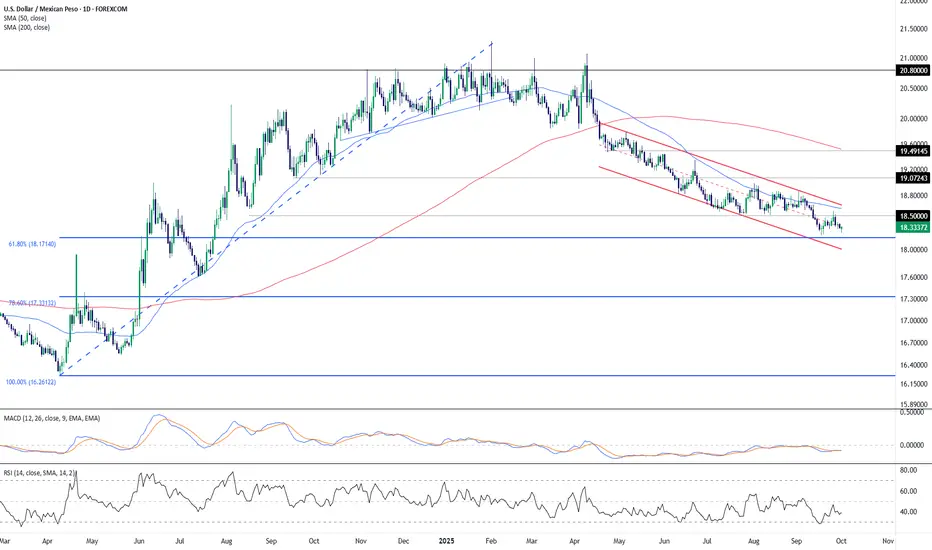
USD/MXN – Bearish Channel Holds as Price Nears Key Fibonacci SupUSD/MXN continues to trade within a descending channel, maintaining pressure after failing to reclaim the 50-day SMA (18.60) and staying well below the 200-day SMA (19.51). The broader trend remains bearish, with lower highs and lower lows firmly intact.
Currently, price is testing the 18.50 zone,
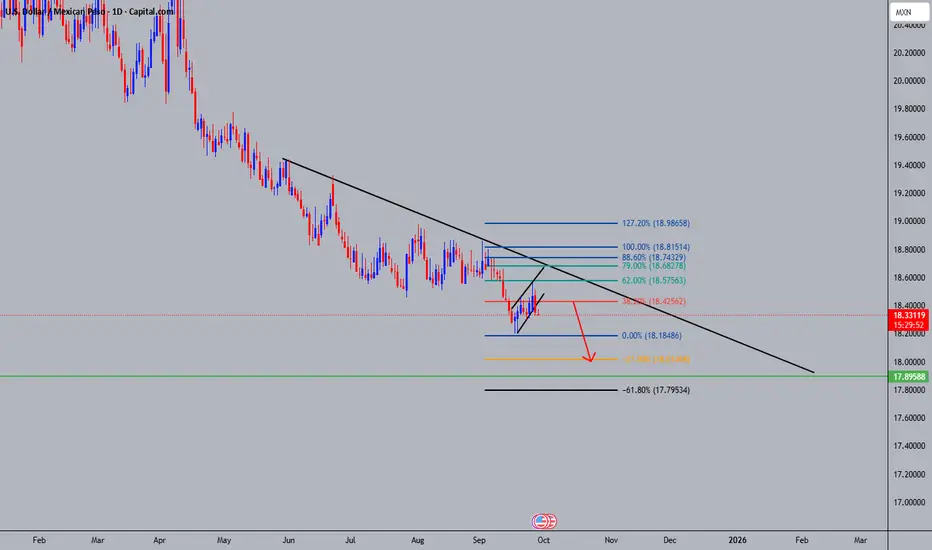
USDMXNLove Mexico, so here is my idea for short-term.
USDMXN
Take a look for correlations.
Best Regards,
USD/MXN Extends Decline Within Downward ChannelUSD/MXN continues to trade inside a well-defined descending channel that has contained price action since mid-April. The pair recently bounced from the lower boundary of the channel near 18.20, but remains capped by resistance around the 50-day SMA (18.63). The broader structure remains bearish as t
See all ideas
Displays a symbol's price movements over previous years to identify recurring trends.
Frequently Asked Questions
The value of the USDMXN pair is quoted as 1 USD per x MXN. For example, if the pair is trading at 1.50, it means it takes 1.5 MXN to buy 1 USD.
Currencies are usually traded through forex brokers — choose the one that suits your needs and go ahead. You can trade USDMXN right from TradingView charts — just log in to you broker account. Check out the list of our integrated brokers and find the best one for your needs and strategy.