USD/MXN: Super Peso Defies Dollar StrengthHere is the revised article with all hyperlinks removed, maintaining the professional formatting and analysis.
The Mexican peso continues to frustrate dollar bulls, maintaining a defiant stability despite broad greenback strength.
Over the last five sessions, the USD/MXN pair moved just 0.4%. This neutrality highlights the peso's formidable resistance. While the U.S. dollar gains ground globally, Mexico’s currency holds the line. Investors call this the "Super Peso" phenomenon. It stems from a unique confluence of high yields and structural economic shifts.
Macroeconomics: The Rate Differential Shield
Mexico’s high interest rates act as a primary defensive wall. The Bank of Mexico (Banxico) set its benchmark rate at 7.25% in November. Conversely, the U.S. Federal Reserve maintains a target of 4.00%. This 3.25% spread creates a massive incentive for carry traders. Investors borrow cheap dollars to buy yielding pesos. This constant demand buoys the currency even when market sentiment sours.
Economics: Inflation and Policy
Inflation in Mexico is cooling, validating Banxico's strategy. October data showed headline inflation dropping to 3.57%. This progress allows policymakers to consider gradual easing. However, aggressive cuts pose a risk. Narrowing the yield spread too quickly could erode the peso's appeal. Banxico must balance growth needs against currency stability.
Geostrategy & Geopolitics: The Nearshoring Fortress
Global trade tensions have inadvertently strengthened Mexico's hand. The U.S.-China decoupling forces corporations to shorten supply chains. Mexico is the logical beneficiary of this "nearshoring" wave. Its geographic proximity to the U.S. market is a supreme strategic asset. This geopolitical realignment drives Foreign Direct Investment (FDI) to record levels. Long-term capital inflows provide a structural floor for the peso, independent of daily speculative flows.
Industry Trends: Manufacturing Renaissance
Industrial parks across Northern Mexico are operating at near capacity. Global manufacturers are relocating essential production lines from Asia to states like Nuevo León. This shifts Mexico’s economy higher up the value chain. We see a transition from simple assembly to complex manufacturing. This industrial depth creates sustained demand for pesos to pay local operational costs.
Technology & Cyber: Digital Finance Evolution
Mexico’s financial sector is undergoing a rapid technological maturation. Fintech adoption is surging, facilitating record remittance flows. Digital platforms now process billions of dollars efficiently and securely. Cybersecurity investment is rising in tandem to protect this digital infrastructure. Robust cyber-defenses build institutional trust, encouraging further capital repatriation.
Science & High-Tech: The Innovation Hub
The narrative of cheap labor is evolving into one of skilled innovation. Hubs like Guadalajara are attracting high-tech R&D centers. This "Silicon Valley of Mexico" fosters a new class of engineering talent. Science-based industries, including medical devices and aerospace, are expanding. This diversification reduces reliance on oil exports and strengthens the currency's fundamental value.
Patent Analysis: Intellectual Property Growth
Patent filings reflect this high-tech shift. International companies are increasingly filing IP protections within Mexico. Patent data indicates growth in automotive and aerospace engineering sectors. This signals a long-term commitment to the market. Companies do not protect IP in transient manufacturing bases. They do so in strategic, long-term hubs. This entrenchment further stabilizes the economic outlook.
Management & Leadership: Central Bank Discipline
Banxico’s leadership has demonstrated exceptional discipline. They moved earlier and more aggressively against inflation than many G7 peers. This assertiveness established deep credibility with global markets. Investors trust the central bank to defend the currency’s purchasing power. Prudent management serves as an intangible but vital asset for the peso.
Outlook: The Dollar Threat
Risks remain despite these strengths. The U.S. Dollar Index (DXY) is rebounding toward the 100 level. A sustained breakout could pressure emerging market currencies. If the DXY reclaims early-2025 highs of 110, the peso will face a severe test. Traders should watch the 18.59 resistance level closely. A break above this could signal a shift in momentum.
Trade ideas


USD/MXN Breaks Channel Resistance as Momentum Turns PositiveThe U.S. Dollar is showing renewed strength against the Mexican Peso, breaking above the descending channel that has contained price action since April. This breakout coincides with a push above the 50-day simple moving average (SMA), signaling a potential shift in momentum after months of consolidation.
The next resistance area sits around 18.85–19.07, aligning with prior swing highs, while the 200-day SMA near 19.26 remains the broader resistance level to watch. On the downside, 18.50 now acts as immediate support, followed by 18.20 at the recent base of the channel.
Momentum indicators support the bullish tone: the MACD has crossed above its signal line and is trending higher, while the RSI has moved above the neutral 50 level, indicating strengthening buying interest without yet entering overbought territory.
Overall, USD/MXN appears to be in the early stages of a potential trend reversal, as technical conditions shift from bearish to neutral-to-bullish following the confirmed breakout from the long-term descending channel.
-MW

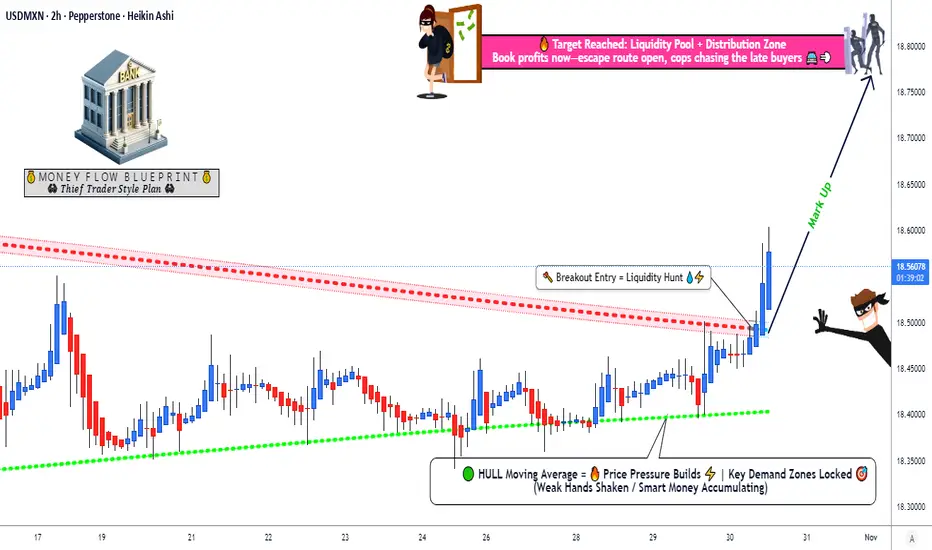
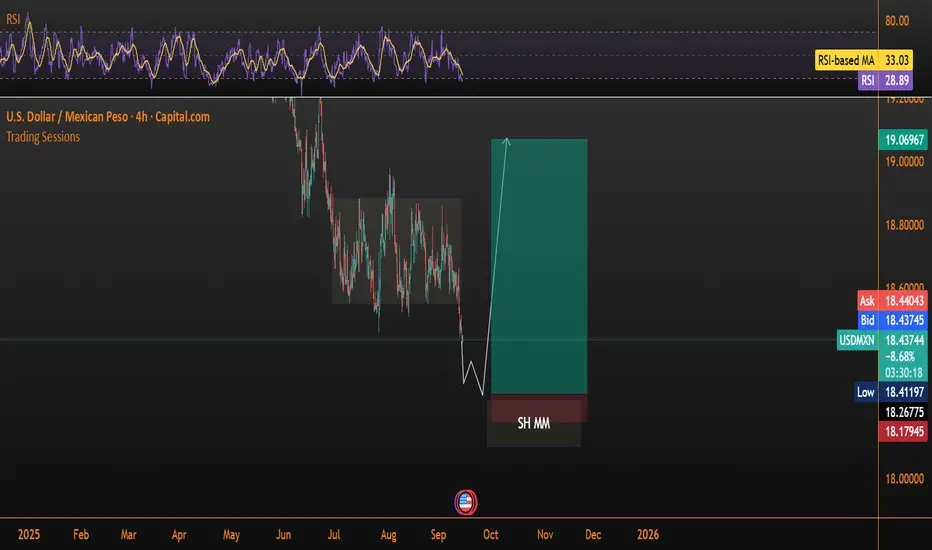
USD/MXN Bulls Prepare for Breakout as Momentum Rebuilds🕵️♂️💰 Thief Trader’s Heist on USD/MXN! 💹💎
“US Dollar vs Mexican Peso – Profit Pathway Setup (Swing / Day Trade)”
🧭 Plan Overview
We’re going BULLISH 🟢 on USD/MXN — quiet before the breakout 💥
✅ Confirmation comes from HULL Moving Average pullback
✅ + Triangular Moving Average breakout 🔺
Once that combo fires, it’s game on! 🏁
Our thief-style blueprint? Layered limit buys to catch every dip like a pro sniper 🎯
💸 Entry Plan – “Thief Strategy” (Layering Style)
We don’t chase — we set traps for price!
Multi-layer buy limits ready to ambush the market 👇
💰 18.45000
💰 18.50000
💰 18.55000
(Add more layers if you feel spicy 🌶️)
🧠 Logic: Price respects your zone → Layers get filled → Ride the breakout!
🛑 Stop Loss (SL)
📍 Thief’s defensive wall: 18.40000
💬 Note: Dear Ladies & Gentleman (Thief OG’s) — this SL is my version of the escape hatch. Manage risk your own way — you’re the final boss of your account! 👑
🎯 Take Profit (TP)
🎯 Primary Target: 18.85000 (🚔 Police Barricade Resistance)
⚡ Quick Escape Zone: 18.80000
💬 Reason: Strong resistance + overbought trap ahead — grab the loot and vanish 🏃♂️💨
📢 Note: Dear Ladies & Gentleman (Thief OG’s) — my TP is just my play. Take your own prize at your own pace! 💼
🌍 Correlated Pairs to Watch
$USD/JPY – Check USD momentum 💪
💶 FOREXCOM:EURMXN – Confirms MXN weakness 🔻
💵 OANDA:USDCAD – USD trend + oil link 👀
💂 CAPITALCOM:GBPMXN – MXN risk sentiment barometer 📊
INDEX:ME / IPC Mexico (Mexican Stock Index): A strong Mexican economy can strengthen the MXN.
TVC:DXY (US Dollar Index): The USD side of the pair. A strong DXY generally boosts USD/MXN.
EUR/USD: The world's most popular pair often has an inverse correlation with USD pairs.
📈 If USD flexes strength across majors or EM currencies get shaky, USD/MXN could rally harder.
🧠 Market Key Points
✨ USD strength → Supports bullish thesis
✨ EM risk-off → Peso weakness tailwind
✨ MXN reacts to oil + domestic news
✨ HULL MA + Triangular MA = breakout clarity ⚙️
Simple formula:
📉 Pullback → 📈 Breakout → 💰 Profit potential
⚡ Final Words
Trade smart, layer smarter.
Don’t chase candles — let candles chase your layers 🔥
✨ “If you find value in my analysis, a 👍 and 🚀 boost is much appreciated — it helps me share more setups with the community!”
🧩 Disclaimer: This is Thief-style trading strategy just for fun — educational purpose only!
#Forex #USDMXN #SwingTrade #DayTrade #ThiefTrader #LayeringStrategy #HULLMA #TriangularMA #Breakout #USDStrength #ForexAnalysis #TradingViewIdeas #MarketHeist #ProfitPathway
USD/MXN Tests Upper Channel Resistance as Momentum ImprovesUSD/MXN continues to trade within a well-defined descending channel that has guided price action since March. The pair recently rebounded from the lower boundary of this structure near 18.20 and is now testing the upper trendline resistance around 18.55–18.60.
The 50-day SMA (18.55) aligns closely with this resistance area, reinforcing its technical significance, while the 200-day SMA (19.42) remains above price — a reminder that the broader trend bias is still tilted downward.
Momentum indicators show early signs of potential recovery:
The MACD histogram has turned positive for the first time in several weeks, suggesting a shift in short-term momentum.
The RSI has risen toward 56, indicating strengthening bullish pressure but still within neutral territory.
A decisive breakout above the channel’s upper boundary could indicate a loss of downside momentum and open the door for a broader retracement phase. However, failure to close above this area would likely reaffirm the ongoing bearish channel structure.
-MW


USD/MXN Loses Ground Toward the Weekly CloseOver the last three trading sessions, USD/MXN has posted a gain of more than 0.6% in the short term in favor of the U.S. dollar. For now, buying pressure has remained steady, partly due to the ongoing government shutdown in the United States, which has allowed the dollar to recover in the short term. This situation has triggered an outflow of capital from higher-risk currencies such as the Mexican peso. However, it is important to note that if U.S. political risk continues to extend over the coming sessions, the dollar may struggle to withstand a prolonged shutdown. In that case, indecision could once again dominate price action in the short term.
Downtrend Holds
Since early April this year, USD/MXN has maintained a steady downtrend in favor of the peso. So far, there has been no significant bullish correction to suggest that this trend has been broken, confirming that it remains the most relevant technical structure in the short term. As selling pressure returns to the market in the coming sessions, the bearish trend could continue to dominate the chart.
RSI
Although the RSI line has attempted to recover consistently, it remains oscillating below the neutral level of 50, indicating that bearish momentum continues to dominate in the short term. This confirms that the selling bias has not completely disappeared and may continue to influence movements in the coming sessions.
MACD
The MACD histogram shows very slight oscillations above the neutral zero line, suggesting that, on average, the strength of moving averages continues to generate a neutral sentiment. If the histogram remains close to zero, this could point to a scenario of price indecision in the next sessions.
Key Levels to Watch:
18.82 – Major Resistance: Located where the 50-period moving average converges with the Ichimoku cloud. A sustained breakout above this level could activate a new short-term bullish trend.
18.55 – Nearby Barrier: Corresponds to the zone marked by the downtrend line currently in place. If the price breaks above this level, the trend would be at risk and could open the way to a more relevant short-term bullish bias.
18.30 – Critical Support: Corresponds to the retracement and recent lows of the past weeks. A break below this level would reinforce the dominance of the prevailing downtrend.
Written by Julian Pineda, CFA – Market Analyst

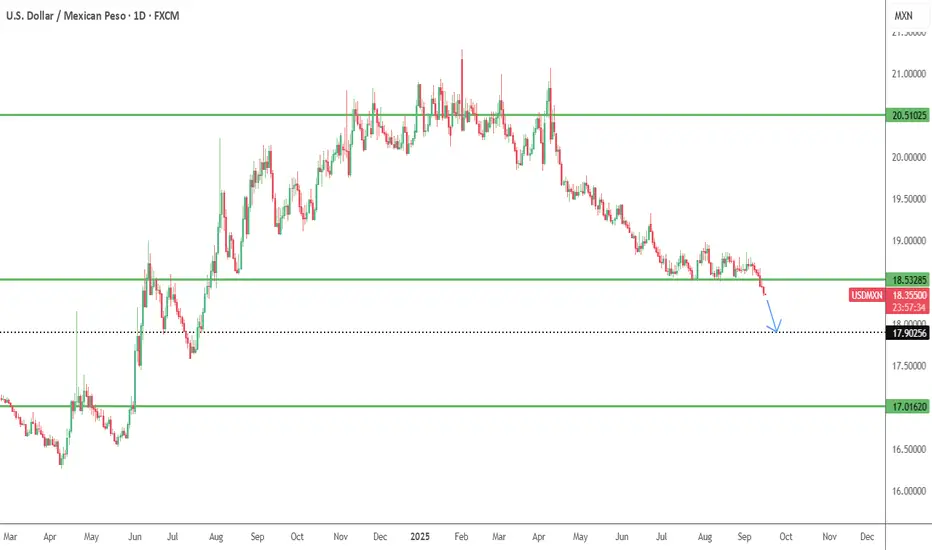
USD/MXN – Bearish Channel Holds as Price Nears Key Fibonacci SupUSD/MXN continues to trade within a descending channel, maintaining pressure after failing to reclaim the 50-day SMA (18.60) and staying well below the 200-day SMA (19.51). The broader trend remains bearish, with lower highs and lower lows firmly intact.
Currently, price is testing the 18.50 zone, just above the 61.8% Fibonacci retracement (18.17) of the 2023–2024 rally. This area is crucial: a decisive break below it could accelerate downside momentum, exposing the 17.33 support and possibly the 16.26 level, which marks the 100% retracement.
Momentum indicators lean bearish:
MACD remains in negative territory, showing continued downside bias.
RSI sits around 39, reflecting weak momentum but not yet oversold, leaving room for further declines.
If buyers manage to defend the 18.17–18.50 support range, a short-term bounce back toward 18.80–19.00 resistance within the channel is possible. Otherwise, a breakdown could confirm continuation of the broader downtrend.
USD/MXN remains under bearish control, with Fibonacci support now the key level to watch for a potential reaction. -MW
USDMXNLove Mexico, so here is my idea for short-term.
USDMXN
Take a look for correlations.
Best Regards,
USD/MXN Extends Decline Within Downward ChannelUSD/MXN continues to trade inside a well-defined descending channel that has contained price action since mid-April. The pair recently bounced from the lower boundary of the channel near 18.20, but remains capped by resistance around the 50-day SMA (18.63). The broader structure remains bearish as the 200-day SMA (19.57) continues to slope lower above price.
Momentum indicators align with this view. The RSI is currently at 35, hovering near oversold territory but not yet signaling a clear reversal. The MACD remains in negative territory with the signal line above the MACD line, showing that bearish momentum is still intact despite the recent stabilization.
If the channel persists, traders may monitor the upper boundary near 19.00 as resistance, while the 18.20 region serves as immediate support. A break beyond either side of the channel could indicate a potential shift in trend strength.
-MW
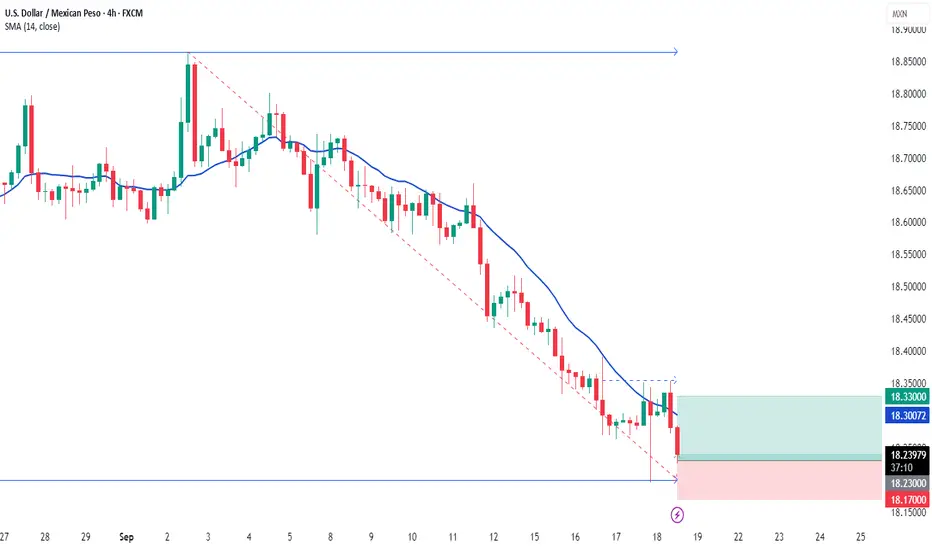
USD/MXN Analysis – 4H SetupOverall direction on the daily and weekly charts remains bearish, with the pair still in a broader downtrend. However, on the 4H timeframe we now have a potential bullish confirmation at key support areas.
📍 Setup Idea
Price has tested and respected support zones around 18.30 – 18.38.
Bullish reaction from these levels suggests a possible short-term correction before continuing the larger downtrend.
Entry is based on confirmation at these supports, targeting the next resistance area.
🎯 Targets
First target: 18.55
Extended target: 18.62 – 18.70 zone (major resistance).
⛔ Stop-Loss
Below 18.31 support to protect against further downside continuation.
⚠️ Note:
This is a counter-trend buy setup, so risk management is key. I’ll be looking to ride this corrective move upward but will continue respecting the bearish bias on higher timeframes.

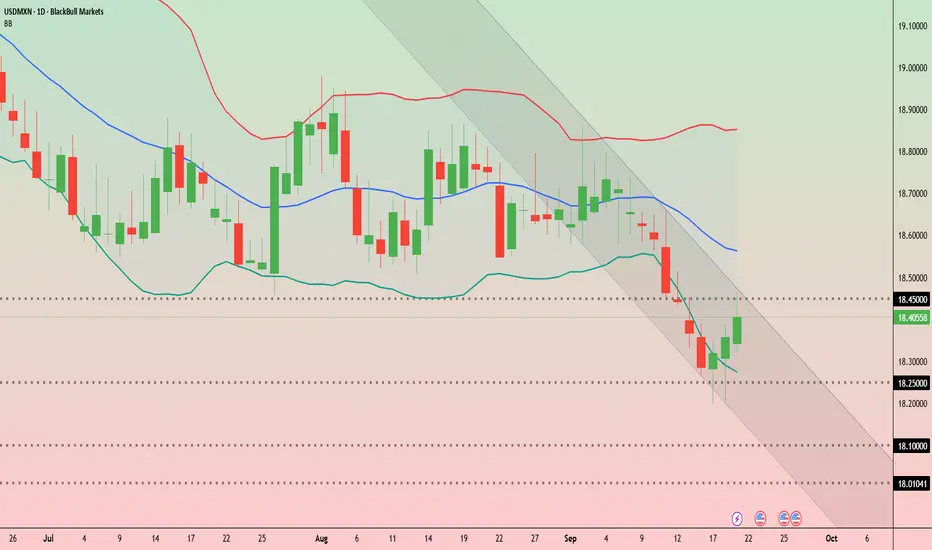
Peso resilience tested ahead of Banxico decision USD/MXN has staged a rebound after sliding to multi-week lows near 18.20. On the daily chart, price bounced off the lower Bollinger Band and is now testing the 18.40–18.45 zone.
This area also aligns with the upper boundary of the short-term descending channel that has guided the selloff through September.
A clean break above 18.45 could be the first sign of momentum shifting, opening the way toward 18.65 and the mid-Bollinger Band near 18.75. The broader trend, however, might still be bearish.
For now, support remains firm at 18.25–18.20. A failure to hold that floor could bring renewed pressure, exposing 18.10 and the psychological 18.00 level.
That technical setup frames the importance of Banxico’s upcoming decision. All 24 analysts surveyed by Reuters expect a 25-basis-point cut to 7.50%. While headline inflation has eased, August CPI data showed that core pressures are proving sticky, limiting the space for more aggressive easing.
Trade policy is also adding uncertainty. Mexico’s Economy Minister confirmed plans to lift tariffs on imported light vehicles and auto parts, raising duties on cars from Asia — particularly China — from 20% to 50%. These measures echo protectionist steps seen under the Trump administration and could complicate Mexico’s trade outlook at a sensitive time, adding volatility to peso trading.
For traders, the key question is whether the peso’s resilience will hold if Banxico delivers a cut as expected. With technical levels tightening around 18.25–18.45, the combination of policy tone and tariff rhetoric could be the catalyst for a decisive breakout or renewed downside.
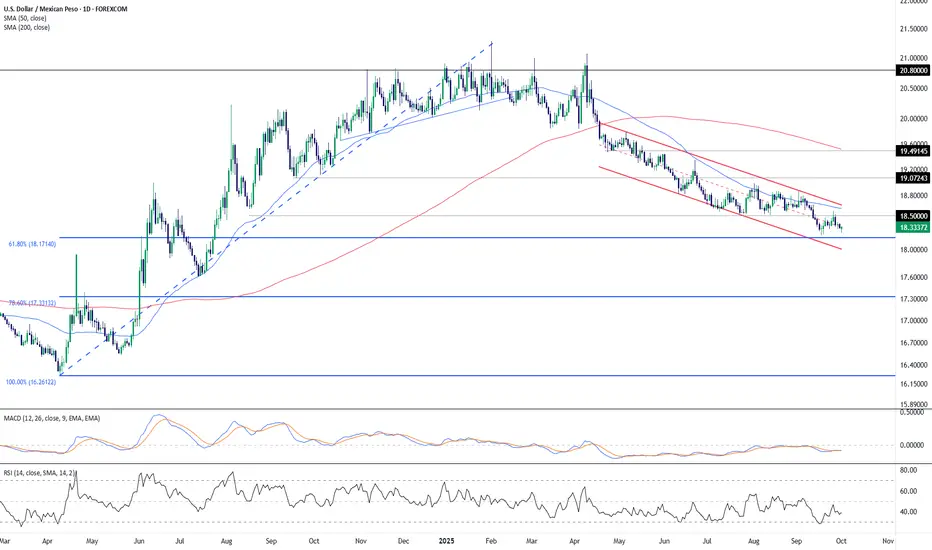
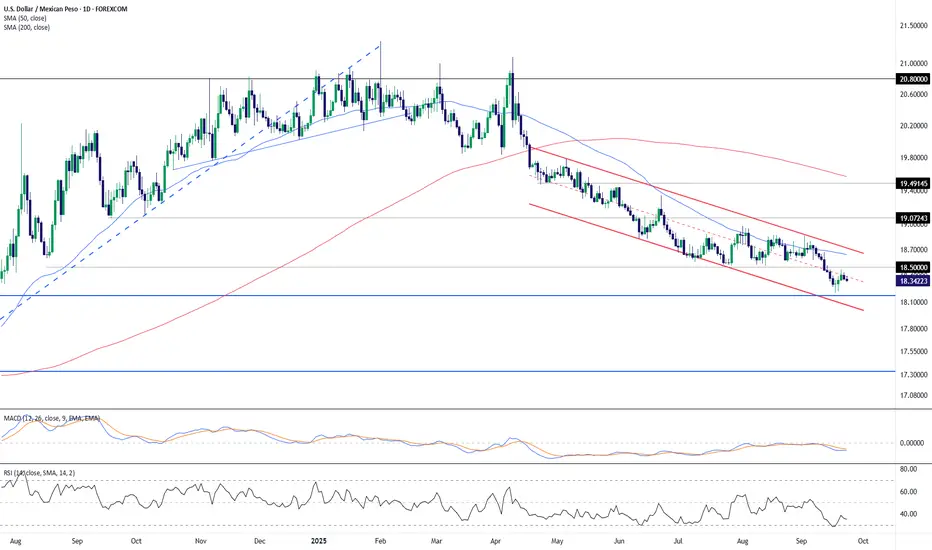
USD/MXN Breaking Down - Where Next?The chart shows USD/MXN (daily timeframe) under steady bearish pressure, extending its decline inside a well-defined descending channel. Here’s the breakdown:
Trend & Structure: Price has been moving lower since the peak near 21.00 earlier this year. It is now trading below both the 50-day SMA (18.67) and the 200-day SMA (19.61), reinforcing the bearish bias.
Support & Fibonacci Levels:
The immediate focus is the 18.17 zone, which aligns with the 61.8% Fibonacci retracement of the April–July 2024 rally.
Below that, the next major level is 17.33 (78.6% Fib), followed by 16.26 (100% retracement).
Resistance Levels:
First resistance sits at 19.07, followed by the 19.49 area near the upper channel boundary.
A breakout above the 50-day SMA could open the way to test the 200-day SMA near 19.61.
Momentum Indicators:
MACD is below the signal line, showing continued bearish momentum.
RSI (28) is in oversold territory, suggesting that sellers are losing strength and a short-term bounce may develop.
Outlook:
USD/MXN remains in a strong downtrend, but with RSI flashing oversold and price nearing the 61.8% retracement support, the pair could see a corrective rebound in the short term. However, as long as the price stays below 19.07–19.50, the broader bias remains bearish, favoring further downside toward 18.17 and possibly 17.33.
-MW

USDMXNThe Mexican peso has broken out of the range buildup to the downside. We're looking for a way to neutralize all that liquidity below and now make a small purchase above. Use small lots because it's an expensive pair to trade.
USD/MXN Analysis (330 words) The current movement of USD/MXN isUSD/MXN Analysis (330 words)
The current movement of USD/MXN is defined by a fierce contest between global monetary policy and Mexico's unique domestic strengths. **Broad USD strength** serves as the core upward catalyst, as persistent market expectations for delayed Federal Reserve rate cuts continue to bolster the dollar, exerting generalized pressure on the MXN.
Nevertheless, the Mexican peso has demonstrated notable resilience, emerging as an outperformer among emerging market currencies. Its strength stems primarily from **exceptionally high interest rates (currently 11.00%)**, which attract substantial carry trade inflows. Furthermore, **robust domestic economic data**, a surge in foreign direct investment (FDI) fueled by "nearshoring" trends, and sound fiscal fundamentals collectively form a solid foundation of support for the peso.
From a technical perspective, the **16.80-17.00** zone represents a significant technical and psychological resistance barrier. A decisive break above this area could open the path for further gains, with the next target residing around 17.20. On the downside, the **16.50-16.30** range serves as a key near-term support interval. Any flare-up in risk-aversion sentiment could weaken the MXN's carry trade appeal, prompting the pair to test resistance. Conversely, softer U.S. economic data or a sustained hawkish stance from Mexican authorities could see the exchange rate retreat toward support. The short-term outlook favors consolidation within elevated levels, with direction dependent on the outcome of this ongoing tug-of-war.

Mexican Peso VS US Dollar - Fight against the Emerging marketsTriple Top has formed on USD/MXN.
Price<20 and 200MA
Target 17.55
If you look at the last analysis I did on the USD/ZAR (South African Rand) you'll see there is weakness to come for the USD still.
And with this currency, it shows a similar move.
There are further reasons for the MExican Peso to rally
🇲🇽 High interest rates in Mexico → Banxico’s policy rate (~7.75%) offers good yields vs US, drawing in investors.
💵 Weakening US dollar & lower US yields → The USD has been under pressure, especially with soft US labor data and declining Treasury yields.
⚖️ Tariff relief & trade-talk wins → Delays / exemptions in US tariffs helped Mexico; better trade relations (USMCA) boost investor confidence.
📉 Improved risk sentiment → Global volatility eased, risk-on mood returned, pushing capital toward emerging assets like the peso.
Disclosure: I am part of Trade Nation's Influencer program and receive a monthly fee for using their TradingView charts in my analysis.

USD/MXN Faces Another Key Support ZoneOver the last three sessions, the USD/MXN pair has posted a depreciation of around 0.8%, with selling pressure remaining in favor of the Mexican peso. This move is mainly driven by speculation around the upcoming release of U.S. inflation (CPI) data, scheduled for tomorrow. Markets are looking to confirm whether inflation has started to ease in the short term, which would allow the Federal Reserve to maintain its outlook for lower interest rates. This expectation has weakened the U.S. dollar and, in turn, given the Mexican peso room to strengthen in recent sessions. If the inflation data reinforces this view, selling pressure on the pair could remain relevant.
Sideways Range Remains Intact
Although recent movements are starting to show a more evident bearish bias, they have not yet been sufficient to break the sideways channel between 19.00 pesos per dollar and 18.50 pesos per dollar. This range continues to be the most important technical formation in the short term. As long as the price fails to decisively break these levels, neutrality is likely to dominate trading in the sessions ahead.
Technical Indicators
RSI: The RSI line has crossed below the central 50 level and maintains a downward slope, indicating that selling impulses are beginning to dominate in the short term. However, since the indicator remains close to the neutral zone, the market could easily slip back into a phase of steady neutrality in the coming sessions.
MACD: The MACD histogram shows slight oscillations around the zero line, reflecting a lack of clear direction in the short term. In this context, the broader chart still points to a neutral stance.
Key Levels:
19.00 pesos per dollar – Resistance: Aligned with the 50-period moving average and the upper boundary of the Ichimoku cloud. A breakout above this level could open the way to a short-term bullish bias.
18.70 pesos per dollar – Nearby Barrier: Midpoint of the current sideways range. As long as the price trades around this area, neutrality is likely to prevail and extend the range structure.
18.50 pesos per dollar – Crucial Support: Marks the zone where recent lows have held in the past weeks. A breakdown below this level would represent a significant break, potentially confirming the continuation of the downtrend that has persisted throughout 2025.
Written by Julian Pineda, CFA – Market Analyst

Will USD/MXN Break Above its Bearish Channel?USD/MXN is showing signs of a potential shift after months of steady declines within a well-defined descending channel.
The pair recently found a floor near 18.50, which aligns with the lower boundary of the channel, and has since rebounded back above its 50-day SMA for the first time in weeks. This suggests selling pressure is easing, with early signs of a possible breakout from the downtrend.
The 200-day SMA still looms overhead near 19.70, acting as a longer-term resistance barrier, but intermediate levels such as 19.07 and 19.49 will be key checkpoints if momentum continues higher. On the momentum side, the MACD is flattening and on the verge of a bullish cross, while the RSI has lifted above 50, reinforcing a shift in short-term sentiment.
For now, the bias is cautiously turning constructive. A sustained move above 19.07 would strengthen the case for a broader recovery, while a failure to hold the 18.50 floor could see the downtrend resume. -MW

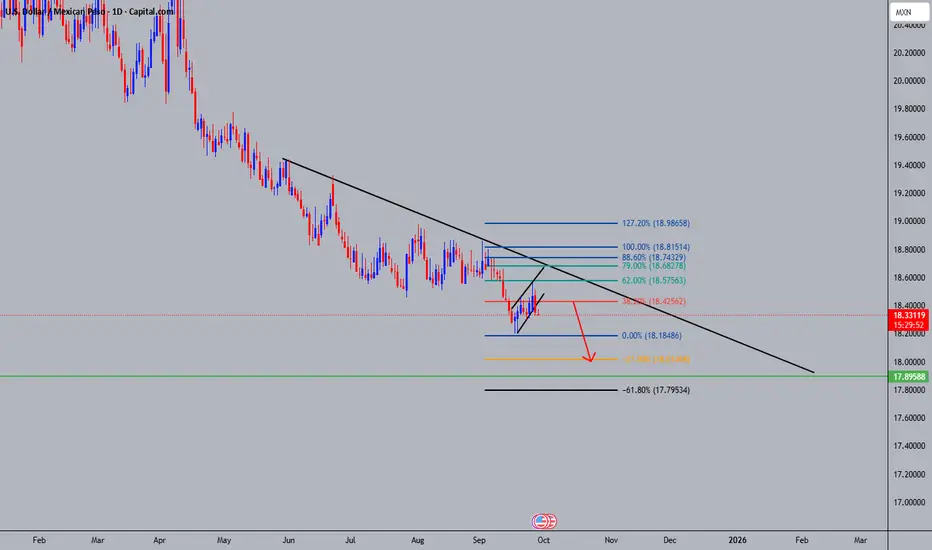
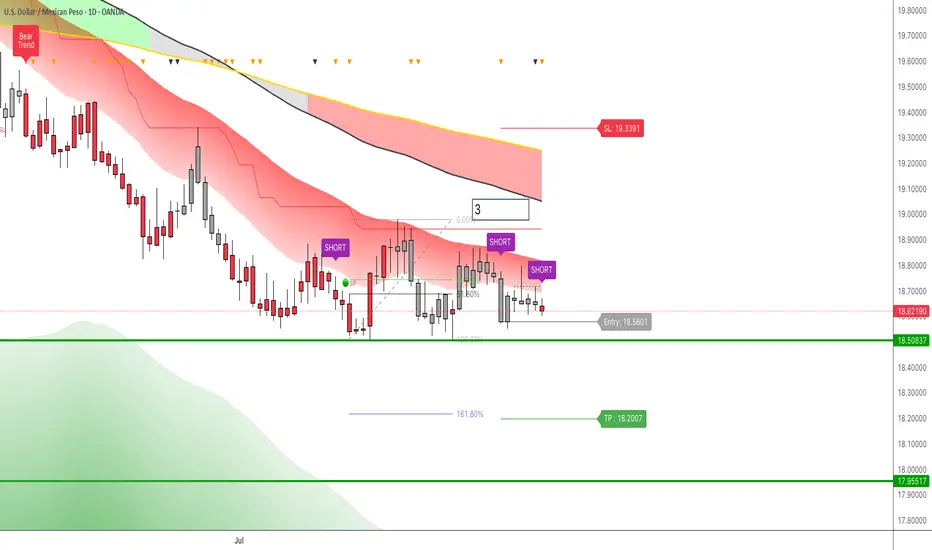
USDMXN: Short TriggerHello fellow traders,
today I share the UsdMxn chart in which we have a new Short trigger signal from LuBot.
The signal appears on the daily timeframe and is a very good trigger for the following reasons:
1. Red candles: the short structure returns bearish in favor of the main trend.
2. Downswing swings with highs that do not exceed the red fast trend cloud.
3. Double pinBar with decreasing maximums
4. Signal on the third negative swing of the weekly timeframe that has just begun after a period of lateralization / breathing space.
5. Reversal Trend signal in favor of the trigger
As the first target area we see the support level given by the weekly lows starting from 2017 to which the price has reacted in recent weeks.
Breaking this level, our main objective for this trade will be the 161.8 level of the fibonacci retracement of the latest swings which coincides with the TP suggested by LuBot.
The stop loss can be placed as a precaution on the level suggested by the indicator, or if you want to increase the return risk you can place it immediately above the last high where we will see a change in the short-term structure.
You could opt for a double trade with different sizes with these 2 methods, placing the smaller size in the riskier trade. But never exceeding the total risk of 3 or maximum 5% of the total capital of the entire trade.
👍 If you want to see other similar posts, like/boost
🙋♂️ Remember to follow me so you don't miss my future analyses
⚠️ Disclaimer: This post is for informational purposes only and does not constitute financial advice. Always do your research before making investment decisions.
FX:USDMXN FOREXCOM:USDMXN SAXO:USDMXN CAPITALCOM:USDMXN OANDA:USDMXN ACTIVTRADES:USDMXN SKILLING:USDMXN EASYMARKETS:USDMXN PEPPERSTONE:USDMXN
USD/MXN Downtrend Probing Support AgainTechnical outlook:
Trend: The pair remains locked in a downward channel since late April, with price respecting both the upper and lower boundaries. This confirms a well-defined bearish structure.
Resistance: The upper channel line and the 50-day SMA (18.75) converge as a strong cap. Above that, the 19.07–19.49 zone is the next resistance cluster.
Support: Immediate support lies near 18.58, followed by the lower channel boundary toward the 18.20–18.00 area if pressure persists.
Momentum: RSI sits just below neutral (47), not showing strong conviction yet. MACD remains in negative territory, keeping bearish momentum intact.
Moving averages: Price is still well below the 200-day SMA (19.74), reinforcing the dominant downside bias.
What this means:
USD/MXN remains under selling pressure, with rallies repeatedly capped by the channel top. Unless price breaks above the 18.75/19.00 area, the path of least resistance points lower toward 18.20. A confirmed breakout above the descending channel, however, would suggest the start of a corrective rebound.
This remains a bearish channel play, but traders should watch the interaction with the channel top closely, as a breakout could shift short-term momentum.
-MW

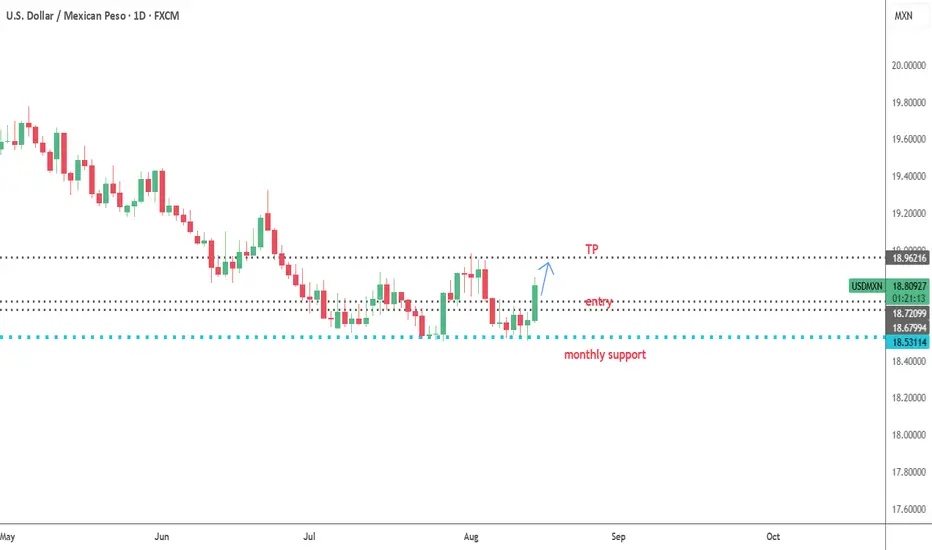
USDMXN--LONG--strong upward reaction at the long term monthly support
-entry, TP levels are as shown on chart