U.S. Dollar / Swedish Krona
No trades
Market insights


USDSEK--LONG--bullish continuation
--Daily closure above prev. week close
--ascending channel
--entry and tp levels are as shown on the chart

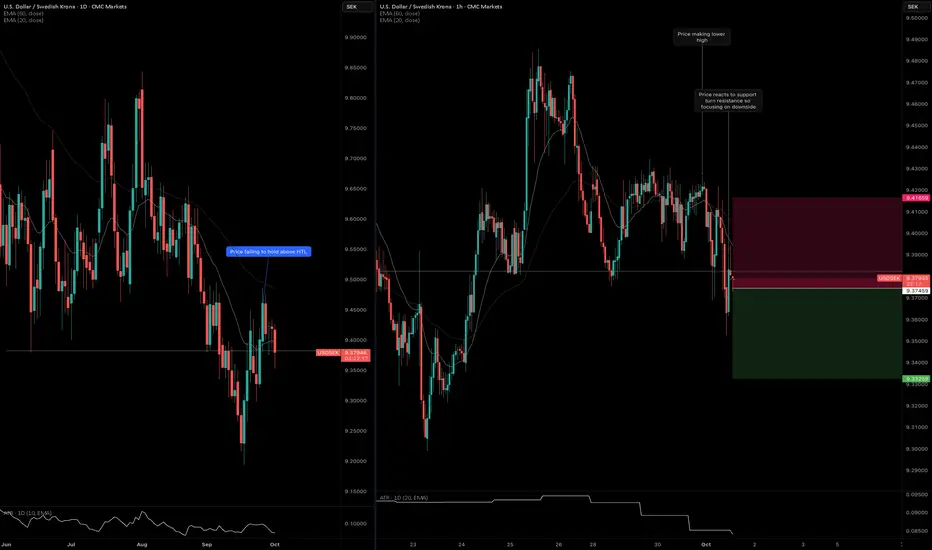
USDSEK: Price Crosses Below HTL AgainUSDSEK traded below the daily HTL, but there's weakness after price crossed back above.
On the other hand, the H1 timeframe is showing weakness. Price is failing to make higher high so I'm betting on downside momentum to pick up.
Reduced position size since we are nearing New York rollover.
TRADE UNI USDSEKTrade Analysis: Bearish
Risk: 1%
Timeframe: H4
Entry Price: 9.37681
As prices consolidate below the 200-day ema we have a chart structure break down coinciding with negative momentum.
We have initially set up a 2:1 risk reward trade and keep an eye on any news announcements.

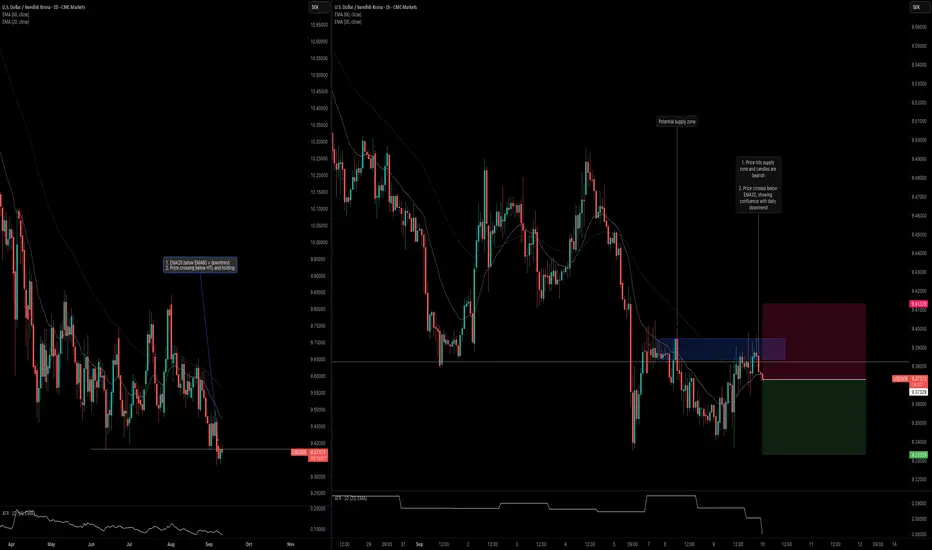
USDSEK: Trend ContinuationUSDSEK is one of the latest pairs to break below a key daily level. Here's my analysis on both the daily and intraday timeframes.
Daily Timeframe:
EMA20 is below EMA60, which indicates that this is a downtrend.
Price crossed below the horizontal trend line (HTL) and then a bullish bar formed that remain below the HTL.
H1 Timeframe:
Price entered a supply zone, and seemed to hold below it.
Price also crossed back below the EMA20, signaling confluence with the overall daily downtrend.
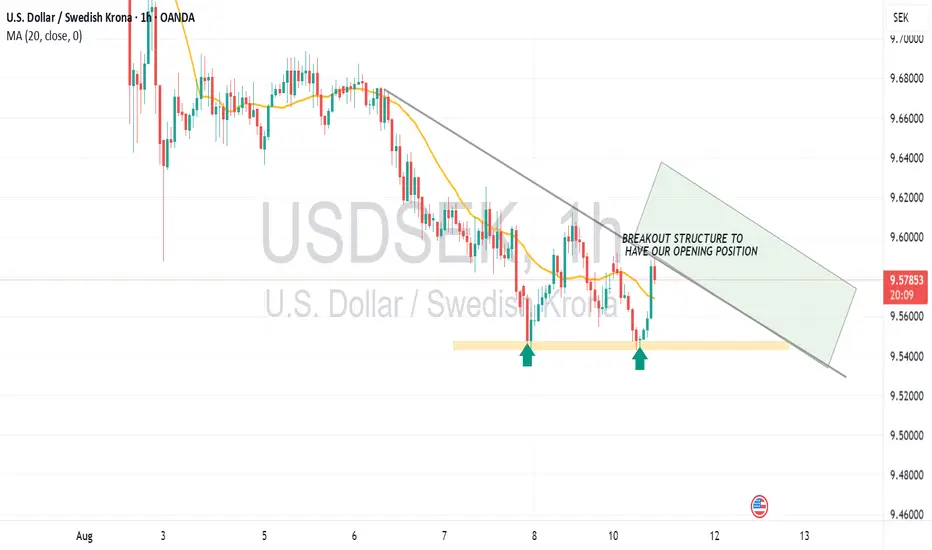
USDSEK: Trend ContinuationUSDSEK looks to resume its downtrend. This is observable based on the daily and 1-hour timeframe confluence.
Daily Timeframe:
Starting on the daily timeframe, EMA20 rests below EMA60, with price hovering below EMA20. This indicates that the overall trend is down.
In addition, price recently made a clean break below the horizontal trendline (HTL). It then tried to trade above it with no success.
1-Hour Timeframe:
Over on the lower timeframe, we see confluence as well. Price crosses below the ascending trendline, which indicates the overall trend is resuming. There's alignment on the daily and 1-hour timeframes.
My entry is based on the consolidating range that formed after the price pullback. Price is now breaking out of this range, which signals that momentum is picking up.

#021: Long Investment Opportunity on USD/SEK
In recent days, the USD/SEK exchange rate has shown a trend consistent with the global dollar's strengthening momentum. While the euro has remained in a relatively compressed range, peripheral currencies such as the Swedish krona have lost ground more rapidly, amplifying the movements. Hello, I'm Forex Trader Andrea Russo, an independent trader and prop trader with $200,000 in capital under management. Thank you in advance for your time.
🔎 Intermarket Context
EUR/USD (6E futures): stuck in a compression range between 1.1620 (support) and 1.1690 (resistance). Institutional investors are accumulating orders in these areas, with selling predominating at the upper end.
US Dollar: strong buying, typical of risk-off phases, which is reflected more quickly in the Nordic currencies (SEK, NOK) than in the euro.
Correlations: USD/NOK and USD/SEK have shown stronger upward movements than EUR/USD, confirming that dollar strength is finding greater scope in less liquid markets.
The USD/SEK pair remains attractive for strategic long positions:
A decisive breakout of EUR/USD would further strengthen the bullish momentum on USD/SEK, increasing the likelihood of reaching the 9,600 area target.

USDSEK--Double Top--it seems "double top" formation is about to form.
--entry and tp levels are as shown on chart

Lower Time-Frames on USD/SEKIn the analysis of the USD/SEK pair on lower time-frames, there is a potential for a selling movement.
Although the pair has experienced several periods of consolidation and an extended bullish trend, there is a possibility of a downside correction, associated with the context of U.S. monetary policy and the potential for interest rate cuts.
On higher time-frames (from daily to monthly), bearish candles show selling pressure. Additionally, the following technical indicators:
* 8-period Exponential Moving Average,
* 16- and 24-period Simple Moving Averages,
* Parabolic SAR,
are aligned in the same direction, reinforcing the probability of a continued downward movement.
It is important to note that, while technical analysis provides relevant signals, it is essential to also monitor economic data, news, and other fundamental factors that may influence this pair. In this analysis, only the technical component was considered.
The short position tool shown on the chart is provided for visual support only and should not be interpreted as a definitive entry signal.
Disclaimer: This analysis solely reflects my personal view of the market and does not, under any circumstances, constitute an investment recommendation.
USDSEK BUY!!Consolidating on the daily showing strong signs of a change in market structure, anticipating a push to the upside
BREAKOUT OPENING FOR LONG POSITION WITH GREAT WIN RATEInformation to be provided regard this long trends. We wait for crossing and hit long range market with 200pip chances
Bullish Case for USD/SEK: A Technical PerspectiveOANDA:USDSEK showing strong reversal from key support at 9.60 level after major breakdown. Currently consolidating in the 9.60-9.70 zone with positive momentum building on multiple timeframes. This could be the start of a significant recovery after the sharp decline from 11.00 resistance. #Forex #USDSEK #TechnicalAnalysis


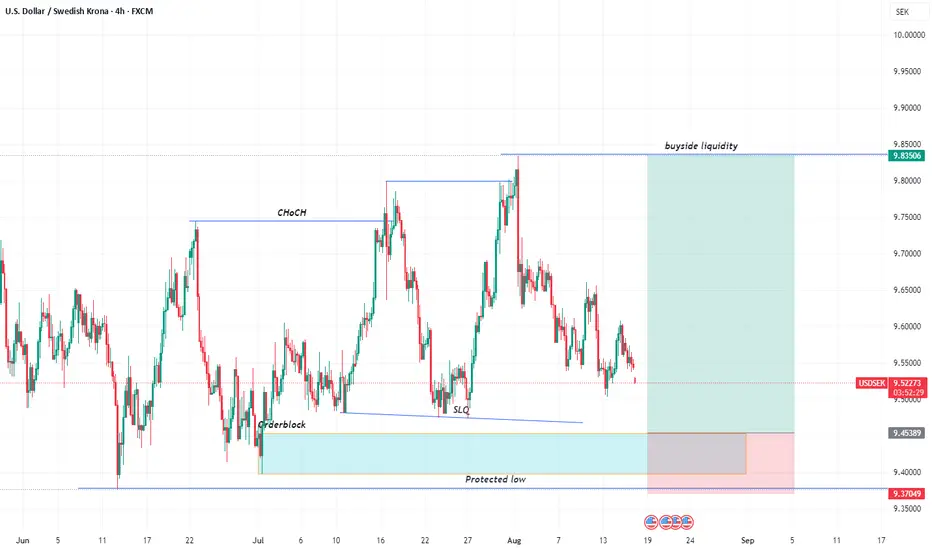
USDSEK SELLIt’s my first time trading this pair and I’m amazed at the beautiful price action and setup it’s delivered. I’ll be taking these shorts as it aligns with the daily and H4 whilst giving a complete 10/10 of my complete trading criteria. Let’s eat.
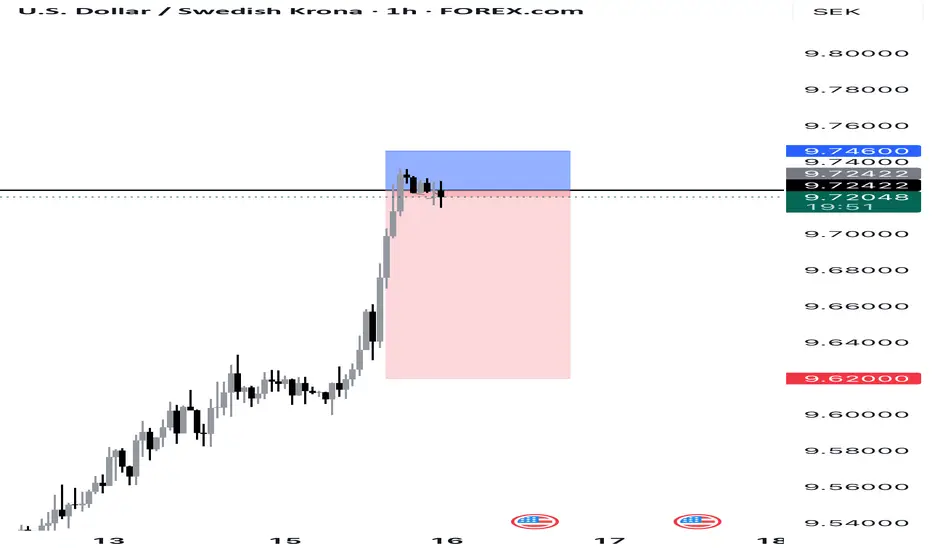
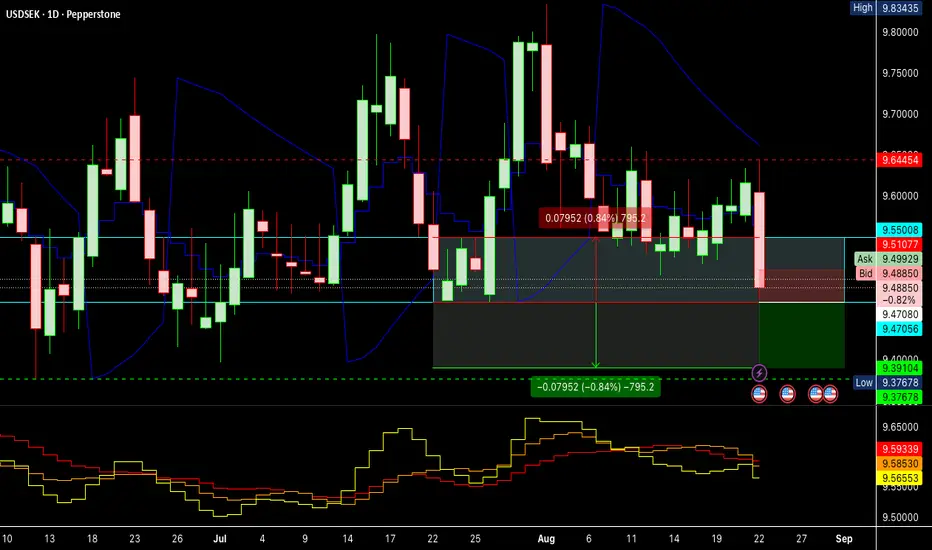
#010: USD/SEK SHORT Investment Opportunity
At the opening of the 8-hour candle, the price touched the 200-mark moving average with surgical precision on volume compression, signaling the exhaustion of the bullish movement underway since the end of June.
🔍 What strengthened the short position:
The price hit a key area defended by institutions, confirmed by increased open interest and compression in FX options between 9.68 and 9.69.
Retail investors are over 76% long, completely exposed to the wrong side.
Our entry was calculated after the false breakout, and we are positioned exactly below the zone where large traders have already loaded their short positions.
The trade is protected by future passive orders placed below 9.5000, where banks will defend their positions. Our stop is therefore outside the path of stop hunters.
📌 Short-term macro context:
Although the dollar remains strong, USD/SEK has reached a technical and statistical level that historically marks the beginning of short-term corrections, ideal for tactical trading.

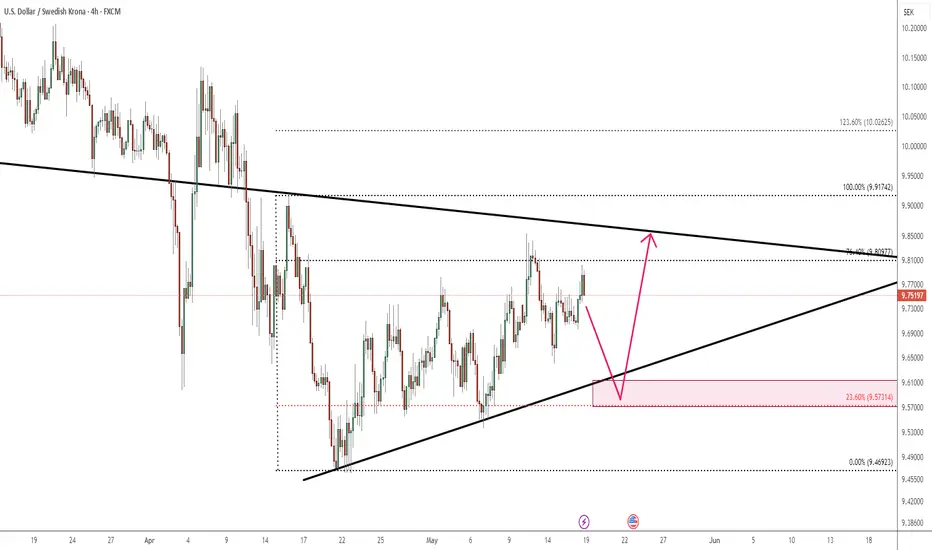
usdsek is in a trianglethe pair is now bouncing in a triangle and we predict to move further down before going up
trendline and fibo level for better understanding are drawn .
we are waiting for the result
USDSEK Bullish Breakout from Support📈 Overview from Weekly Time Frame
USDSEK is stalling at a key weekly support zone, showing signs of rejection from the downside. This level has acted as a reliable demand zone in the past.
📊 Daily Chart Explanation
Price has broken the internal bearish structure and is now holding firmly above the 14EMA. Recent candles are showing bullish momentum, indicating buyers are gaining control.
⏱ 4H Chart Explanation
The 4H timeframe confirms the shift — price broke above the weekly support zone and now maintains above the 50EMA. Structure has clearly shifted bullish with higher highs and higher lows forming.
📌 Plan
Bias: Bullish
Entry: On retracement to 4H discounted zone (look for price action confirmation)
Targets: Recent high or 1R
Invalidation: Break back below 4H 50EMA and recent higher low

Home of ABBA, IKEA, and Volvo (USD/SEK)USD/SEK has broken below major multi-year support.
While below there we are looking for shorts (i.e. bullish the Swedish krona)
The daily chart has corrected higher but the trend is down.
Another breakdown through the lows could setup another leg lower
Thoughts?

USDSEK | 21.04.2025BUY 9.53000 | STOP 9.44000 | TAKE 9.68000 | Technical view: oversold levels. Correctional return of the price.

USDSEK could jump 5%, learn why. With many top markets trading sideways, we explore USDSEK, which has gained 11% in recent weeks. Is it sustainable given global risks? Probably not. But how can we trade it? Watch the video to find out.
This content is not directed to residents of the EU or UK. Any opinions, news, research, analyses, prices or other information contained on this website is provided as general market commentary and does not constitute investment advice. ThinkMarkets will not accept liability for any loss or damage including, without limitation, to any loss of profit which may arise directly or indirectly from use of or reliance on such information

Buy idea on USD/SEKBased on
- Cycle analysis and quantitative data
- Strong Demand Zone
- Undervalued Conditions
