USDSEK trade ideas


USDSEK SHORTPrice has tested the downwards channel multiple times then broke to the upside where it has hit our price zone. price should reverse
targets are...
TP 1 - 9.27954
TP 2 - 9.21655
TP 3 - 9.13943
SL - 9.34018
have a great day guys, please use correct risk management

Usd/Sek Short awaiting. Right guys , I have been on the roll with this move , and it nearly toke 2months ahaha . but as you can see price has broke out from the range with a bullish momentum. So my next trade is to short this when it get the previous high , I know many might be skeptical of waiting till it get to the previous high / if it get there and make a new high . well i don't see the USD getting any stronger to make a 5month move , so i can possibly get 200pips from this .
Keep an eye out guys . one of the trade for 2019. £££


Historical resistance! We hope rebound!FX:USDSEK
En el último año es la tercera vez que toca esta zona de precio, en las dos veces anteriores este nivel fue rechazado y el precio bajó, la resistencia fue fuerte. Esperamos que ocurra lo mismo.
El precio está en los niveles máximos históricos, en pocas ocasiones llegó a este nivel y siempre rebotó en la resistencia.
Agosto 2018: el precio rebotó en la resistencia.
Noviembre 2018: el precio rebotó en la resistencia.
Estaríamos en condiciones de vender en este momento.
In the last year it is the third time that this price zone touches, in the two previous times this level was rejected and the price fell, the resistance was strong. We hope that the same thing happens.
The price is at historic maximum levels, rarely reached this level and always bounced on the resistance.
August 2018: the price bounced on the resistance.
November 2018: the price bounced on the resistance.
We would be able to sell at this time.


USD heading down on SEK1D - Top of trend
1HR - double top, second lower. Lower low, lower high.
Should head short

USDSEK 10 RRR longTrading Methodology:
1. An asymmetric bullish/bearish pennant is drawn using ascending and descending curved trend lines with a minimum of three price action touche points per line. The direction is determined by the previous trend.
2. The angle tool is applied from the earliest two trend touch points, beginning at the earliest touch point.
3. A trend-based Fibonacci retracement triangle is drawn starting from the earliest trend touch point and ending at the earliest touch point of the opposite trend line .
4. Based on the degree, of the earlier defined angle, the appropriate (and secret) levels are selected for the fibonacci retracement ; two levels for stop-loss and two levels for take-profit. The closest stop-loss level to the current price level is the top priority stop-loss. Though the secondary stop-loss level is often chosen for some markets such as FX and some equities in order to account for seldom unexpected resistance breaks. The greater target level is the top priority, and where majority of the shares are sold, though some may choose to close part of the position at the first target level or set it to be the stop-loss once price exceeds it. Entries should be laddered in around the levels closest of the yellow line.
This trading strategy can be applied to any market and time frame, and positions most often garner the greatest risk-to-reward ratio with the highest success rate. What more can you ask for? I will only be posting my unique trading strategy until EOY. I work solely with price action to identify pennants and apply unique trend-based fibonacci retracement levels for SL and TP levels. Reach out to me if you have any questions.


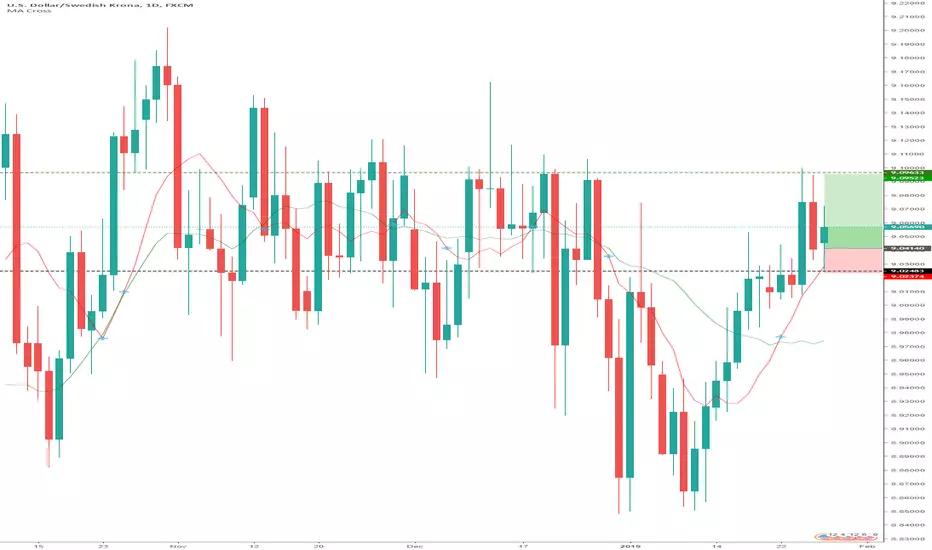
LONG USDSEKWe did follow this pair for a few weeks now. On the daily chart, it can be seen that it reached an area where it will consolidate (based on the previous patterns) until a breakout occurs. Based on our analysis, we went long and set our TP to the previous highs (9.09523) and SL to (9.02374), where support can be seen above this area.
Trade safely!
The Forex Farmers.
Krona heading south? At the top of the swing in a down-trend. 1Hr is showing lower high. Daily looks like it's also reversing. TP at previous support and equal to around 1:1.

Possible ABC correction setting upi like to trade C waves because they are fairly predictable and impulsive. So any time I see a possible double top I keep an eye on it just in case it gives us a C wave. That's what we have here a possible double top and potential C wave set up. Don't pull the trigger to soon wait for it to turn and use your trading strategy to enter.
I'll update this idea as it develops so follow to receive notification or use the links below
This is not investment advice
Steve Nixon
Trainer & Mentor @logicfxtrading


USDSEK fuera de ENTRY PRICE M15El pullback en temporalidades pequeñas ya se dio, sin embargo en temporalidades de H4 y mayores tenemos una tendencia claramente bajista a la la cual apostar.
Podremos entrar en el siguiente retroceso M15 aunque aun bajara antes de eso incluso en esta temporalidad.

TAKE PROFIT Target 8.53163 RMultiple 2.62RTarget Price 8.53163
Wait for a Daily Close above/below the wedge support resistance line. Wait for retest of the support resistance line.

USDSEK The price is creating a triangle formation. In the case of the upward breakout, the price will first reach than bounce off from the resistance at 9.9500 level. The vicinity of 8.7600 will be a target and strong support.
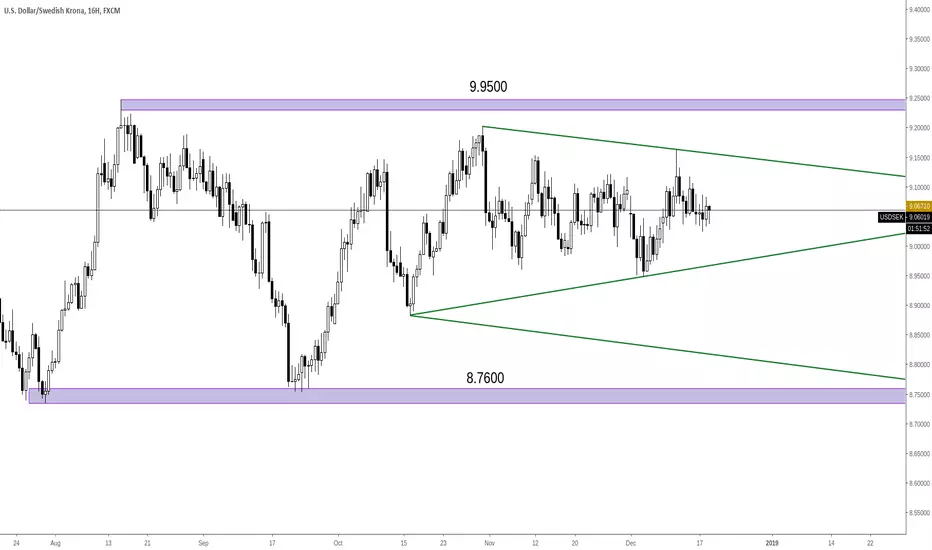
USDSEK SHORTUSDSEK are making a triangle pattern. The currency pair is currently at a very high price compared to earlier prices, with the only higher price being in 2008, 10 years ago. Because of the overheated economy in the US, and the inflated currency pair, I see the triangle pattern being the start of a very long decreasing trend. Stop loss will be right above last high.

+2.36RMULTIPLEWedge Pattern + PinBar
Wedge Support Line, Horizontal Support Resistance Line, and EMA 10 EMA 20 are in close proximity to each other.
