BTC LAST CALL BEFORE TAKE OFF??!!This area should be the last opportunity for entry before we might see the biggest bull run in the history (institution + retail FOMO). 115-116K might be a sweet spot for entry before BTC continues the rally.
DYOR ! NFA
-MaxVesting
USDTBTC.P trade ideas

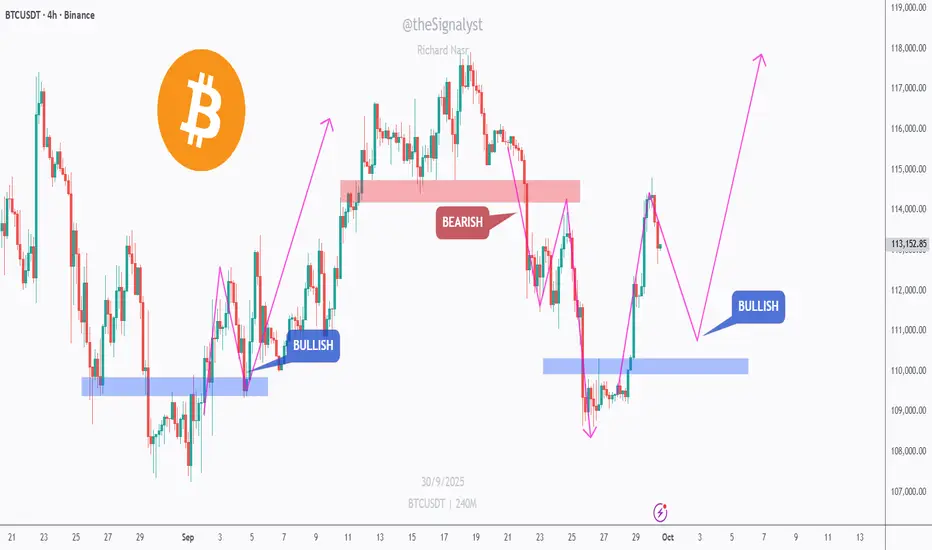
$BTC – Flip Zones Driving 4H StructureCRYPTOCAP:BTC flipped bullish after reclaiming the blue demand, then turned bearish at the red supply. We’re now pulling back from resistance, and the next clean setup likely forms on a retest of the blue zone.
🔑 Key zones
Support (blue) ~$111k area — former base of the last impulse.
Resistance (red) ~$114.5k–$115k — where sellers capped the rally.
🔎 Confluence
Prior bearish rejection at red + bullish reaction at blue.
Clear HH/HL structure only resumes if price holds blue and pushes back above red.
📊 Scenarios
Bullish 📈 Pull back into $111k (blue), print higher-low / bullish candle, then continuation toward $115k → $117k.
Bearish 📉 Lose the blue zone with a strong 4H close → open room for a deeper dip before buyers try again.
⚠️ Disclaimer: This is not financial advice. Always do your own research and manage risk properly.
📚 Stick to your trading plan regarding entries, risk, and management.
Good luck! 🍀
All Strategies Are Good; If Managed Properly!
~Richard Nasr.
$BTC to $150KLast quarter is extremely bullish for BTC. It seems that it's going through a pattern after $150K it'll drop and that will be the last drop you'll see in a while, it won't be going down $100K until maybe 2027, 2026 is primed for BTC to go beyond $200K with a personal target of $260-70K a BTC.

The range zone will break to the upside and heavy gain after We set our entry on 110K$ and stop loss is below the range zone support because the pattern of fall may happen again but i think soon that 110K will touch again and we would have a breakout to the upside and confirmation of that is 110500$ touch but we open earlier and near 110K because i want signal with 1:2 R:R(RiskReward) just like what you can see on chart so we risk a little bit and open this signal on 110K and below 113K we are out to save some profit.
DISCLAIMER: ((trade based on your own decision))
<<press like👍 if you enjoy💚

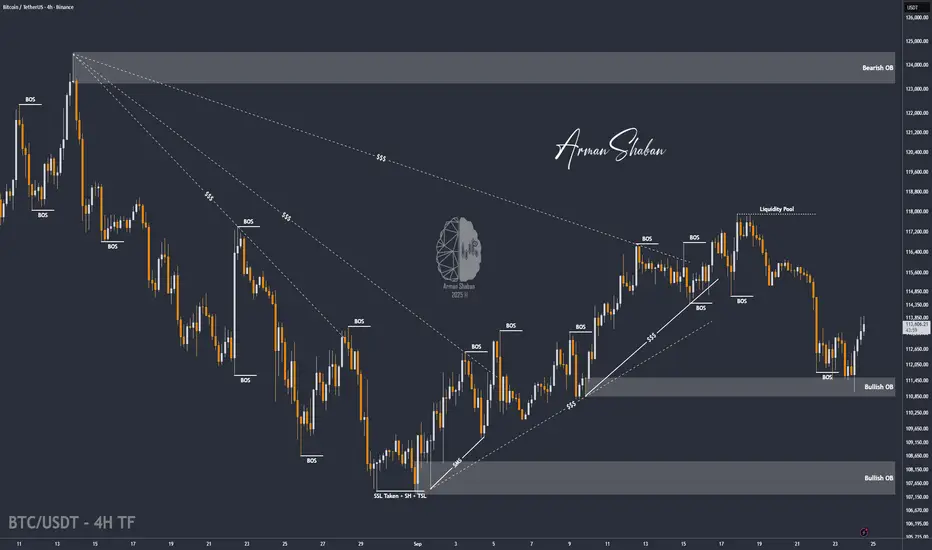
BTC/USDT | BTC Bounce After $111K Dip – Liquidity Gap in FocusBy analyzing the Bitcoin chart on the 4-hour timeframe, we can see that after a heavy correction down to $111,000, the price found demand again and is now trading around $113,600.
I expect Bitcoin to continue rising to fill the liquidity gap, with the first target at $114,150. Other targets and scenarios will be shared tomorrow!
Please support me with your likes and comments to motivate me to share more analysis with you and share your opinion about the possible trend of this chart with me !
Best Regards , Arman Shaban
Bitcoin’s Next Big Move: Buy the Dip Before $138K!Hello guys!
Bitcoin is once again at a critical stage, and the chart is giving us a clear roadmap for the next move. Let’s break it down:
Current Setup
Price is holding above $108K–109K and has shown strength around the $103K support zone.
The structure remains bullish as long as BTC trades above $100K.
Strategy
1- Entry zones for buying:
Current market price (~$109K)
Support zone around $103K (a good second chance for buyers).
2- Stop-loss: Around $99K, just below the psychological and structural support of $100K.
3- Target: Upside potential points toward $138K , which aligns with the next major resistance zone.
⚠️ Risk Factor
If BTC breaks below $100K, the bullish phase ends, and we should expect a bearish shift in momentum. In that case, caution and defensive trading will be the smarter play.
📌 Conclusion
For now, the play is simple:
👉 Stay bullish and buy dips while BTC is above $100K.
👉 Watch the $103K zone for re-entries.
👉 Protect your capital with a $99K stop-loss.
👉 Aim high-> the next big target sits around $138K.

Impulse Wave 5 Near Completion: Short Setup Ahead?The 5th wave of the current impulse structure is close to completion. Price action is showing exhaustion and the drop in volume is confirming that momentum is fading. At this stage, risk for longs is increasing and the probability of a corrective phase (A-B-C) is high.
Traders should keep an eye on bearish confirmation signals such as trendline breaks, bearish engulfing bars, or supply zone failures. A short setup could develop soon if price rejects with conviction.
Patience is key — Wave 5 can stretch, but once it’s done, downside pressure usually accelerates quickly. Manage risk carefully and adjust sizing according to your strategy.

Deep Learning Model for 24-Hour BTC Price PredictionHi everyone,
I’ve developed a deep learning AI model designed to predict BTC's price movement over the next 24 hours on the 15-minute timeframe.
It’s important to note that this model does not directly provide exact entry points for trades. Instead, it indicates the likely direction of the market, meaning you’ll still need basic trading knowledge to apply it effectively.
After testing it over the course of one month, I achieved a success rate of around 90% in my trades when using the model as part of my strategy.
The model was trained using the following features:
Time-related: Hour, DayOfWeek
Price & volume lags: Close_lag_1, Close_lag_2, Close_lag_4, Close_lag_8, Close_lag_12, Volume_lag_1, Volume_lag_2, Volume_lag_4, Volume_lag_8, Volume_lag_12
Moving averages & statistics: MA_4, Std_4, Dist_MA_4, MA_16, Std_16, Dist_MA_16, MA_48, Std_48, Dist_MA_48, MA_96, Std_96, Dist_MA_96
Technical indicators: Return_log, MACD, RSI
Hourly Forecast for the Next 24 Hours

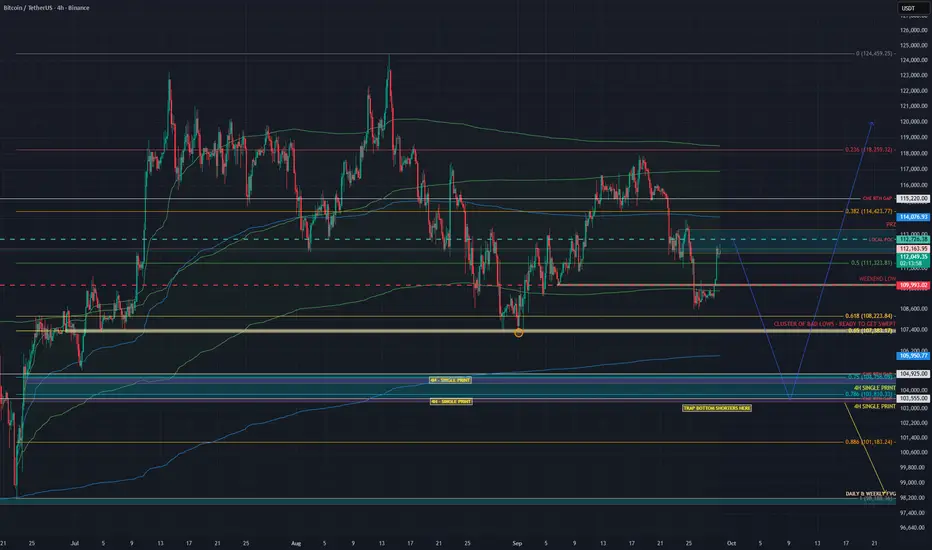
SHORT BITCOIN – THE TRAP IS BELOW, NOT ABOVE!Traders,
From the current levels around $112.8K–$113K, I believe Bitcoin is setting up for another leg down into the $104K region.
Why? Because at current levels we already have multiple Anchored VWAPs (AVWAPs) lining up from different swing high → low auctions, which makes this area heavy resistance.
That means the probability of retracing higher is limited, and instead, the market is more likely to drop into $104K — where there’s significant unfinished business — before a proper bounce can occur.
🔮 Hypothesis
From current levels ($112.8K–$113K), price will reject and move down toward $104K.
Retracement higher than $113K is unlikely given AVWAP confluence + resistance stack.
The $104K region will act as a bounce zone, potentially with a Swing Failure Pattern (SFP) wick.
📊 Data & Confluence
🔻 Why $104K Is a Magnet
HTF Point of Control (POC): The high-volume node where markets naturally seek equilibrium.
HTF AVWAP: Anchored VWAP from major pivots aligns here, marking fair value.
4H TPO Single Prints + Fib Retracements (0.75–0.786): Gaps in auction structure converge with key Fibonacci levels.
CME Gap: The $104K CME RTH gap still needs filling — markets often return here for balance.
Sept 1st Low (Weekly TPO): Poor excess signals unfinished auction business, pulling price back down.
🔼 Why Current Levels Won’t Hold
Clustered AVWAPs (different swing high → low auctions): Acting as strong dynamic resistance.
Multiple POCs at current zone: Volume saturation suggests exhaustion.
Fibonacci confluence + harmonic pattern: Pointing to lower continuation.
💵 Macro Flows
USDT Dominance (USDT.D): Breaking higher → capital shifting to stablecoins → bearish BTC.
Aggregated CVD: Spot CVD drifting slightly higher, but futures CVD flat with no OI expansion.
→ No real demand behind the move.
📌 My Take
Bitcoin is most likely to:
Reject from current AVWAP resistance ($112.8K–$113K).
Drop into $104K, clearing imbalances and luring in shorts below the 0.786 fib.
Trigger a wick/squeeze move up (Swing Failure Pattern) to trap those late shorters.
⚠️ If $104K fails to hold, next target is the imbalance zone around $98.5K.
✅ Conclusion
The market is loaded with resistance at current levels. Until that’s broken with conviction, the path of least resistance is down into $104K.
That’s where the real battle will be.
Trade safe, manage risk, and don’t get trapped on the wrong side of the wick.
BTC — Sunday Liquidity TrapAfter hitting the BIG resistance at $117,896 (0.618 Fib retracement), BTC rejected as anticipated and started its current downtrend. The anchored VWAP from the $117.9K high has been an excellent guide, acting as resistance → most recently at $113,800, where it provided a clean short entry.
Over the weekend, BTC has traded sideways. We just saw a small pump to clear the range highs and take out buy-side liquidity, a common setup before markets rotate lower to sweep sell-side liquidity.
Key Confluence Zone
The next level of interest sits around $108,250, where multiple factors align:
Monthly Open: $108,246.36
Daily Level: $108,246.35
0.618 Fib Retracement: $108,236.67
Liquidity cluster with many stop-losses residing here
If this zone fails to hold, the next downside interest lies at:
Key Low: $107,255 → possible SFP area
0.666 Fib Retracement: $106,975.52 → additional support
🟢 Long Trade Setup
Entry: Long around $108,250 (mOpen confluence zone)
Stop-Loss: Below 0.666 Fib retracement (~$106,975)
Take Profit: TP1 → $111K, if volume expands → trail stop for higher targets
R:R: ~1:2
Market Insight
Sunday pumps are notoriously unreliable, often designed to trap traders into late longs before a pullback wipes them out. This setup reflects exactly that dynamic.
Indicators used
DriftLine — Pivot Open Zones → For identifying key yearly/monthly/weekly/daily opens that act as major S/R reference points
➡️ Available for free. You can find it on my profile under “Scripts” and apply it directly to your charts for extra confluence when planning your trades.
_________________________________
💬 If you found this helpful, drop a like and comment!

Very important Bitcoin will soon reach the 41k areaVery important Bitcoin will soon reach the 41k area

BTCUSDT LongBullish points
1. Support area
2. Daily breaker block
3. Tested 0.68 fib level of last
aggresive buy leg
4. Hidden bullish divergence
5. Price above Bull market
support band

Bitcoin Channel Analysis - Breakout or Breakdown Incoming?Bitcoin has been trading within a pristine ascending channel for nearly a year and is now at a critical decision point after rejecting from key resistance.
The Setup:
📊 Pattern Formation: Year-Long Ascending Channel
- Clean parallel channel structure established since early 2024
- Lower boundary providing consistent support with multiple successful tests
- Upper boundary acting as strong resistance, most recently at $121,682
- Mid-channel support zone around $115,000-$117,000 has been reliable
- Current price: $122,205, consolidating after rejection from upper resistance
🎯 Potential Targets:
Bullish Scenario: $130,000-$135,000 zone
- Measured move from channel breakout above $122,500
- Continuation of the established uptrend structure
- Next major psychological level at $130K
Bearish Scenario: $105,000-$108,000 zone
- Drop to lower channel boundary if current support fails
- Would still maintain channel integrity
- Critical support at $100,000 - breakdown below invalidates entire structure
What to Watch For Validation:
✅ Decisive Close Above $122,500
- Need a strong 4-hour or daily candle close above this level to confirm breakout
- Not just a wick testing - require solid body close with conviction
- Previous resistance at $121,682 must flip to support
✅ Volume Surge
- Breakout must occur with significantly elevated volume
- Recent volume has been declining during consolidation (visible in lower panel)
- Need at least 2-3x average volume to confirm genuine buying pressure
✅ Support Hold at Mid-Channel
- Current pullback testing $115,000-$117,000 zone
- This area has provided multiple bounces throughout the channel
- Strong bounce with increasing volume = bullish continuation signal
✅ Follow-Through Above $125,000
- After confirming breakout, price should push toward $130K relatively quickly
- Hesitation or immediate rejection would suggest weak momentum
- Watch for sustained trade above previous resistance
Key Levels:
🔸 Resistance: $121,682 (recent rejection) → $122,500 (breakout confirmation) → $130,000 (target)
🔸 Support: $115,000-$117,000 (mid-channel) → $105,000-$108,000 (lower channel) → $100,000 (invalidation level)
🔸 Volume Context Declining volume during pullback is actually bullish - suggests lack of seller aggression
Pattern Context:
Ascending channels represent sustained bullish momentum with well-defined risk parameters. The current consolidation near the upper boundary, combined with declining volume, suggests coiling energy for the next significant move. The 9-day pullback of -7.55% is healthy profit-taking, not distribution.
Invalidation Signals:
❌ Break and close below $112,000 with volume
❌ Breakdown through lower channel boundary (~$105K)
❌ Multiple failed attempts at $122,500 with declining volume
❌ Close below $100,000 = trend reversal confirmed
The channel must resolve. Bitcoin is compressing near resistance after a year of respecting this structure. A breakout above $122,500 with volume opens the door to $130K+. However, failure to hold mid-channel support could send us to test the lower boundary around $105K.
Watch for that decisive move - volume will tell the story.
Not financial advice - DYOR.

BTC (LONG)BINANCE:BTCUSDT
Entry range (111600- 113000)
SL 109977
T1 124 900
T2 131 600
Extra Target is optional 139000
_______________________________________________________
Golden Advices.
********************
* collect the coin slowly in the entry range.
* Please calculate your losses before the entry.
* Do not enter any trade you find it not suitable for you.
* No FOMO - No Rush , it is a long journey.

Bitcoin Liquidity GrabBitcoin came back into discount pricing (between the swing low and swing high), and it looks like it is still waiting for the next catalyst for the next leg up.
We are currently still in the weekly imbalance, which a lot of times will act as a demand zone. Before we can take a long position, we need to clear the "bump in the road" — or in this case, liquidity.
I will wait for price to take out the liquidity under the equal lows around 107.2k, and then I’ll wait for a CHoCH on the 1H–4H before looking for a long trade.
Happy trading,

Bitcoin : Stay heavy on positionsBitcoin : Stay heavy on positions (2x~3x)
Maintaining the same outlook as before.
** This analysis is based solely on the quantification of crowd psychology.
It does not incorporate price action, trading volume, or macroeconomic indicators.

BTC “Blow-off” confirmed, what’s next?Newest chart (H&S with RS near 118.7k, high 124.5k, supports 110.9k / 108.7k / 95.1k / 96.5k / 77.3–74.5k) shows we did get the blow-off extension I had at 13%. We now re-weight the next path conditional on a completed blow-off.
🎯 Short to $73K — plan, gates, and guardrails
It’s feasible only after losing: $110.9K → $108.7K → $103–101K → $96–95K
Risk guardrails (objective invalidations) 🚧
Primary invalidation: Daily close > 118.7K (your RS/supply).
Hard invalidation: Momentum HH > 120.5K and sustained bid above; expect squeeze back to 123–125K.
Trailing logic:
After 110.9K breaks → trail to entry.
After 108.7K breaks → trail to 111.0–111.5K.
After 101K breaks → trail to 105–106K.
After 95K breaks → trail to 99–100K.
Position management 🔧
Scale targets: 108.7K, 103–101K, 96–95K, 90–88K, 83–78K, 75–73K.
What would help the $73K path 📉
Clean acceptance below 95K (no immediate reclaim).
ETF flow cool-off (you’ve been tracking this) + weak spot bid during futures-led dumps.
CME term structure flattening/inversion into breakdowns.
OBV / CVD making lower lows as price ranges (distribution tells).
What would hurt it 📈
Swift 118.7K reclaim on strong spot-led buying.
Persistent positive ETF net inflows on down days.
Perp funding resetting positive while price refuses to break 108.7K.
Aligned with the post–blow-off distribution thesis. Hold the short only as long as 118.7K isn’t reclaimed and the market accepts below 110.9K → 108.7K. The hinge zone is 96–95K; lose it cleanly and $83–78K → $75–73K opens up. Manage via staged profits and a rising trailing stop so the trade can breathe on the way to $73K objective.

$BTC Lower highs....too early to celebrateBTC gets a golf clap today for wedging itself from 3 days of staying flat and doing nothing. Zooming out, we're seeing something a little different. Downward channel, and price movements swinging back and forth. Mid-week with the gov shutdown, we may see a bit pull down below 110k. This short squeeze does not compensate for the ~10% drop we've been seeing.

BTC EQL sweep then movement higherI’m looking at the highlighted equal lows, ideally expecting a sweep and then possibly a retest of the marked imbalance around the 104K level in the first half of the week.
From these levels, I’d like to see a strong reaction and a return back into the range to target the build-up of shorts, possibly with a move above the established highs or at least towards the ~120K area.

Will US Gov Shutdown Continue to Support Bitcoin Prices?Fundamental approach:
- Bitcoin prices this week have been driven by renewed risk appetite and positive spot ETF inflows, with sentiment supported by the US government shutdown’s data blackout and expectations of further Fed easing as labor market signals soften. The institutional demand narrative strengthened as US spot ETFs returned to inflows, with assets under management remaining elevated, thereby bolstering dip-buying interest.
- Drivers included a modest uptick in the ISM manufacturing PMI, which is still in contraction, and ADP private payrolls showing job losses, reinforcing the view that looser policy could persist and liquidity conditions may remain supportive for the crypto beta. The shutdown has curtailed government data releases, prompting markets to rely on private indicators and amplifying sensitivity to risk sentiment and ETF flow headlines throughout the week.
- Bitcoin prices could sustain momentum if ETF inflows remain positive and macro uncertainty keeps rate-cut expectations intact, though volatility may rise with limited official data.
Technical approach:
- BTCUSD broke the triangle pattern and rose higher, positioning itself above both EMAs, indicating an upward momentum.
- If BTCUSD remains above 117000, the price may retest the previous swing high at around 123000.
- On the contrary, closing below 117,000 may prompt BTCUSD to retest the broken triangle pattern and the area between both EMAs.
Analysis by: Dat Tong, Senior Financial Markets Strategist at Exness

BTC/USDT: Bullish Surge to 136K?BINANCE:BTCUSDT is gearing up for a bullish move on the daily chart , with an entry either from the current level or a pullback to the specified trendline .
The target at 136000 aligns with the next major resistance, signaling strong upside potential. Set a stop loss on a daily close below 108500 to manage risk effectively.
A break above 118000 with solid volume could trigger this surge, driven by market sentiment and BTC dominance. Watch key news! 💡
📝 Trade Plan:
✅ Entry: From current price or on a pullback to the trendline
❌ Stop Loss: Daily close below 108,500 to manage risk
🎯 Target: 136,000 (next major resistance)
Ready for this lift-off? Drop your take below! 👇

BTCUSDTHello Traders! 👋
What are your thoughts on BITCOIN?
Bitcoin is still moving inside an upward channel.
After its strong rally, the price has entered a corrective phase and is now positioned around the midline of the channel.
We expect the correction to extend toward the support zone and the lower boundary of the channel after some short-term fluctuations.
From that area, a potential rebound could trigger the next bullish wave.
If support holds, Bitcoin is likely to resume its upward movement toward the upper boundary of the channel.
As long as the price stays above the key support area, the medium-term outlook remains bullish.
What do you think? Will Bitcoin bounce from the channel bottom and head for the top again?
Don’t forget to like and share your thoughts in the comments! ❤️

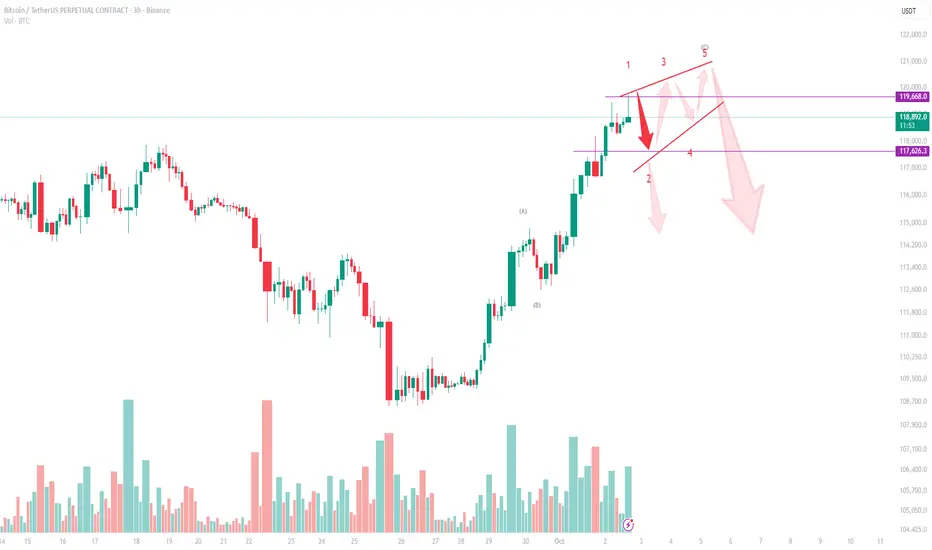
Bitcoin (BTC/USDT) Technical Analysis – 3H ChartWave Structure Outlook
Bitcoin is currently trading near $119,300, where the wave structure suggests a possible Ending Diagonal formation. This leaves us with two bearish scenarios to monitor:
Scenario 1 – Immediate Downside After 1–5 Completion
The 1–5 wave sequence may already be completed.
If so, the market could trigger an immediate downside move, breaking wedge support.
First critical level is $117,600. A clean break below this level would confirm the start of a deeper correction, opening the way toward $115,000 – $113,000.
Scenario 2 – Choppy Ending Diagonal (Light Red Arrows)
Alternatively, BTC may still extend within an Ending Diagonal.
This would mean choppy, back-and-forth price action (small up-and-down moves) before the final breakdown.
In this case, price may retest the $119,800 – $120,000 zone, but the structure remains corrective, and the eventual expectation is still bearish reversal.
Key Levels to Watch
Resistance: $119,800 – $120,000 (upper wedge boundary)
Support: $117,600 (first breakdown level)
Bearish Targets: $115,000 → $113,000
Conclusion
BTC is losing momentum at the end of a 5-wave structure. Whether the market follows Scenario 1 (immediate breakdown) or Scenario 2 (choppy diagonal ending before reversal), the overall outlook is bearish in the short term.