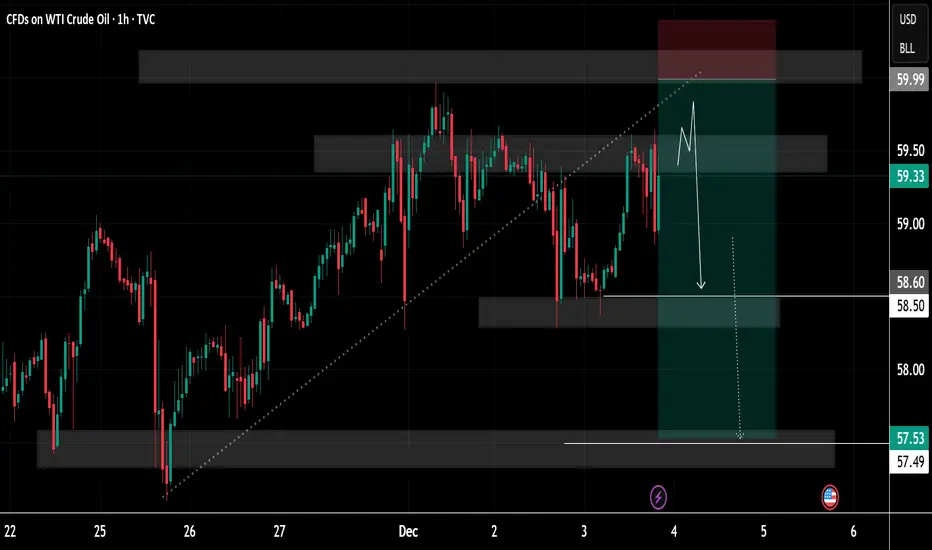
Oil Price Update – Clean & Clear ExplanationOil (1-hour timeframe) analysis focused on a potential sell (short) opportunity. Price is currently trading around 59.40, inside a marked supply zone where previous selling pressure has appeared.
A possible scenario is illustrated:
• Price may push slightly higher into the upper part of the suppl
About CFDs on Crude Oil (WTI)
Crude Oil is a naturally occurring liquid fossil fuel resulting from plants and animals buried underground and exposed to extreme heat and pressure. Crude oil is one of the most demanded commodities and prices have significantly increased in recent times. Two major benchmarks for pricing crude oil are the United States' WTI (West Texas Intermediate) and United Kingdom's Brent. The differences between WTI and Brent include not only price but oil type as well, with WTI producing crude oil with a different density and sulfur content. The demand for crude oil is dependent on global economic conditions as well as market speculation. Crude oil prices are commonly measured in USD. Although there have been discussions of replacing the USD with another trade currency for crude oil, no definitive actions have been taken.
BIG Clue: USOIL Price Compressing Above ResistancePrice is currently compressing, and suggests that a strong impulsive move is likely once price strongly escapes the structure.
See how price has been pressing directly against the upper trendline. This is an area to pay close attention to because repeated tests of this descending resistance can wea
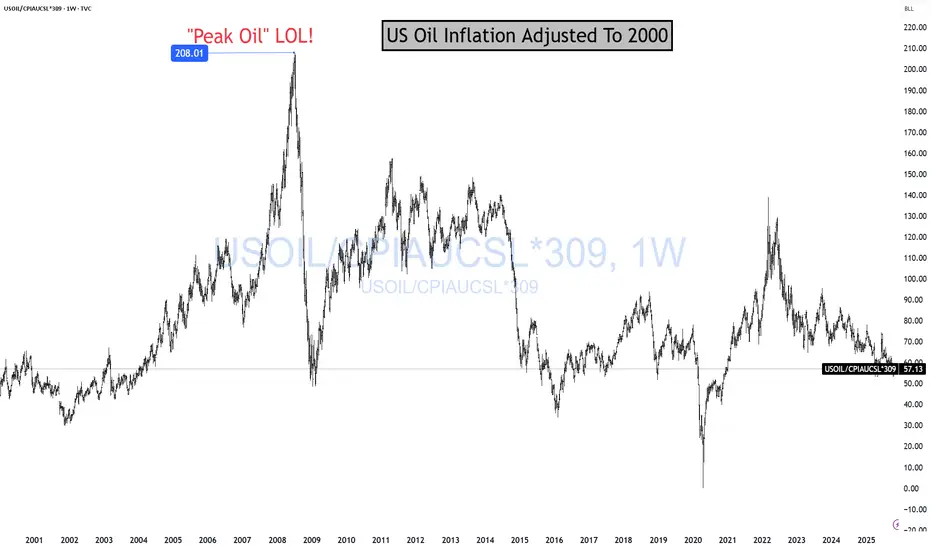
OIL Is Cheap For A ReasonOil is cheap because the global economy sucks! And it is "sucking" more and more every day. That's why Oil is on sale! Cheap! Cheap! And likely going to get more "cheap! cheap!" Me love you long time! Before I continue, story time.
In 2008, I could not convince anyone for the life of me that "PEAK
WTI Oil - Price Squeeze
Fundamental backdrop
Global supply continues to outpace demand: new data shows world oil output rising sharply while demand growth remains modest, pushing inventories up toward multi-year highs.
Still, recent geopolitical tensions — including strikes on Russian infrastructure — have kept a ris


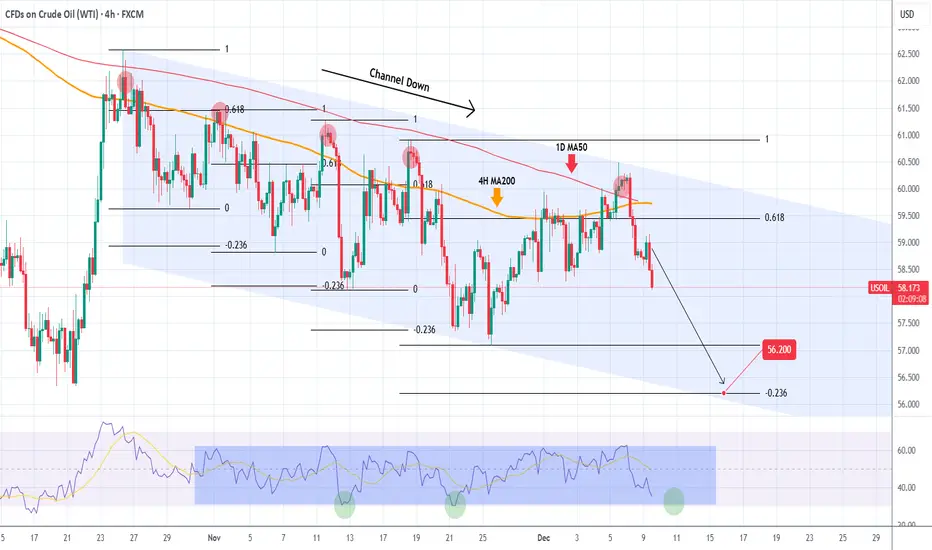
WTI OIL 1.5 month Channel Down started new Bearish Leg.WTI Oil (USOIL) has been trading within a 1.5-month Channel Down (since the October 4 High), that priced last Friday its latest Lower High, this time above the 1D MA50 (red trend-line).
That initiated the new Bearish Leg (also confirmed by the 4H RSI rejection at the top of its range). All 4 previo
Bullish on USOILPrice broke consolidation, and retested marked arear now I'm in the buys back to supply, risk management at play (always) Lets see if this plays out
NB: Documenting my trades and learning in the process, this is not financial advise just another trader making her way to profitability

OIL: The Bearish Movement Could Resume AgainOIL: The Bearish Movement Could Resume Again
OIL tested a strong resistance zone near 60. This area corresponds also with a strong structure zone and also a psychological price that pushed the price down several times.
OPEC continues to increase the OIL production so the odds are to go down again

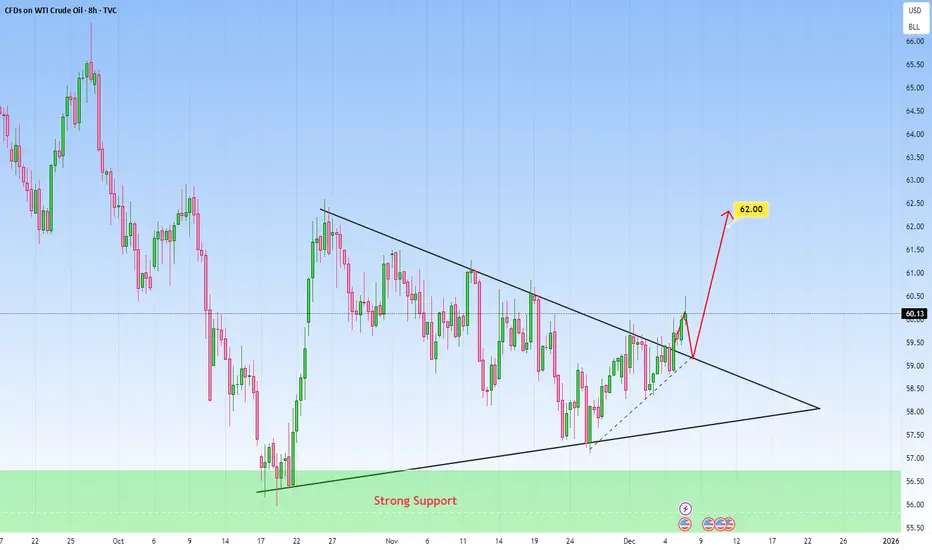
Market Analysis: Oil Price Gains TractionMarket Analysis: Oil Price Gains Traction
Crude oil price is recovering and it could climb further higher toward $62.00.
Important Takeaways for Oil Price Analysis Today
- Crude oil prices are moving higher above the $59.00 resistance zone.
- There is a connecting bullish trend line forming w

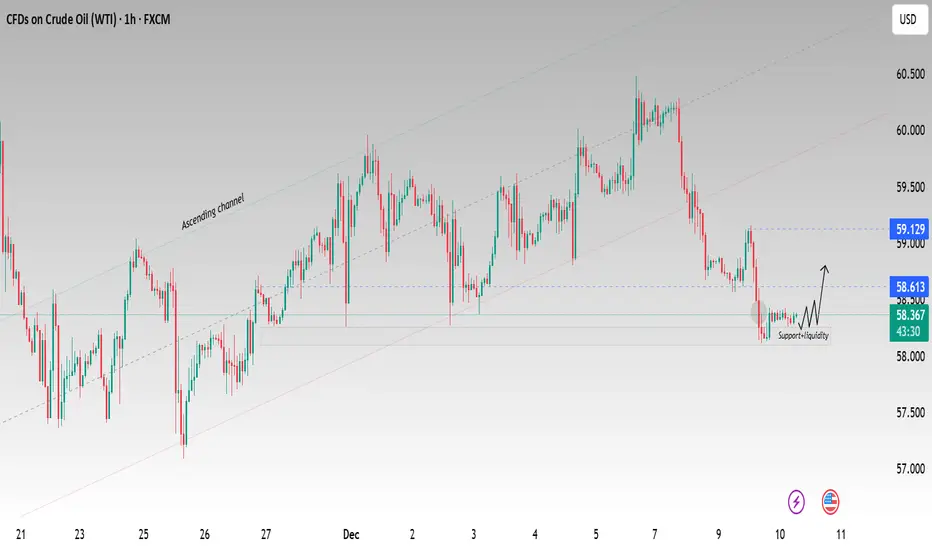
USOIL Bullish strong from key support area 🛢️USOIL Update – Bullish Setup from Key Support Zone 💹
USOIL is showing strong bullish momentum after reacting from the 58,200 support & liquidity zone.
If the momentum continues, here are the technical targets on the 1H timeframe:
🎯 1st Target: 58,600
🎯 2nd Target: 59,200
Always remember:
⚠️ Use
See all ideas
Displays a symbol's price movements over previous years to identify recurring trends.