USOIL ANALYSIS SETUP READ THE CAPTIONUSOIL is consolidating above a strong support zone while forming higher lows, indicating bullish pressure building. Price is currently testing the trendline resistance, and a clean breakout could open the way toward the upper target zone. As long as price stays above support, the bullish scenario re

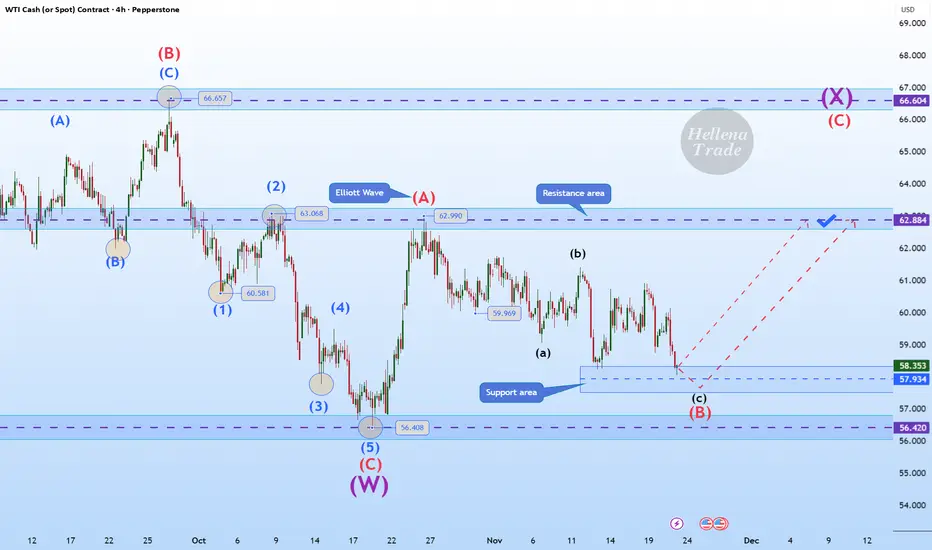
Hellena | Oil (4H): LONG to the area of the maximum of wave “A”.Colleagues, the past forecast has not been canceled, but I see some changes and therefore feel it is necessary to make a fresh forecast.
Apparently, the corrective wave “B” has extended to the area of 57.930. This is quite close to the low of wave “C” at 56.408 and the price should not update it, o
USOIL-Watching for Reversal From Support Zone Toward Key TargetsUSOIL has dropped into a strong support zone near 57.15–57.40, where price is showing early signs of a potential bounce. If this support holds, oil may push upward toward the marked target levels.
Support Zone: 57.15 – 57.40
Target Levels:
Target 1: 58.50
Target 2: 59.21
Target 3: 60.05
Price

Potential bullish reversal?WTI Oil (XTI/USD) is falling towards the pivot and could bounce to the 61.8% Fibonacci resistance.
Pivot: 59.38
1st Support: 59.01
1st Resistance: 60.16
Disclaimer:
The opinions given above constitute general market commentary and do not constitute the opinion or advice of IC Markets or any form

BULLISH SCENARIO - USOILHello traders,
USOIL is currently moving inside a descending channel.
A bullish breakout is in focus:
If the price breaks the channel resistance and confirms the close above,
a strong upward movement is expected 🚀
🎯 TARGET: 65.150

Market Analysis: WTI Crude Oil Extends RecoveryMarket Analysis: WTI Crude Oil Extends Recovery
Crude oil price is rising and it could climb further higher toward $62.00.
Important Takeaways for WTI Crude Oil Price Analysis Today
- WTI Crude oil prices are moving higher above the $60.00 resistance zone.
- There is a key bullish trend line

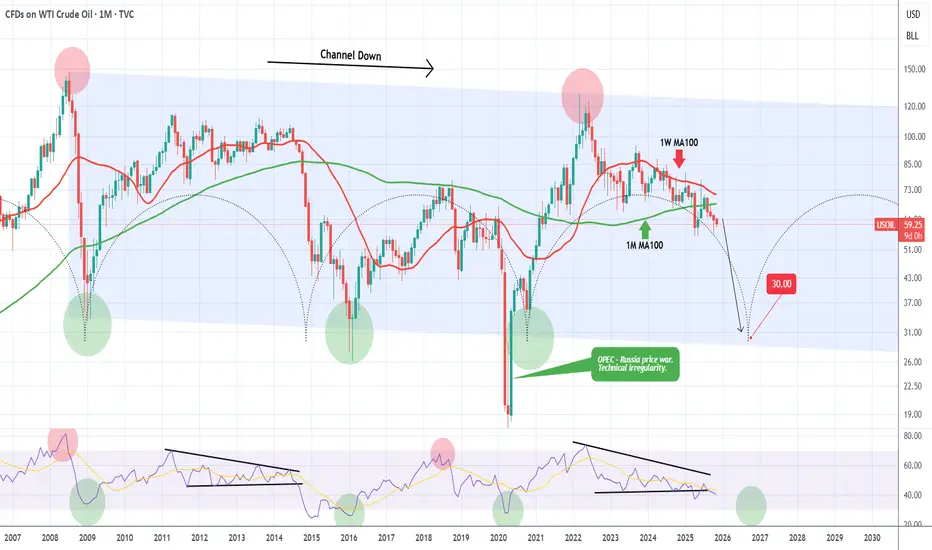
WTI OIL Is it possible to crash at $30.00?WTI Oil (USOIL) has been declining for 3 straight months (current red 1M candle is the 4th one) since the June 2025 rejection on the 1W MA100 (red trend-line). That has been the last rejection of a series of Lower Highs rejections on the 1W MA100 in the past 2 years.
On the much longer-term scale,
WTI/USD: Bullish Rally to 62.45?CFI:WTI is gearing up for a bullish rally on the 4-hour chart , with price rebounding from a key support zone near cumulative long liquidation levels, setting up a strong entry opportunity if buyers maintain control and push toward resistance amid recent consolidation. Entry from current levels

OIl in to start wave e of traingle B (Long - Short/Medium Term)- The clearest count right now is that we are in the start of wave E around 65- 70 of traiangle B.
- To follow a deeper correcton for wave C to around $30 a Barrel

OIL Rejected Again at Resistance OIL Rejected Again at Resistance: Bears Preparing for Another Push Down
Oil continues to struggle below the 60.50–60.60 resistance zone, where price has been rejected multiple times, confirming selling pressure.
Each test of this zone has led to a swift bearish move — and this time might be no di

See all ideas
Displays a symbol's price movements over previous years to identify recurring trends.