WTI Crude Oil (USOIL) – 30-Minute Analysis1. Bullish Rejection at Support
Price is holding above the 58.40–58.50 demand zone, showing strong rejection and signs of buyer interest.
2. Long Setup Active
Entry: 58.50–58.70
Stop Loss: Below 58.25
Target: 59.90–60.00
This provides a solid risk-to-reward structure.
3. Structure Outlook
Market is attempting to form a higher low. A break above 59.20 may confirm bullish continuation.
4. Key Levels
Support: 58.30 / 58.50
Resistance: 59.20 / 59.60 / 60.00
Short-term bias: Bullish as long as the support zone holds.
Trade ideas

US OILHI GUYS
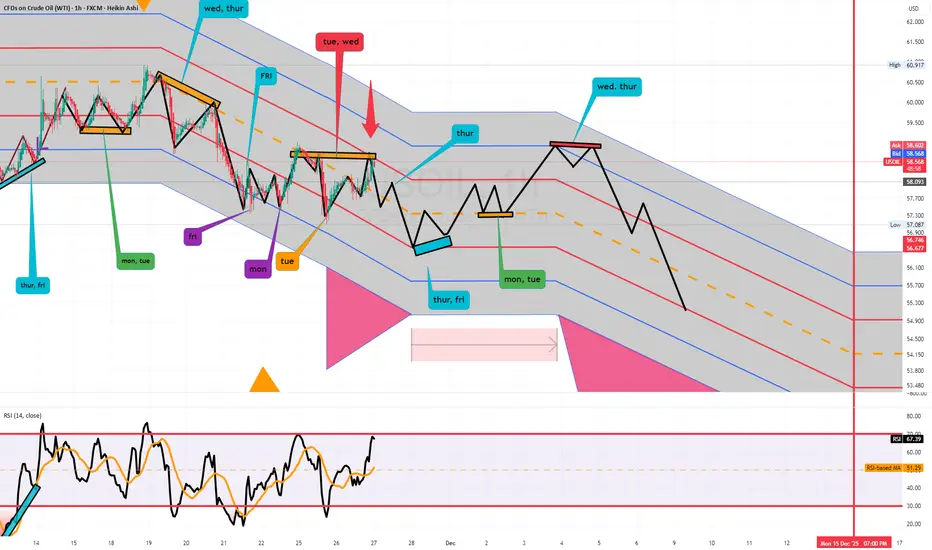
UPDATE ON US OIL H4 HISTORICAL PATH and trading price patterns in detail
i expect sells on a wed, thur price pattern .
lets see what happens


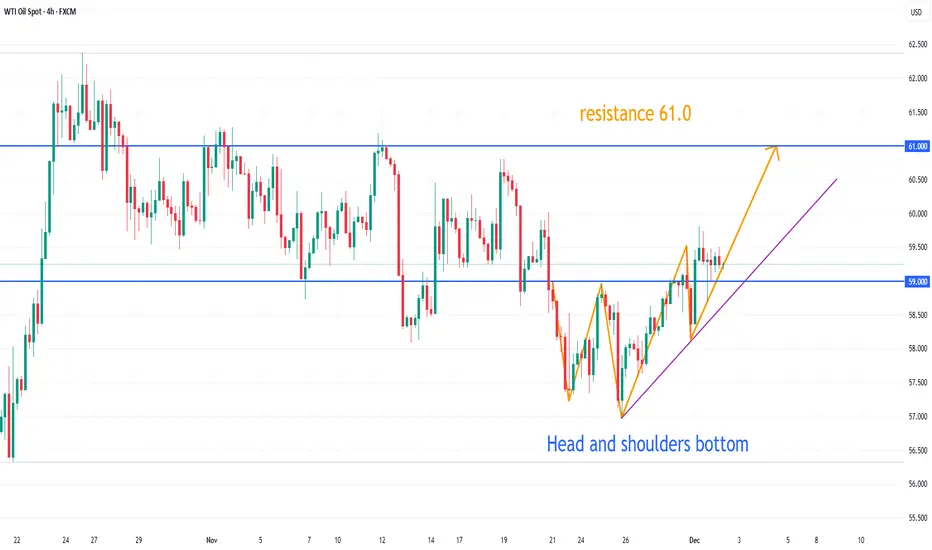
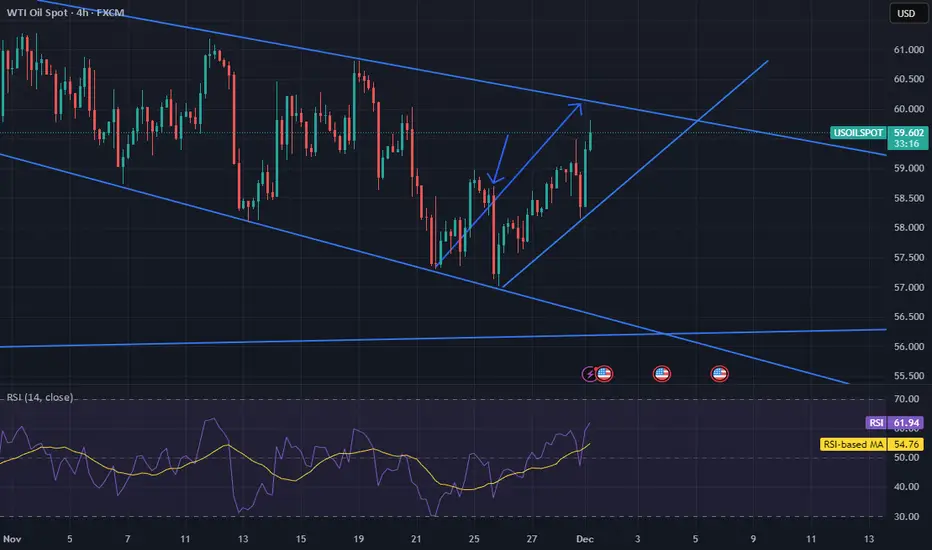
USOIL TP 61.0On the 4-hour chart, USOIL stabilized and then moved upwards, forming a head and shoulders bottom pattern in the short term. Currently, watch for support around 59.0; a pullback and stabilization after this level could present a buying opportunity. Resistance is seen around 61.0.
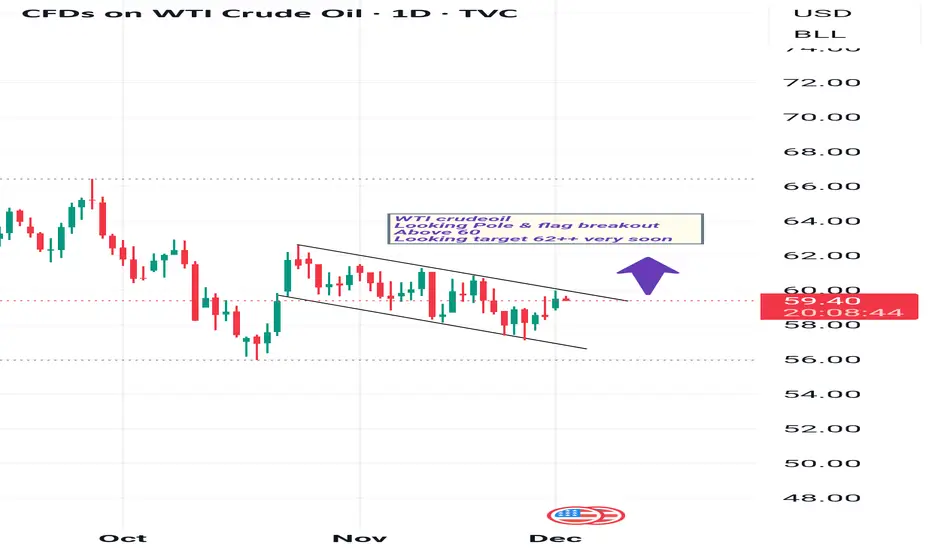
My View On USOIL (wti crudeoil)WTI crudeoil
Looking Pole & flag breakout Above 60
Looking target 62++ very soon
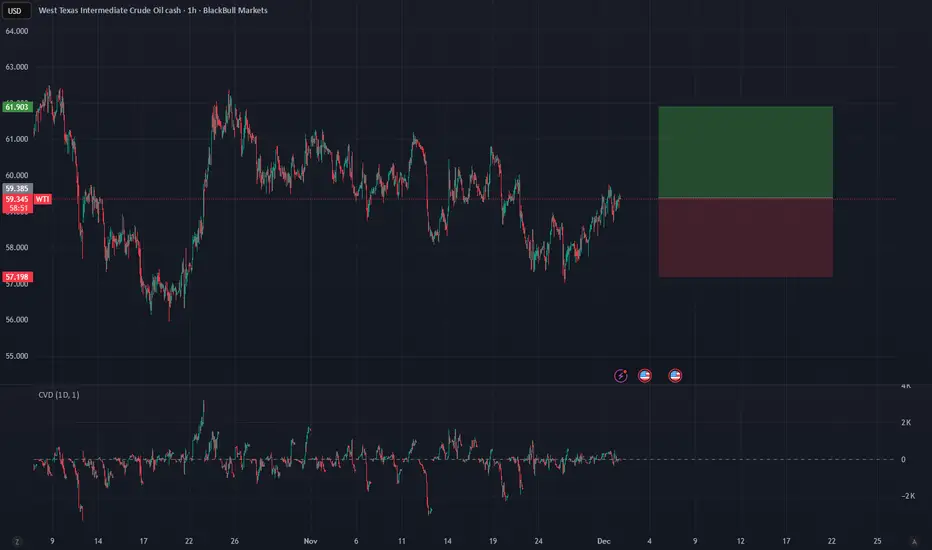
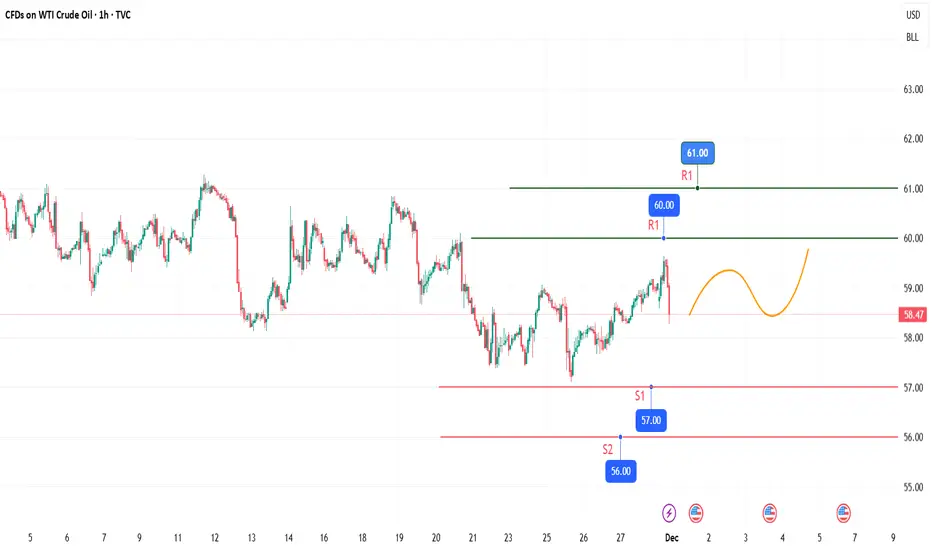
Absorption Pattern & Potential Reversal to $61After a significant downtrend from the $66.00 highs down to the $56.00 region, WTI Crude Oil is showing signs of a structural shift on the 1H timeframe. Here is the technical breakdown suggesting a bullish recovery.
1. Market Structure & Price Action The market has stopped making lower lows. Instead, we have established a Higher Low (HL) at roughly $57.50, compared to the capitulation low at ~$56.00. This is the first sign of a potential trend change. The price is currently reacting aggressively from this support zone, pushing back towards the $59.40 level.
The immediate obstacle is the psychological $60.00 level and the local supply zone around $59.50. A breakout above this area would confirm the reversal.
2. Order Flow & CVD A crucial observation on the lower timeframe data is the divergence between Price and CVD.
The CVD remains negative (Red values on the bottom left), indicating that aggressive market selling is still present.
Interpretation: Despite this selling pressure, price is not making new lows. Instead, it is holding structure and rising.
Conclusion: This indicates Absorption. Large passive buyers (Limit Bids) are absorbing the sell-side liquidity. The sellers are expending effort but getting no result (price drop). Once the sellers are exhausted, the path of least resistance is up.
3. Trade Setup (Long Position)
Based on the absorption at support and the formation of a Higher Low, I am looking for a rotation back to the upper range.
Direction: LONG
Entry Zone: Current Market Price ($59.35) or on a retest of $59.00.
Invalidation / Stop Loss: $57.20.
Reasoning: This is placed below the recent Higher Low structure. If price breaks this level, the absorption thesis has failed, and the downtrend will likely continue to $55.
Target: $61.90.
Reasoning: Major swing high / supply zone.
USOIL – Technical & Fundamental OutlookTechnical:
USOIL continues to struggle below the $60.00 level, showing mixed intraday structure but rejecting the $59.80–60.00 zone multiple times. Buyers remain active near $58.00, forming a short-term higher-low sequence, but no clear breakout yet.
Fundamental:
Oil is being pressured by uncertainty over global demand, while OPEC+ decisions and U.S. inventory data keep volatility alive. Any surprise in production cuts or stockpile reports could push price sharply.
Key:
Decision point remains $60.00.
Break above = bullish continuation.
Failure = return toward $58.00.


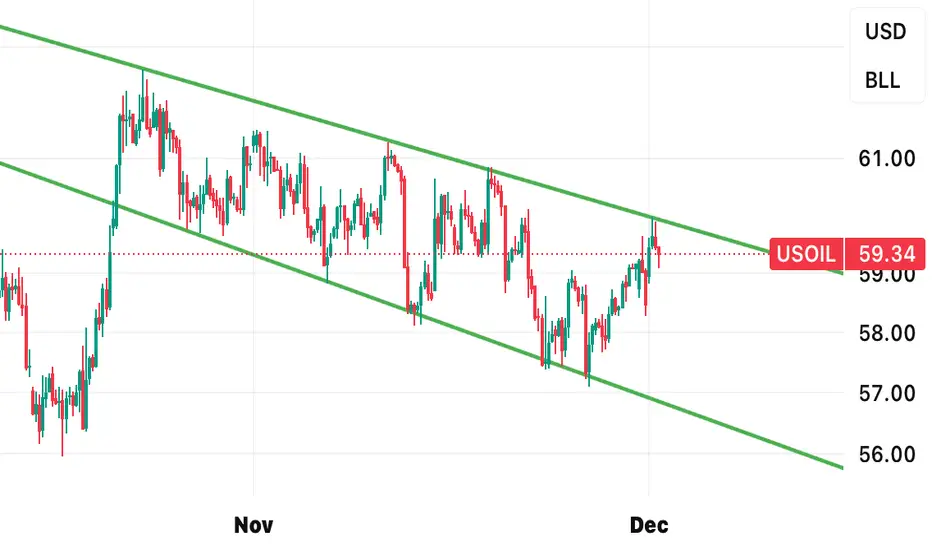
USOIL – Consolidation With No Clear Direction YetUSOIL remains trapped in a wide consolidation range, with price oscillating between 58.00 and 61.00 for several sessions. Buyers have stepped in near the lower boundary, but momentum continues to fade each time price approaches the upper zone.
Currently, the market sits near the mid-range, offering little directional bias until a clean breakout occurs. A move above 61.00 could shift sentiment bullish, while a breakdown below 58.00 may reopen the path toward recent lows.
For now, USOIL is neutral and ranging patience is key until the market picks a direction.
USOIL CONTINUES DECLINED IS EXPECTED THROUGH THIS MONTH The crude oil market has been in a downward trend throughout November , we might see this continue decline repeat itself this same month. But let’s see the direction where this consolidation will break out towards. Am still favoring the downside. Our overall target still remains $50-$40
USOIL: 01/12/2025 daily analysisOil climbed about 1.5% at the early market open, driven by OPEC+ confirming it will halt production increases in the first quarter and by fresh geopolitical risks. The group stressed it’s ready to pause or reverse voluntary output moves as needed, mainly due to concerns about a potential supply oversupply risk.
Tension rose after the U.S. floated the idea of restricting Venezuelan airspace, adding uncertainty to supply from a major producer, and this risk was helping support prices.
In Europe, sentiment flipped again as the Russia-Ukraine situation worsened. Ukrainian forces targeted a Russian refinery, an aviation plant, and two sanctioned tankers headed to a Black Sea port. Hopes for a peace deal faded, reducing expectations that large volumes of sanctioned Russian oil might hit the market soon. Ukrainian and U.S. officials met in Florida, with Washington describing the talks as productive but emphasizing that the war is far from over.
On the technical side, the crude oil price extended its bullish correction after rebounding from the lower band of the Bollinger Bands last week. Currently, the price is trading around a very strong technical resistance level, which consists of the 50-day simple moving average, the 38.2% Fibonacci retracement of the weekly range, and the psychological resistance of the round number, $60. The Bollinger Bands are still quite expanded, indicating volatility in the crude oil market, while the Stochastic oscillator is approaching overbought levels, but has not yet reached them In the upcoming sessions there might be a continuation of the recent bullish momentum and if that theory holds then the first potential area of resistance might be seen around $61 and a second area around $62. The first area consists of 50% of the weekly Fibonacci retracement level, the upper band of the Bollinger Bands, and the 100-day simple moving average area. Meanwhile, $62 represents the medium-term resistance area of price reaction since mid-August.
Disclaimer: The opinions in this article are personal to the writer and do not reflect those of Exness

Risky wait now - staying channel and going down or breaking chanMy original idea worked out well.. and i am surprised myself as a young trader.
Currently as it stands the 60 seems to be pivotal. So there's a few points to take in.
Friday's Dump was so strong, it is a reminder how things can turn quickly even though my initial thought was up, it can go sideways badly very fast.
Questions to think about
1) Is it going to break 60
2) is the break going to be a false break and down.
3) is it just going to stay in channel and drop to even lower (56.5)???
As of now, I am not sure. If i am going to take any trades it will be will RSI and 20-30cent profits.
Currently i have no idea where this will go.
Multi-Dimensional Core Analysis(1) Supply-Demand Dynamics: Surplus Dominates as the Primary Pressure, Weak Policy Support
The supply side shows a clear loose trend. Although OPEC+ plans to pause production growth in Q1 2026, it will still increase output by 137,000 barrels per day (bpd) in December. Combined with the cumulative production hike of nearly 2.5 million bpd since earlier, the market has digested the policy-driven positive sentiment, and surplus expectations now dominate the market. For non-OPEC+ producers, U.S. crude oil output has reached a record high of 13.834 million bpd, and the IEA has revised up its 2025 U.S. production forecast to 13.59 million bpd, further exacerbating supply pressure. Demand recovery remains sluggish: U.S. EIA gasoline inventories surged by 2.327 million barrels in November, confirming weak end-consumption. The IEA predicts global supply surplus will reach 4.09 million bpd in 2026, and the persistent supply-demand mismatch continues to suppress oil prices.
(2) Geopolitics: Risk Premium Fades, De-escalation Expectations Weigh
Positive progress has been made in Russia-Ukraine peace talks, and the U.S.-promoted ceasefire plan has reduced concerns about supply disruptions. The previous geopolitical risk premium of $5–$10 per barrel has gradually faded. The Middle East situation remains relatively stable, with no disruptions to shipping through the Strait of Hormuz. Geopolitical factors have shifted from a support to a suppressant, with only the potential for sudden conflicts as a possible source of volatility.
(3) U.S. Dollar Trend: Strong Volatility Suppresses Prices, Cooling Easing Expectations
The U.S. Dollar Index has broken above the key 100 mark, and the probability of a Fed rate cut in December has dropped from 48.9% to 32.7%. Uncertainty surrounding monetary policy has strengthened the dollar’s strength. The correlation between crude oil and the U.S. dollar stands at -0.7, as higher procurement costs for non-U.S. dollar countries restrain demand, becoming a key resistance to oil price rebounds.
(4) Technical Outlook: Short-Term Weak Oscillation, Support Levels Under Test
WTI crude oil has fallen below the 50-day moving average, with the 100-period SMA ($59.22) on the 4-hour chart forming dynamic resistance. The RSI indicator hovers around 40, not entering the oversold zone. The key support level is $57.5; a valid break below this level will trigger a decline to $57.04. Resistance is concentrated around $59.5 above, with limited rebound momentum, resulting in an overall weak oscillatory pattern.
Next week's crude oil trading strategy
sell:59-58.5
tp:58-57.5
sl:59.8

USOIL H1 | Bearish Reversal Off key ResistanceMomentum: Bearish
The price is rising towards the sell entry, which aligns with the 61.8% Fibonacci projection.
Sell entry: 59.31
Pullback resistance
61.8% Fibonacci projection
Stop loss: 60.03
Pullback resistance
145% Fibonacci extension
Take profit: 58.16
Pullback support
High Risk Investment Warning
Stratos Markets Limited (tradu.com ), Stratos Europe Ltd (tradu.com ):
CFDs are complex instruments and come with a high risk of losing money rapidly due to leverage. 70% of retail investor accounts lose money when trading CFDs with this provider. You should consider whether you understand how CFDs work and whether you can afford to take the high risk of losing your money.
Stratos Global LLC (tradu.com ): Losses can exceed deposits.
Please be advised that the information presented on TradingView is provided to Tradu (‘Company’, ‘we’) by a third-party provider (‘TFA Global Pte Ltd’). Please be reminded that you are solely responsible for the trading decisions on your account. Any information and/or content is intended entirely for research, educational and informational purposes only and does not constitute investment or consultation advice or investment strategy. The information is not tailored to the investment needs of any specific person and therefore does not involve a consideration of any of the investment objectives, financial situation or needs of any viewer that may receive it. Past performance is not a reliable indicator of future results. Actual results may differ materially from those anticipated in forward-looking or past performance statements. We assume no liability as to the accuracy or completeness of any of the information and/or content provided herein and the Company cannot be held responsible for any omission, mistake nor for any loss or damage including without limitation to any loss of profit which may arise from reliance on any information supplied by TFA Global Pte Ltd.

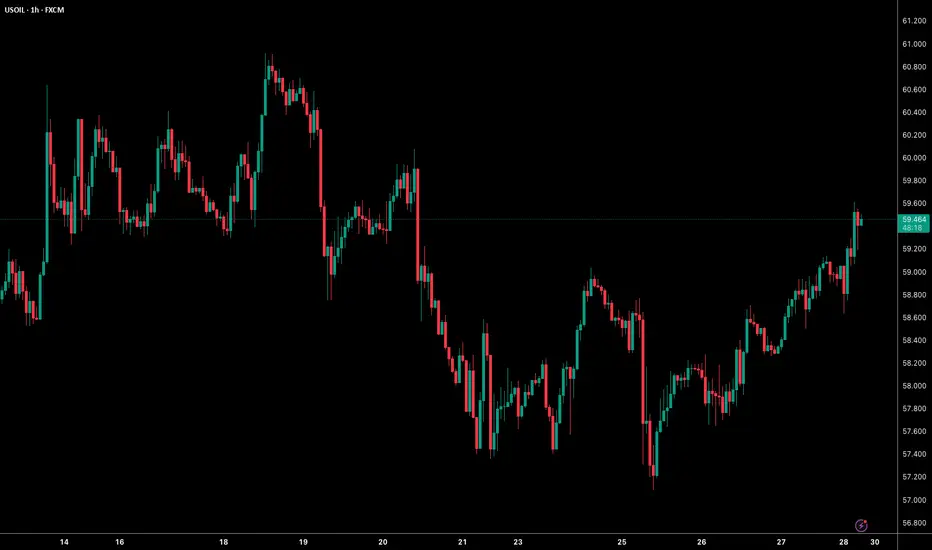
Weekly USOIL Trend SummaryOverall, USOIL oscillated at a low level with a slight upward trend during the period from November 24 to November 28, 2025. Despite minor fluctuations of gains and losses throughout the week, it hovered around $59 per barrel and failed to break free from the consecutive monthly decline trend that began this month. The specific trend is detailed in segments as follows:
1.Modest Gain at Week's Start with Synchronous Weakening Price Spread (November 24)
USOIL kicked off the week with a slight upturn. It closed at $58.89 per barrel that day, rising $0.91 or 1.57% compared with the previous week's closing price of $57.98 per barrel.
2.Oscillating Consolidation in Mid-Week, with Gains Constrained by Oversupply Expectations (November 25 - 26)
On November 25, oil prices traded sideways, hovering around $58.77 per barrel with a slight drop of approximately 0.91%.
On November 26, the market rebounded, and the growth rate of the relevant oil and gas index expanded to 0.87%. Oil prices followed suit with an upward movement. However, they failed to break through the earlier oscillating range overall. Meanwhile, potential incremental pressure on the supply side left the oil price rally lacking strong momentum.
3.Minor Fluctuations at Week's End Awaiting Policy Signals (November 27 - 28)
On November 27, oil prices pulled back slightly, and the corresponding oil and gas index edged down by 0.08%. After encountering resistance near $59 per barrel, oil prices retreated moderately. Market sentiment turned increasingly cautious as investors focused on the OPEC+ production policy meeting scheduled for Sunday.
On November 28, oil prices inched up again, and the oil and gas index rose by 0.67%, hitting a weekly closing high of 309.33 points.
Overall, although USOIL recorded a slight increase this week, it remained trapped in a low - range. Moreover, this month marks its fourth consecutive monthly decline, the longest losing streak since 2023. The main bearish factors weighing on oil prices include the expected lifting of sanctions on Russian oil driven by progress in the Ukraine peace talks and weak demand caused by the unexpected growth in U.S. crude oil inventories. Conversely, expectations of interest rate cuts by the Federal Reserve have provided some support for oil prices. Going forward, the production decisions of OPEC+ and changes in the geopolitical landscape will be the key factors determining the future trend of oil prices.
VNShark OB | The Perfect Liquidity Tap1️⃣ Market Structure — The Foundation of the Move
USOIL was clearly in a bearish market structure, confirmed by a strong displacement candle breaking the previous bullish Order Block.
A high-volume breakout revealed institutional involvement, creating a fresh VNShark Order Block with a wide IMB underneath.
Institutional footprints like these never appear by accident — they signal that Big Money is positioning.
2️⃣ The Perfect Liquidity Tap
Price retraced slowly into the OB with weak bullish momentum — no aggression, no conviction.
To most traders, it looked boring, uncertain, and “not ready.”
But this is precisely the type of retracement institutions prefer.
Then came the moment:
a clean tap into the OB — grabbing every last piece of liquidity — before the sharks unleashed the real move.
No hesitation.
No second chance.
Just pure institutional rejection straight from the OB.
3️⃣ Why Most Traders Miss Moves Like This
The truth?
Most traders simply didn’t wait long enough.
The retracement took too long
The timing was inconvenient (near the end of the U.S. session)
It was Friday — nobody wants to hold pending orders
Many canceled their sell limits for safety
Retail psychology was exhausted right before the tap
And Big Money knows this.
They never strike when retail is ready —
they strike when retail cannot follow.
4️⃣ The Psychological Lesson
The best setups rarely feel good.
They often look:
too slow
too late
too risky
too inconvenient
too uncomfortable to hold
But that’s exactly why they work.
The market doesn’t avoid your limit — it waits for you to cancel it.
Understanding this dynamic is a core part of the VNShark-OB methodology.
5️⃣ Key Takeaways
Institutional timing often hits during the weakest liquidity hours
A slow pullback is intentional, not weakness
OB reactions are strongest when traders give up
Patience is as important as structure
The cleanest moves often happen right after you walk away
This case perfectly illustrates how Big Money execution interacts with retail psychology.
📌 Tags:
#OrderBlock #SmartMoney #Liquidity #BigMoney #InstitutionalTrading
#MarketStructure #PriceAction #VolumeAnalysis #USOIL #WTI
#CrudeOil #TechnicalAnalysis #SMC #VNSharkOB #Education #TradingPsychology

USOIL – Quick Technical OutlookUSOIL has recovered from last week’s sell-off and is now attempting to hold above the $59.20–$59.40 zone. Price has reclaimed the short-term EMA, showing renewed bullish momentum after a period of consolidation.
To continue higher, buyers need a firm break above $59.60. Failure to hold the EMA could pull price back toward $58.80–$58.50 for a retest of demand.
WTI🌎 Major investment banks forecast two stages for oil: a decline due to oversupply, followed by growth from 2027 due to a lack of investment.
After 2027: A prolonged growth period will begin due to a shortage of raw materials.
A gradual, slow decline in oil prices is observed.
We are near a support level, a break of which could accelerate the decline in prices.

How I Sniped 207 Pips on XAGUSD—Using ONE Simple SetupI just closed out a 207-pip XAGUSD (Silver) trade, and in this video I walk you step-by-step through exactly how it happened — from the higher-timeframe bias to the precise entry inside a clean supply & demand zone.
If you trade Silver, Gold, or any high-volatility pair, this breakdown will help you understand:
Why XAGUSD was primed for a major move
The exact structure shift that confirmed my bias
How I timed my entry with precision and avoided false breakouts
My risk management approach for fast-moving metals
What most traders overlook in Silver price action
How to stay disciplined when the market is moving aggressively
This wasn’t luck — it was preparation, patience, and psychology.
Whether you’re a funded trader, working toward funding, or just trying to level up your price-action skills, this XAGUSD trade recap will give you real insights you can apply immediately.
If you want help refining your strategy or becoming more consistent, drop your email or tap the link in my bio — I’ll send you coaching details.

VNShark OB | Why Some Perfect Order Blocks Still FailOrder Blocks are powerful tools — but they are not sacred zones where we can place absolute confidence.
Even a perfect-looking OB can fail if traders ignore context and its position within the market structure.
A strong displacement, a clean IMB, a clear structure break — these make an OB look perfect on the surface.
But the deeper question is:
👉 Where did this OB form in the overall market cycle?
1️⃣ End-Cycle OBs Look Strong but Carry No Real Strength
Toward the end of a strong trend:
The market runs out of opposing liquidity
Retail traders FOMO into the direction
Counterflow dries up
Buy-side or sell-side participation becomes extremely weak
Without matching orders, Big Money simply cannot push the trend further, even if they generate a strong displacement candle.
This creates the classic “Empty OB”:
Beautiful structure
Strong Phase 1 push
But no institutional follow-through
No Phase 2 continuation
Easy to break with minimal volume
In other words:
👉 Perfect OB, zero internal strength.
2️⃣ Why Big Money Creates a Perfect OB but Doesn’t Continue the Move
A common misunderstanding is believing that a beautiful OB = strong OB.
In reality, at the end of a cycle, institutions often:
Push price with a strong Phase 1 move
Sweep liquidity
Trigger retail entries
Complete their short-term objective
…but when price approaches major HTF support or resistance, they:
👉 Cancel their pending orders
👉 Avoid Phase 2 continuation
👉 Stop committing further capital
The OB remains on the chart — but only as liquidity history, not as active institutional interest.
This is why many “textbook” OBs fail instantly.
3️⃣ Empty OBs Break Easily Near HTF Zones
When price reaches strong H4 or D1 support/resistance:
Retail Buy/Sell activity increases
Institutions stay neutral
Price rises or falls slowly with low volume
And eventually breaks the OB effortlessly
This creates the classic behavior:
👉 Low volume, big impact — Empty OB collapse.
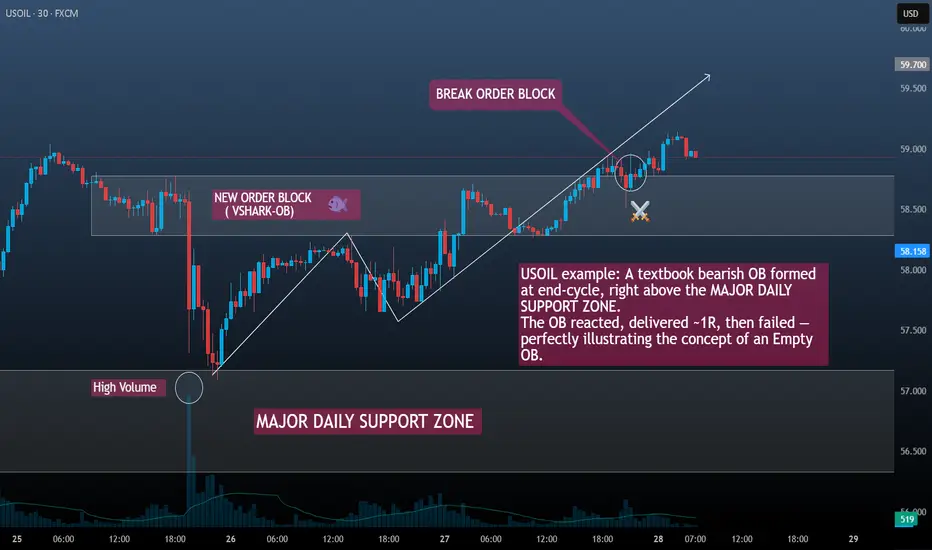
This is exactly what happened to USOIL:
Beautiful bearish OB
Strong displacement
Clean IMB
Nice reaction and even delivered ~1R
But HTF support absorbed the move
Institutions did not push Phase 2
OB failed with small pullback volume
Logical. Clean. And completely in line with end-cycle mechanics.
4️⃣ A Failed OB at End-Cycle Is Not a Bad Sign — It’s a Signal
Most retail traders panic when a perfect OB fails.
Professionals don’t.
Because an OB failing at end-cycle often indicates:
The prior trend is exhausted
Liquidity has been redistributed
HTF structure is taking control
A new cycle is forming
Better opportunities will appear right after the OB breaks
Sometimes, waiting for the OB to fail gives a much clearer, safer, and stronger setup than trading the OB itself.
Conclusion
Order Blocks are powerful —
but they only work when they’re backed by true institutional flow and placed correctly within the market cycle.
When an OB forms:
At the end of a trend
Near HTF support/resistance
When liquidity is dried up
When Phase 2 is absent
…it becomes an Empty OB: beautiful on the surface, but extremely fragile.
The failure of such an OB is not noise.
It is information — a message from Big Money that a new phase is coming.
First Comment (for posting)
Even perfect OBs can fail — especially at end-cycle.
Yesterday’s USOIL setup illustrated this perfectly.
Share your thoughts: Do you track “Empty OBs” in your analysis?
Signature
— VNShark
Institutional OB • Liquidity • Volume • Market Structure
Tag:
#OrderBlock, #SmartMoneyConcept, #SmartMoney, #Liquidity, #VolumeAnalysis, #Imbalance, #MarketStructure, #OBTrading, #InstitutionalTrading, #PriceAction, #BigMoney, #VNSharkOB, #USOIL, #CrudeOil, #WTI, #TradingEducation, #ForexTrading, #CommodityTrading, #TrendAnalysis
USOIL : LIVE TRADE
Hello friends
Well, considering the downtrend and the power of the sellers, we should also follow the trend and go to the side of the one who has the power.
Given the price drop, if the price pullbacks, we can see the price drop again.
This post is not a buy or sell offer and is only reviewed from a technical perspective.
Observe risk and capital management and avoid emotional movements.
*Trade safely with us*
US OILHI GUYS
CORRECTION AND UPDATE ON US OIL
we are around sell area.
Today i expect sells on ( tue, wed) double top price pattern as shown above
Earlier today i adjusted from h4, h6,h8 to Daily path.
The ( RT Daily type 1 ) Illustration will be in comment section.
USOIL FREE SIGNAL|SHORT|
✅WTI OIL is returning into the higher-timeframe supply after clearing buy-side liquidity, signaling distribution. If rejection confirms, bearish displacement could drive price toward the sell-side liquidity target below.
—————————
Entry: 58.70$
Stop Loss: 59.00$
Take Profit: 58.12$
Time Frame: 3H
—————————
SHORT🔥
✅Like and subscribe to never miss a new idea!✅
