Breakout or fakeoutSo far, oil has managed to break the channel’s ceiling, and now we need to see whether it will fake out and return inside the range or continue moving higher. The fact that it bounced strongly from the channel’s bottom could be a signal that the ceiling breakout might hold. ✅
Trade ideas

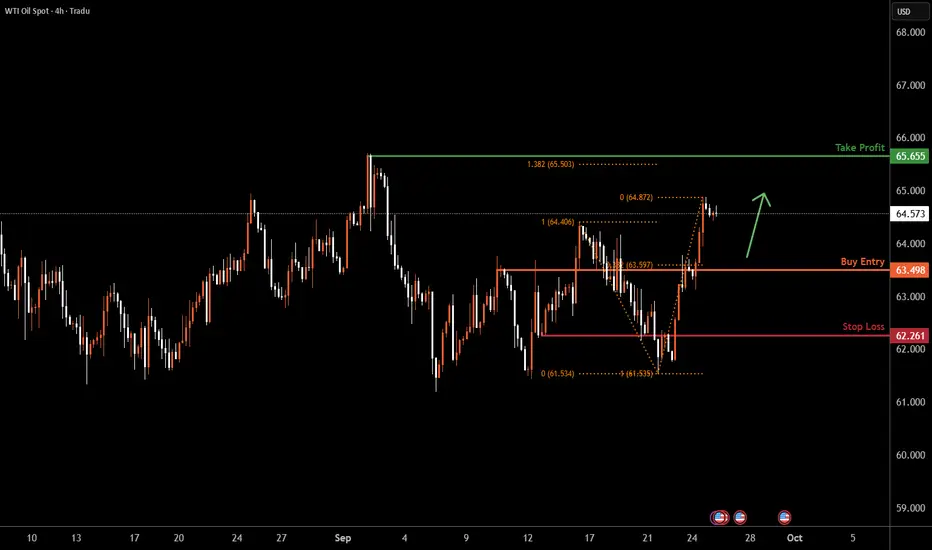
USOIL H4 | Falling towards 50% Fibonacci supportBased on the H4 chart analysis, we could see the price fall to the buy entry which is a pullback support that lines up with the 38.2% Fibonacci retracement and could bounce from this level to the take profit.
Buy entry is at 63.49, which is a pullback support that lines up with the 38.2% Fibonacci retracement.
Stop loss is at 62.26, which is a pullback support.
Take profit is at 65.65, which is a swing high resistance that is slightly above the 138.2% Fibonacci extension.
High Risk Investment Warning
Trading Forex/CFDs on margin carries a high level of risk and may not be suitable for all investors. Leverage can work against you.
Stratos Markets Limited (tradu.com ):
CFDs are complex instruments and come with a high risk of losing money rapidly due to leverage. 65% of retail investor accounts lose money when trading CFDs with this provider. You should consider whether you understand how CFDs work and whether you can afford to take the high risk of losing your money.
Stratos Europe Ltd (tradu.com ):
CFDs are complex instruments and come with a high risk of losing money rapidly due to leverage. 66% of retail investor accounts lose money when trading CFDs with this provider. You should consider whether you understand how CFDs work and whether you can afford to take the high risk of losing your money.
Stratos Global LLC (tradu.com ):
Losses can exceed deposits.
Please be advised that the information presented on TradingView is provided to Tradu (‘Company’, ‘we’) by a third-party provider (‘TFA Global Pte Ltd’). Please be reminded that you are solely responsible for the trading decisions on your account. There is a very high degree of risk involved in trading. Any information and/or content is intended entirely for research, educational and informational purposes only and does not constitute investment or consultation advice or investment strategy. The information is not tailored to the investment needs of any specific person and therefore does not involve a consideration of any of the investment objectives, financial situation or needs of any viewer that may receive it. Kindly also note that past performance is not a reliable indicator of future results. Actual results may differ materially from those anticipated in forward-looking or past performance statements. We assume no liability as to the accuracy or completeness of any of the information and/or content provided herein and the Company cannot be held responsible for any omission, mistake nor for any loss or damage including without limitation to any loss of profit which may arise from reliance on any information supplied by TFA Global Pte Ltd.
The speaker(s) is neither an employee, agent nor representative of Tradu and is therefore acting independently. The opinions given are their own, constitute general market commentary, and do not constitute the opinion or advice of Tradu or any form of personal or investment advice. Tradu neither endorses nor guarantees offerings of third-party speakers, nor is Tradu responsible for the content, veracity or opinions of third-party speakers, presenters or participants.
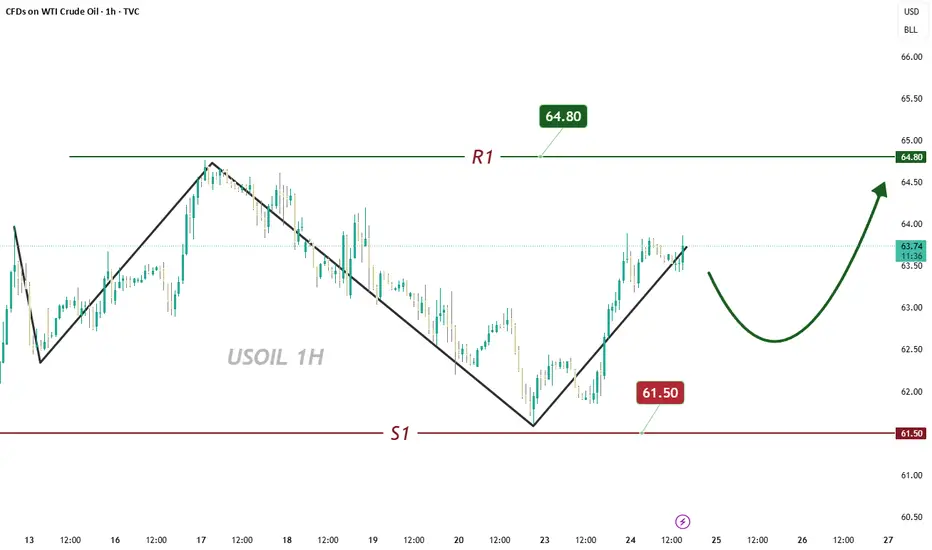
Bullish bounce off pullback support?WTI Oil (XTI/USD) is falling towards the pivot which aligns with the 38.2% Fibonacci retracement and could bounce to the 1st resistance.
Pivot: 63.94
1st Support: 62.09
1st Resistance: 65.90
Disclaimer:
The above opinions given constitute general market commentary, and do not constitute the opinion or advice of IC Markets or any form of personal or investment advice.
Any opinions, news, research, analyses, prices, other information, or links to third-party sites contained on this website are provided on an "as-is" basis, are intended only to be informative, is not an advice nor a recommendation, nor research, or a record of our trading prices, or an offer of, or solicitation for a transaction in any financial instrument and thus should not be treated as such. The information provided does not involve any specific investment objectives, financial situation and needs of any specific person who may receive it. Please be aware, that past performance is not a reliable indicator of future performance and/or results. Past Performance or Forward-looking scenarios based upon the reasonable beliefs of the third-party provider are not a guarantee of future performance. Actual results may differ materially from those anticipated in forward-looking or past performance statements. IC Markets makes no representation or warranty and assumes no liability as to the accuracy or completeness of the information provided, nor any loss arising from any investment based on a recommendation, forecast or any information supplied by any third-party.


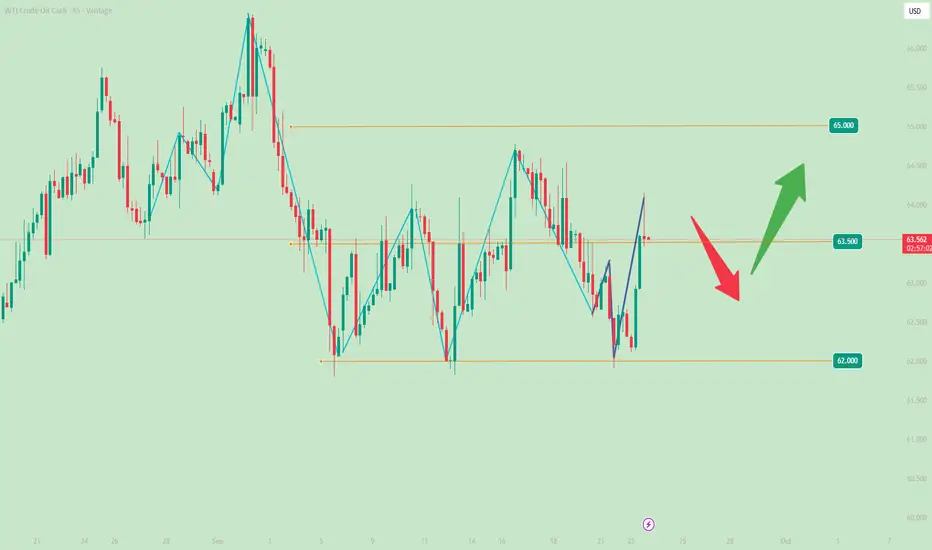
Clear Rebound Post-Pullback, Watch for 2nd Drop After a significant pullback, oil has now seen a clear rebound 📈
However, we need to watch out for a potential second pullback ⚠️ and can opt to go long at lower levels 🐂
Buy 62.2 - 62.6
TP 63.2 - 63.6 - 64.6
Accurate signals are updated daily 📈! If you encounter any issues during trading, these signals can serve as your reliable guide 🧭—feel free to refer to them anytime! I sincerely hope they’ll be of great help to you 🌟
WTI Crude | Oversupply Pressures Below Key AveragesWTI crude remains under pressure as the September sell-off extends. Rising supply from OPEC+ easing cuts and Russian export adjustments continue to outweigh seasonal demand, while U.S. macro indicators point to a softer consumption backdrop. The Fed’s September rate cut offered little support, with demand signals still muted and inventories building.
Technically, WTI trades below both the 20- and 50-day moving averages, reinforcing a bearish tone. Price action remains capped within a consolidation channel, with sellers defending the upper boundary. A sustained failure to reclaim the moving averages leaves scope for further downside toward the anchored VWAP from April lows and the broader $60–62 zone.
For now, crude sits at an inflection point: oversupply fears and soft demand keep pressure on the downside, while only a breakout above recent consolidation highs would begin to shift momentum.

WTI ShortThe alliance, including Russia and Saudi Arabia, agreed to a phased increase in production, which led to an increase in supply on the market.
OPEC+ production increase parameters
April 2025: Increase in production by 137,000 barrels per day
May-July 2025: Monthly increase of 411,000 barrels per day
August 2025: Increase by 548,000 barrels per day
September 2025: Increase by 547,000 barrels per day
October 2025: Planned increase by 137,000 barrels per day
OPEC+ plans to fully restore production cuts in 2023. Initially, a gradual increase in production was planned until September 2026, but due to favorable market conditions, the process was accelerated
US trade policy, which introduced customs duties on goods from many countries, also affects the price of oil
We expect a decline in the American grade of oil to $ 60

Crude oil:short-term longCrude oil continued to rally during the US session, with a series of bullish candles on the chart. Note that short positions are not viable—focus on taking profits to break even on pullbacks. The wide ranging oscillation on the daily chart remains unchanged. The watershed for the small cycle is at 63.5, and the trend watershed is at 65.
Buy 62.5 - 62.8
TP 64 - 64.5
SL 62
Daily-updated accurate signals are at your disposal. If you run into any problems while trading, these signals serve as a reliable reference—don’t hesitate to use them! I truly hope they bring you significant assistance

CRUDE OIL FREE SIGNAL|SHORT|
✅CRUDE OIL is going up now
But a strong resistance level is ahead at
Thus I am expecting a pullback and we
Will be able to enter a the following short trade:
------------------------
Entry: 86.500
Stop Loss: 86.700
Take Profit: 86.100
------------------------
SHORT🔥
✅Like and subscribe to never miss a new idea!✅

WTI Crude Oil ReboundsWTI Crude Oil Rebounds
Crude oil is recovering and might rise toward the $64.30 resistance zone.
Important Takeaways for WTI Crude Oil Prices Analysis Today
- WTI Crude oil is recovering losses and trading above $62.60.
- There is a major bearish trend line in place with resistance near $63.65 on the hourly chart of XTI/USD.
WTI Crude Oil Price Technical Analysis
On the hourly chart of WTI Crude Oil, the price found support near $61.60 against the US Dollar. The price formed a base and started a recovery wave above $62.60 and the 50-hour simple moving average.
The bulls were able to push the price above the 50% Fib retracement level of the downward move from the $64.32 swing high to the $61.58 swing low. The hourly RSI is above the 60 level, but the price is struggling near $63.65.
Besides, there is a major bearish trend line in place with resistance near $63.65. It coincides with the 76.4% Fib retracement. A close above the trend line resistance might send the price toward the $64.32 high.
The next hurdle could be $65.00. A clear move above $65.00 could send the price toward $66.25. Any more gains might open the doors for a test of $68.00.
Conversely, the price might start a fresh decline from $63.65. Immediate support sits near $62.95. The key breakdown zone on the WTI crude oil chartmight be $62.60 and the 50-hour simple moving average.
If there is a downside break, the price might decline toward $62.60. Any more losses might encourage the bears for a push toward the $61.58 low.
This article represents the opinion of the Companies operating under the FXOpen brand only. It is not to be construed as an offer, solicitation, or recommendation with respect to products and services provided by the Companies operating under the FXOpen brand, nor is it to be considered financial advice.

4 Possible Scenarios for USOIL (WTI Crude Oil, H1) I SEP/24/2025Scenario 1: Price Rejects Supply Zone (63.80 – 63.94)
The Supply Zone at 63.80–63.94 has acted as a strong resistance.
If price fails to break above this zone, a short-term pullback is likely.
Nearest target: POC zone at 63.05. If this level is broken, price could move further down to the Liquidity Zone at 62.36.
👉 This is a short-term bearish scenario.
Scenario 2: Price Breaks Supply Zone and Moves Higher
If price breaks out and closes an H1 candle above 63.94, the short-term bullish trend will be confirmed.
The Supply Zone will then flip into a support area.
Next potential target: 64.50 – 65.00.
👉 This is a strong bullish scenario, but confirmation is required.
Scenario 3: Price Pulls Back to POC Zone (63.05) and Bounces
The POC zone (Point of Control) at 63.05 is a key volume balance level.
If price retraces here and strong buying pressure appears, a bounce back toward the Supply Zone (63.80–63.94) is likely.
👉 This is a sideway-accumulation then bullish scenario.
Scenario 4: Price Drops Deep into Demand Zone (61.76)
If strong selling pressure breaks through the Liquidity Zone (62.36), price may fall deeper to the Demand Zone at 61.76.
This is a key demand level where a short-term bottom could form, followed by a strong rebound.
👉 This is a deep bearish then recovery scenario.
Disclaimer: This analysis is for informational and educational purposes only, not financial advice. Please manage your own risk before making any trading decisions.

Oil analysisThe oil buy trigger we gave yesterday has been activated and already hit its target. After that, we need to wait and see how the price reacts to the channel’s ceiling before making the next decision. However, with this momentum, it looks like it’s heading to break the channel’s ceiling. ✅

USOIL TodayThe recent core support level is around 62,today, the price briefly bottomed out at the 62 support level, but immediately bounced back upwards and failed to achieve a genuine downside breakout. if this level is breached, the price may retrace to the 60-61 range. Resistance levels are concentrated in the 65-66 zone. Based on recent technical data, the momentum indicators on the daily timeframe are showing signs of a weak rebound.
WTI crude oil Wave Analysis – 23 September 2025
- WTI crude oil reversed up from the key support level 61.70
- Likely to rise to resistance level 65.00
WTI crude oil recently reversed up from the key support level 61.70 (which has been reversing the price from the start of August) intersecting with the lower daily Bollinger Band.
The upward reversal from the support level 61.70 will most likely form the daily Japanese candlesticks reversal pattern Morning Star – if the price closes today near the current levels.
Given the strength of the support level 61.70, WTI crude oil can be expected to rise to the next resistance level 65.00 (which stopped earlier waves a, 2 and ii).

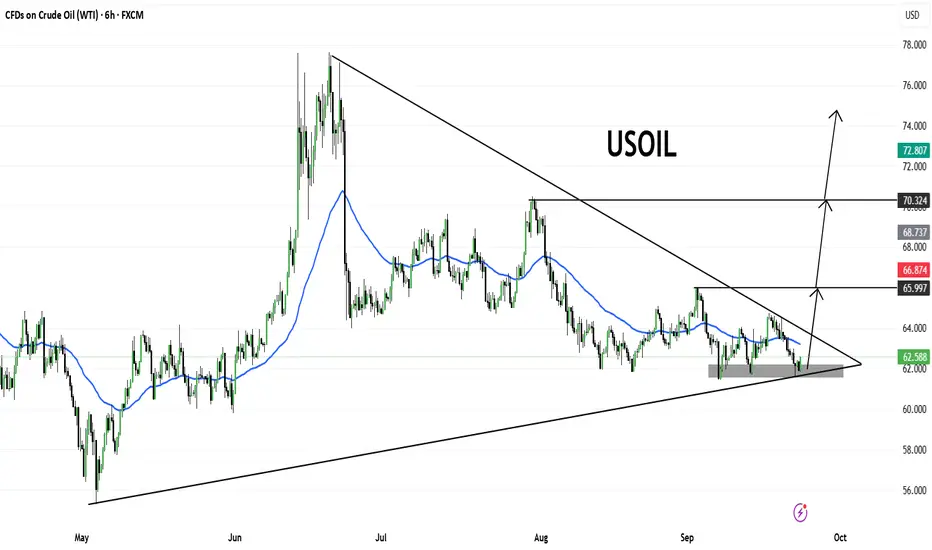
WTI key levels in play as oil prices bounceCrude oil is worth close attention. Prices have been consolidating within what appears to be a descending triangle formation — a pattern that typically signals continuation of a downtrend. But today we have seen a nice bounce off the key support area around $62, where prior lows align with the triangle’s base. While intraday wobbles have pierced this level, daily closes have generally respected it, making it the battleground to watch. A clean break beneath $62 would likely open the door for a deeper move towards $60, and potentially $55 if selling momentum gathers pace.
On the topside, the picture is equally clear. The area between $63.60 to 65.00, the grey-shaded resistance region, previously a pivot zone, has been a major resistance area in recent trade. The bearish trendline also intersects in this zone. To turn convincingly bullish on oil, we’d need to see a decisive breakout above that cluster of resistance.
By Fawad Razaqzada, market analyst with FOREX.com

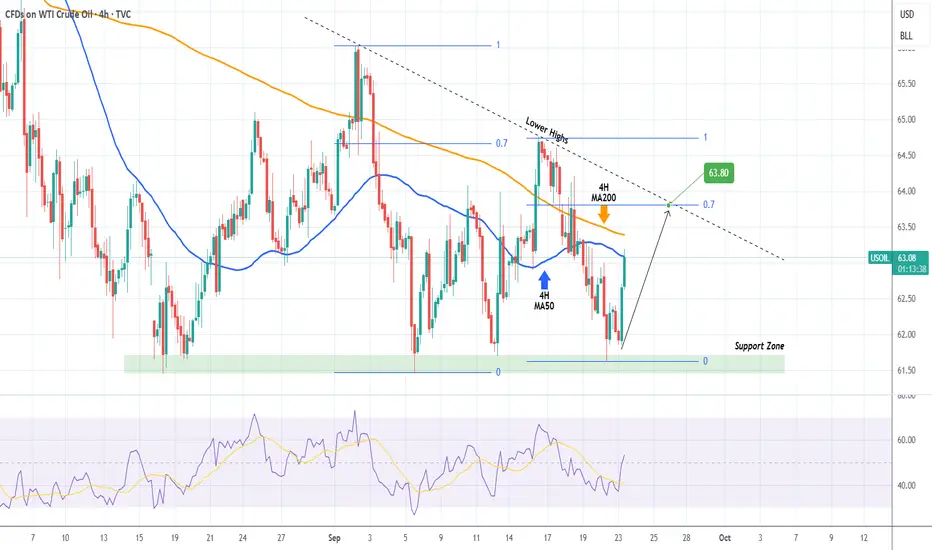
WTI OIL Descending Triangle targeting its top.WTI Oil (USOIL) has been trading within a Descending Triangle and following yesterday's test of its Support Zone, it is rebounding.
This Bullish Leg has already touches the 4H MA50 (blue trend-line) and based on the previous one, it should extend to at least the 0.7 Fibonacci retracement level.
This gives us a 63.80 Target before the pattern's Lower Highs trend-line is tested.
-------------------------------------------------------------------------------
** Please LIKE 👍, FOLLOW ✅, SHARE 🙌 and COMMENT ✍ if you enjoy this idea! Also share your ideas and charts in the comments section below! This is best way to keep it relevant, support us, keep the content here free and allow the idea to reach as many people as possible. **
-------------------------------------------------------------------------------
💸💸💸💸💸💸
👇 👇 👇 👇 👇 👇

USOILPrice is consolidating inside a large symmetrical triangle pattern, with strong support forming around the $62.00–62.50 zone. A breakout is approaching as price nears the apex.
🔹 Key levels to watch:
Resistance zone: $65.99 – $66.87
Major breakout confirmation: $70.32
Upside target (if breakout sustains): $72.80 – $74.00
🔹 Bias:
As long as $62.00 holds, bulls may attempt a breakout towards the upper resistance trendline. A clean close above $66.87 could trigger momentum toward $70.32 and potentially $72+.
⚠️ However, a failure to hold $62.00 support may invalidate the bullish setup and push price lower.
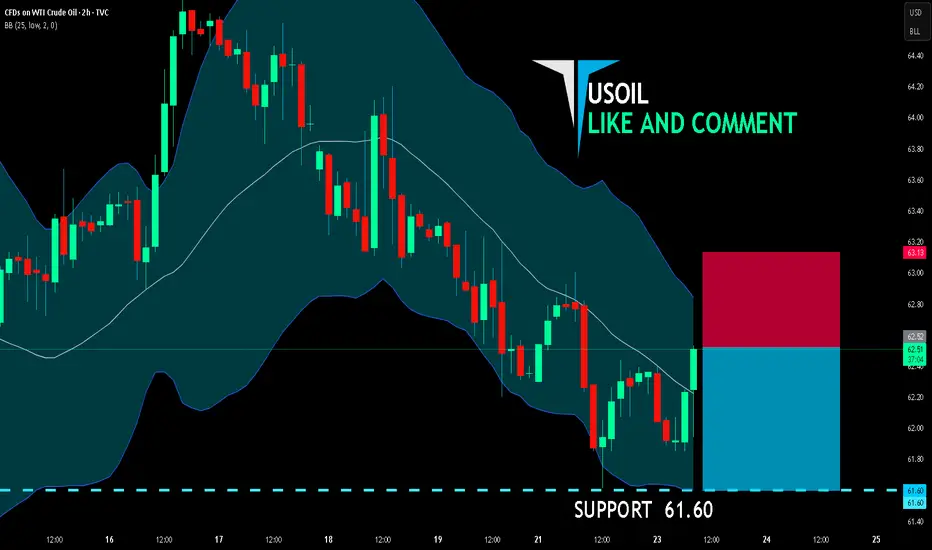
USOIL SHORT FROM RESISTANCE
USOIL SIGNAL
Trade Direction: short
Entry Level: 62.52
Target Level: 61.60
Stop Loss: 63.13
RISK PROFILE
Risk level: medium
Suggested risk: 1%
Timeframe: 2h
Disclosure: I am part of Trade Nation's Influencer program and receive a monthly fee for using their TradingView charts in my analysis.
✅LIKE AND COMMENT MY IDEAS✅
OILWith the failure of resistance, there can be a purchase.
For purchase and sale, you also have a personal review.

GENERAL CONTEXTUSOIL remains in a short-term downtrend, capped by the H1 descending trendline.
Price just bounced from Demand zone ~61.85–62.00 (VAL) → showing buy-side reaction.
POC ~63.30 is the key magnet zone.
Supply zone ~63.90–64.00 (VAH) aligns with strong resistance.
📍 TRADING SCENARIOS
🟢 Scenario 1 – BUY at Demand zone (61.85–62.00 / VAL)
🔺 Conditions:
Price retests Demand zone (VAL).
Bullish reversal candles appear (Pin Bar / Engulfing M15–H1).
RSI > 30, bullish divergence confirmed.
🔹 Reason:
VAL often acts as strong support.
Confluence with Demand zone → high probability of bounce.
🎯 TP: 63.30 (POC) → 63.90 (VAH)
🛑 SL: below 61.70
🟡 Scenario 2 – SELL reaction at Supply zone (63.90–64.00 / VAH)
🔺 Conditions:
Price retests Supply zone + VAH.
Strong rejection forms (Bearish Pin Bar / Engulfing).
RSI > 70 or MACD losing momentum.
🔹 Reason:
VAH often works as distribution/profit-taking zone.
Aligns with Supply zone, high chance of pullback.
🎯 TP: 63.30 (POC) → 62.00 (VAL)
🛑 SL: above 64.20
🔴 Scenario 3 – SELL if breakdown below 61.80 (VAL)
🔺 Conditions:
H1 candle closes below 61.80.
Retest of VAL fails from below.
🔹 Reason:
Losing VAL → downtrend continuation.
Price likely seeks lower lows.
🎯 TP: 61.20 → 60.50
🛑 SL: above 62.20
⚠️ Scenario 4 – BUY breakout above 64.00 (VAH)
🔺 Conditions:
H1 candle closes firmly above 64.00.
Pullback holds above 63.90.
🔹 Reason:
Breakout of VAH + Supply zone confirms strong bullish momentum.
Could trigger a deeper rebound.
🎯 TP: 65.20 → 66.00
🛑 SL: below 63.60
📌 SUMMARY
The 61.85–62.00 (VAL/Demand zone) is the best BUY zone.
The 63.90–64.00 (VAH/Supply zone) is a potential SELL zone.
Overall bias remains bearish, but short-term bounce toward POC 63.30 is possible.
Strict risk management is required as crude oil tends to be highly volatile.
Disclaimer: This analysis is provided for educational and informational purposes only and does not constitute financial advice. Trading involves risk, and you should only trade with money you can afford to lose. Always do your own research before making any investment decisions.

Oil bearish viewOil remains under bearish pressure for a long period of time. It is very possible that we will see oil fall below the $50 price. The last time we were there was in January 2021.

[Long] WTIUSD (Septemberr 22, 2025)Entry: 62.450
SL: 62.362
TP: 63.065
Trying new strategy what I found.
Backtest was completed.
Live trade is on.
