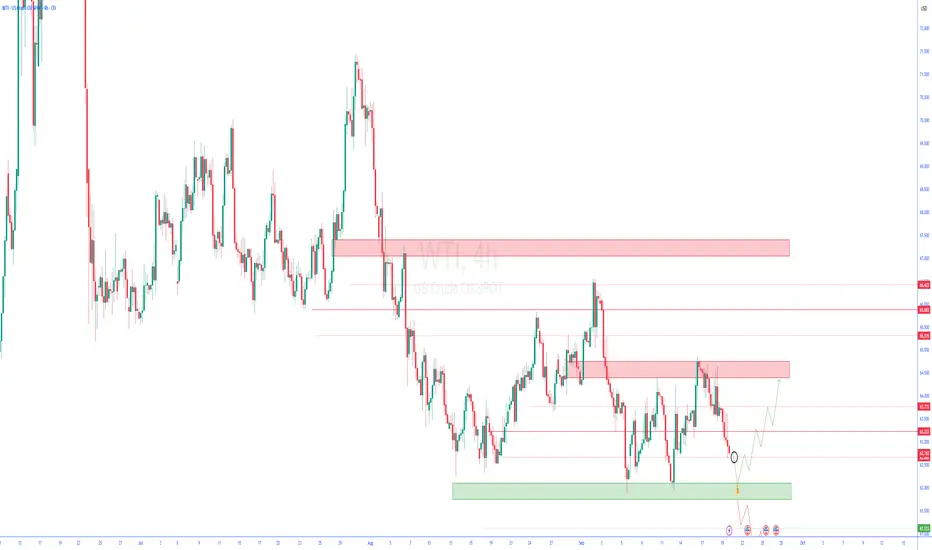
4 Possible Scenarios for USOIL (WTI Crude Oil, H1) I SEP/24/2025Scenario 1: Price Rejects Supply Zone (63.80 – 63.94)
The Supply Zone at 63.80–63.94 has acted as a strong resistance.
If price fails to break above this zone, a short-term pullback is likely.
Nearest target: POC zone at 63.05. If this level is broken, price could move further down to the Liquidity Zone at 62.36.
👉 This is a short-term bearish scenario.
Scenario 2: Price Breaks Supply Zone and Moves Higher
If price breaks out and closes an H1 candle above 63.94, the short-term bullish trend will be confirmed.
The Supply Zone will then flip into a support area.
Next potential target: 64.50 – 65.00.
👉 This is a strong bullish scenario, but confirmation is required.
Scenario 3: Price Pulls Back to POC Zone (63.05) and Bounces
The POC zone (Point of Control) at 63.05 is a key volume balance level.
If price retraces here and strong buying pressure appears, a bounce back toward the Supply Zone (63.80–63.94) is likely.
👉 This is a sideway-accumulation then bullish scenario.
Scenario 4: Price Drops Deep into Demand Zone (61.76)
If strong selling pressure breaks through the Liquidity Zone (62.36), price may fall deeper to the Demand Zone at 61.76.
This is a key demand level where a short-term bottom could form, followed by a strong rebound.
👉 This is a deep bearish then recovery scenario.
Disclaimer: This analysis is for informational and educational purposes only, not financial advice. Please manage your own risk before making any trading decisions.
USOUSD trade ideas

Oil analysisThe oil buy trigger we gave yesterday has been activated and already hit its target. After that, we need to wait and see how the price reacts to the channel’s ceiling before making the next decision. However, with this momentum, it looks like it’s heading to break the channel’s ceiling. ✅

WTI crude oil Wave Analysis – 23 September 2025
- WTI crude oil reversed up from the key support level 61.70
- Likely to rise to resistance level 65.00
WTI crude oil recently reversed up from the key support level 61.70 (which has been reversing the price from the start of August) intersecting with the lower daily Bollinger Band.
The upward reversal from the support level 61.70 will most likely form the daily Japanese candlesticks reversal pattern Morning Star – if the price closes today near the current levels.
Given the strength of the support level 61.70, WTI crude oil can be expected to rise to the next resistance level 65.00 (which stopped earlier waves a, 2 and ii).

GENERAL CONTEXTUSOIL remains in a short-term downtrend, capped by the H1 descending trendline.
Price just bounced from Demand zone ~61.85–62.00 (VAL) → showing buy-side reaction.
POC ~63.30 is the key magnet zone.
Supply zone ~63.90–64.00 (VAH) aligns with strong resistance.
📍 TRADING SCENARIOS
🟢 Scenario 1 – BUY at Demand zone (61.85–62.00 / VAL)
🔺 Conditions:
Price retests Demand zone (VAL).
Bullish reversal candles appear (Pin Bar / Engulfing M15–H1).
RSI > 30, bullish divergence confirmed.
🔹 Reason:
VAL often acts as strong support.
Confluence with Demand zone → high probability of bounce.
🎯 TP: 63.30 (POC) → 63.90 (VAH)
🛑 SL: below 61.70
🟡 Scenario 2 – SELL reaction at Supply zone (63.90–64.00 / VAH)
🔺 Conditions:
Price retests Supply zone + VAH.
Strong rejection forms (Bearish Pin Bar / Engulfing).
RSI > 70 or MACD losing momentum.
🔹 Reason:
VAH often works as distribution/profit-taking zone.
Aligns with Supply zone, high chance of pullback.
🎯 TP: 63.30 (POC) → 62.00 (VAL)
🛑 SL: above 64.20
🔴 Scenario 3 – SELL if breakdown below 61.80 (VAL)
🔺 Conditions:
H1 candle closes below 61.80.
Retest of VAL fails from below.
🔹 Reason:
Losing VAL → downtrend continuation.
Price likely seeks lower lows.
🎯 TP: 61.20 → 60.50
🛑 SL: above 62.20
⚠️ Scenario 4 – BUY breakout above 64.00 (VAH)
🔺 Conditions:
H1 candle closes firmly above 64.00.
Pullback holds above 63.90.
🔹 Reason:
Breakout of VAH + Supply zone confirms strong bullish momentum.
Could trigger a deeper rebound.
🎯 TP: 65.20 → 66.00
🛑 SL: below 63.60
📌 SUMMARY
The 61.85–62.00 (VAL/Demand zone) is the best BUY zone.
The 63.90–64.00 (VAH/Supply zone) is a potential SELL zone.
Overall bias remains bearish, but short-term bounce toward POC 63.30 is possible.
Strict risk management is required as crude oil tends to be highly volatile.
Disclaimer: This analysis is provided for educational and informational purposes only and does not constitute financial advice. Trading involves risk, and you should only trade with money you can afford to lose. Always do your own research before making any investment decisions.

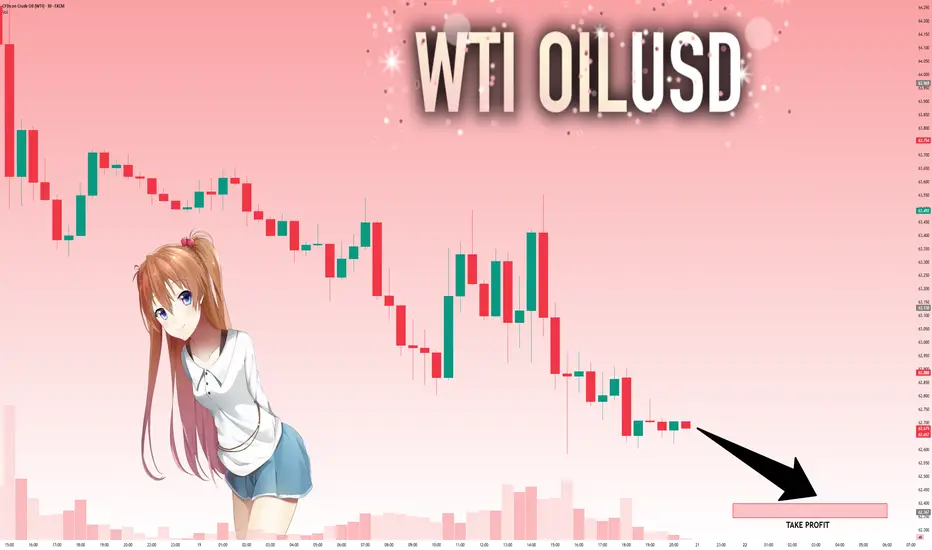
[Long] WTIUSD (Septemberr 22, 2025)Entry: 62.450
SL: 62.362
TP: 63.065
Trying new strategy what I found.
Backtest was completed.
Live trade is on.

US OIL WTI Long
Entry 62.46
SL 61.98
TP 63.20
This is a counter-trend setup, the main structure is still bearish.
A strong bullish candle close above 62.600 would strengthen the bullish case toward to TP2.
If 62.200 fails to hold, expect continuation lower, with next possible demand near 61.500–61.600.
Fundamentally, Oil is currently undervalued against the US Dollar index and US Bond. I will expect some value gain.
Technically:
This is a tactical long setup based on a demand zone bounce with RSI confluence. It’s a short-term play aiming for corrective upside within a broader bearish market. Partial profit-taking at TP1 is recommended, with a chance to extend gains to TP2 if momentum follows through.

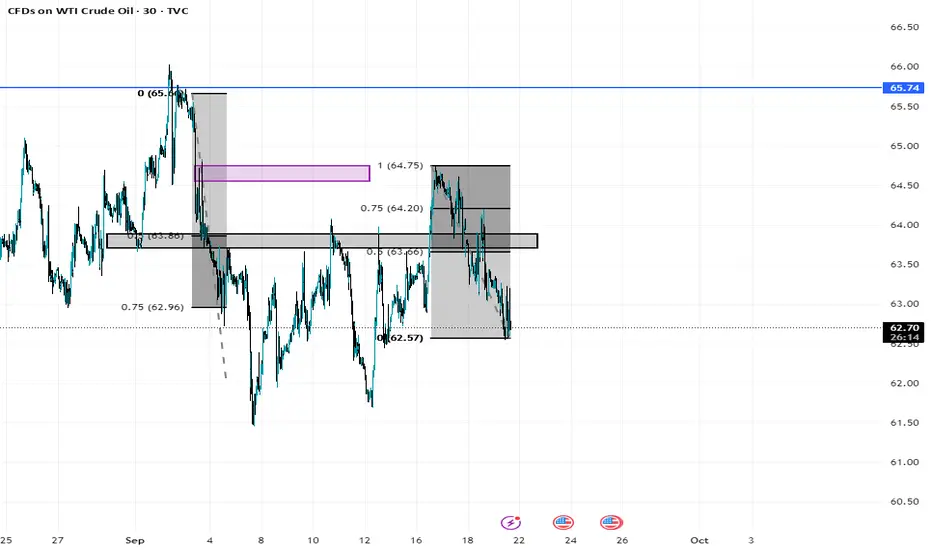
USOIL TREND ANALYSISHERE we have USOIL IN 30m TIMEFRAME and ITS in down trend so we have marked all the important areas of this trend. ONCE,the market reaches that marked areas, WE WILL SHIFT TO SMALLER TIMEFRAME AND LOOK FOR TRENDSHIFT AND TAKE TRADE FOR SELL SIDE .
IMPORTANT AREAS
50 PERCENT AREA=(63.22)
75 PERCENT AREA=(63.69)

Crude oil review - DAILY - 22/09/2025Oil prices fell on Friday as concerns about abundant supply and weakening demand outweighed optimism from the U.S. Federal Reserve’s first interest-rate cut of the year. OPEC is easing its production cuts, Russian exports remain unaffected by sanctions, and the refinery maintenance season is set to reduce demand further.
The Fed lowered rates by 25 basis points in last week’s meeting, with hints of more cuts to come, but experts argued that such small moves won’t lift oil markets given weak fundamentals. Energy agencies have all flagged slowing demand, and a surprise 4 million-barrel build in U.S. distillate stockpiles added pressure to prices.
On the technical side, the price of crude oil has declined after finding sufficient resistance on the 50-day moving average and the 61.8% of the weekly Fibonacci retracement level. The Stochastic is still at neutral levels while the moving averages are validating the overall bearish trend in the market. The Bollinger bands are sufficiently expanded, showing that there is volatility to support any short-term spikes. In any case, the price area of $62 is still the major technical support area that the price failed to break below in the past 2 months.
Disclaimer: The opinions in this article are personal to the writer and do not reflect those of Exness

wti 4hTrading Perspectives for the Upcoming Week
In this series of analyses, we have reviewed short-term trading perspectives and outlooks.
As can be seen, in each analysis there is a significant support/resistance zone near the current asset price. The market’s reaction to or break of this level will determine the future price trend up to the next specified levels.
Important Note: The purpose of these trading perspectives is to examine key price levels and the market’s potential reactions to them. The analyses provided are by no means trading signals!
USOIL: Strong Bearish Sentiment! Short!
My dear friends,
Today we will analyse USOIL together☺️
The in-trend continuation seems likely as the current long-term trend appears to be strong, and price is holding below a key level of 62.657 So a bearish continuation seems plausible, targeting the next low. We should enter on confirmation, and place a stop-loss beyond the recent swing level.
❤️Sending you lots of Love and Hugs❤️
USOIL (WTI Crude Oil) Intraday & Swing Outlook🛢️ USOIL (WTI Crude Oil) Forecast – Intraday & Swing Outlook 🚀📉
Asset Class: USOIL (SPOTCRUDE / WTI CASH)
Last Closing Price: $62.796
Date/Time: 20th Sept 2025 – 12:50 AM UTC+4
🔍 Market Context
Crude oil remains in a volatile zone as macro factors like OPEC+ policy, global demand recovery, and geopolitical risks continue to steer momentum. Traders must prepare for short squeezes, traps, and breakout plays this week.
📊 Technical Overview
Chart Theories Applied:
📈 Elliott Waves – corrective Phase B nearing end.
🔄 Wyckoff – signs of re-accumulation spotted.
🔺 Head & Shoulders (Inverse) – potential bullish reversal.
🔮 Gann Angles & Time Cycle – short-term resistance clustering near $64.50.
🛠️ Indicators
🔵 RSI (H1) → Neutral zone (48–52).
📏 VWAP Anchored → $62.20 (support pivot).
📉 EMA 20 / EMA 50 → Bullish cross on H4 confirmed.
🎯 Bollinger Bands → Expansion phase → Expect high volatility.
🕒 Timeframe Strategies
📌 Intraday (5M / 15M / 1H / 4H)
Buy Entry (Scalp): $62.20 – $62.50 🟢
TP1: $63.20 🎯
TP2: $63.85 🎯
SL: $61.80 ❌
Sell Entry (Scalp): $63.80 – $64.20 🔴
TP1: $63.00 🎯
TP2: $62.40 🎯
SL: $64.70 ❌
📌 Swing (Daily / Weekly)
Buy Zone: $61.50 – $62.00 🟢
Targets: $65.20 / $67.40 / $70.00 🎯
Stop Loss: $60.50 ❌
Sell Zone (Rejection): $67.40 – $68.00 🔴
Targets: $64.50 / $62.20 🎯
Stop Loss: $68.80 ❌
⚠️ Risk Management
Volatility expected due to Fed rate guidance & OPEC+ commentary.
Stick to 2–3% capital risk per trade.
Watch for bull/bear traps near breakout zones.
📌 Summary
Intraday: Range $62.20 – $64.20 ⚖️
Swing: Upside bias if $61.50 holds strong 💹
Key Resistance: $64.50 / $67.40
Key Support: $61.50 / $60.50
🔥 Bias: Short-term sideways → Medium-term bullish above $61.50.
For individuals seeking to enhance their trading abilities based on the analyses provided, I recommend exploring the mentoring program offered by Shunya Trade. (Website: shunya dot trade)
I would appreciate your feedback on this analysis, as it will serve as a valuable resource for future endeavors.
Sincerely,
Shunya.Trade
Website: shunya dot trade

USOIL TREND ANALYSISUSOIL is in down trend for a long(30 minutes tf) time so the important areas are marked. When market reaches that marked zones, we will shift to smaller time frame and look for small trend shift once it happens we will go for the sell side trade.

Crude Oil: Bearish FVG in Play Amid ConsolidationFenzoFx—Crude Oil is trading at $64.18, slightly below the bearish fair value gap. The sweep of yesterday’s lows suggests potential for a test of higher resistance. Immediate support is at $63.80. If this level holds, Oil may fill the bearish FVG and test resistance at $65.00. A break above could extend gains toward $66.50.
However, if price declines and stabilizes below $63.80, the bullish outlook is invalidated. In that case, the downtrend may resume, targeting the equal lows at $62.20.

Oil’s rebound looks temporary amid various supply and demand prOil’s rebound looks temporary amid various supply and demand pressures.
Technical View
USOIL is currently rebounding from the support at 61.50, breaking above the previous swing high, while moving within a sideways range between 61.50 – 66.00, which should only be a short-term consolidation.
However, the broader trend remains bearish, as seen from series of lower swings, bearish EMAs, and the two-year Descending Channel. Once the consolidation phase ends, prices are likely to break below the lower bound downward.
So, the current rally in USOIL is expected to be only a short-term rebound, with resistance at 66.00 and at the upper bound of the descending trend channel just above 70.00.
On the downside, if USOIL falls below the lower bound of the sideways range at 61.50, it may retest the support at 55.00, the lowest point in 4.5 years, which if breaks, the prices could fall lower below 50.00.
Fundamental View
At present, oil prices are rebounding due to Fed easing expectation, which supported risk assets, while the weaker dollar is also helping to lift oil prices, which look like sentiment driven, not a solid fundamental.
Therefore, this recovery is likely only short-lived because, in the longer term, there are various pressures to the price:
Supply-side pressures :
Increased production from OPEC+ and non-OPEC countries has led to an oversupply in the oil market. For example, U.S. production at 13.4–13.6 mb/d covers most domestic needs, changing the country's positioning to a net exporter.
Demand-side pressures :
Global oil demand is slowing, particularly from China, amid sluggish global economic recovery and even recession risks in some regions, which have reduced overall energy consumption.
Growing investment in renewables and the gradual adoption of electric vehicles signal a structural transition that is likely to weigh on oil demand over the long term, reinforced by legislative bans on internal combustion engines in several countries.
Policy shifts from the US government also aim to push oil prices lower in order to control inflation.
Analysis by: Krisada Yoonaisil, Financial Markets Strategist at Exness

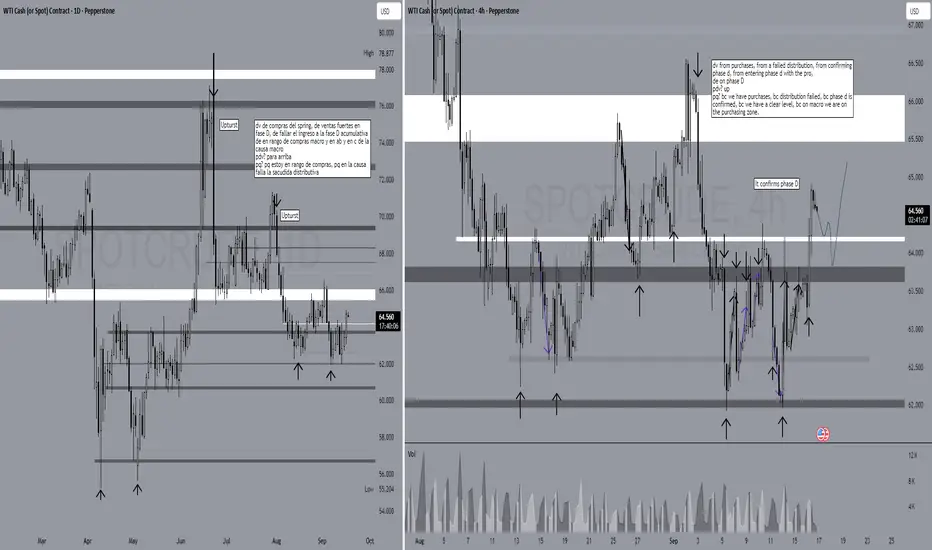
playing on C macroIt seems that we are on c macro, also the price just confirmed that we are on phase D. We only have to wait for the shakeout. start covering at 65.448 at least half of the position, then play aggressively with your st because we are facing a wall, however, it the wall is broken, we will start reaching higher prices till at least 68.262
this is not financial recommendations.
WTI Crude upside resistance at 6540The WTI Crude Oil is currently trading with a bearish bias, aligned with the broader downward trend. Recent price action shows a retest of the resistance, suggesting a further selling pressure within the downtrend.
Key resistance is located at 6540, a prior consolidation zone. This level will be critical in determining the next directional move.
A bearish rejection from 6540 could confirm the resumption of the downtrend, targeting the next support levels at 6200, followed by 6070 and 6000 over a longer timeframe.
Conversely, a decisive breakout and daily close above 6540 would invalidate the current bearish setup, shifting sentiment to bullish and potentially triggering a move towards 6650, then 6830.
Conclusion:
The short-term outlook remains bearish unless WTI Crude breaks and holds above 6540. Traders should watch for price action signals around this key level to confirm direction. A rejection favours fresh downside continuation, while a breakout signals a potential trend reversal or deeper correction.
This communication is for informational purposes only and should not be viewed as any form of recommendation as to a particular course of action or as investment advice. It is not intended as an offer or solicitation for the purchase or sale of any financial instrument or as an official confirmation of any transaction. Opinions, estimates and assumptions expressed herein are made as of the date of this communication and are subject to change without notice. This communication has been prepared based upon information, including market prices, data and other information, believed to be reliable; however, Trade Nation does not warrant its completeness or accuracy. All market prices and market data contained in or attached to this communication are indicative and subject to change without notice.

WTI falls after US slaps 50% tariff on India over Russian oilWTI oil prices have dropped from $65 to around $62.80 as markets react to new US tariffs on India, triggered by India’s ongoing oil trade with Russia. These tariffs, along with threats of even higher tariffs on China, are weighing on global demand and pushing oil prices lower. Meanwhile, Iran’s oil production has hit multi-year highs, adding more supply to the market and reinforcing the bearish trend.
Technically, oil has broken below a key Fibonacci support level, signalling a deeper pullback. If prices fall below $62, further downside toward $57 is possible. Upside moves may be short-lived unless there’s a major geopolitical shock, such as an escalation in the Russia-Ukraine conflict. For now, both the macro environment and technical signals indicate continued pressure on oil prices.
This content is not directed to residents of the EU or UK. Any opinions, news, research, analyses, prices or other information contained on this website is provided as general market commentary and does not constitute investment advice. ThinkMarkets will not accept liability for any loss or damage including, without limitation, to any loss of profit which may arise directly or indirectly from use of or reliance on such information.

Crude Oil Monthly Forecast: September 2025
The West Texas Intermediate Crude Oil market has been rather negative during the month of August, but at the end of the month we saw the market bounce roughly 50% of the move, and as I do this analysis at the end of the month, we are sitting at a crucial level.
This does make a certain amount of sense, because there are a lot of questions right now about where the global economy is going.
Crude Oil and the Economy
Keep in mind that crude oil is extraordinarily important for most economies, and of course the transportation of goods and services. In other words, crude oil will rally in times of economic growth but also will struggle in times where growth is extraordinarily limited. That’s the question we find ourselves trying to answer at the moment, and this may be part of the reason why we are hanging around and trying to sort out where we are going next.
Another major problem at the moment is the fact that Russia, OPEC, in the United States are all ramping up production, which of course will drive down price as supply is getting to be too much. Between that and the possibility of the global economy slowing down, this could be a very bad sign for crude oil. This isn’t to say that we need to fall apart, just that it might be extraordinarily difficult for oil to get a bit of a bid at the moment.
Ultimately, I think the $65 level continues to be an area of interest, as the price has acted like a magnet more than once. If we can rally from here, somewhere around the $60 level I would expect to see a lot of resistance. On the other hand, if we drop from here, I think somewhere around the $60 level there should be significant support. Anything below would be an extraordinarily negative sign. I believe we are trying to find some type of range, perhaps between the $62 level and the $67 level, but we will have to wait and see how that plays out. Either way, I would anticipate choppy and basically sideways action for the month.

WTI long or short?Personally i don't see the short becuase we are on a huge buying range, which means that if the market really wants to go down will have to work. Not only that but also they already tried to push the market down that the process failed when buyers stepped in around the 62s.
Anyway, on 4h im seeing how the first time that it got to 62 the buyer appeared aggresively and the second time they literally stopped the market from continue falling. According to what i have said, it is possible to project potential purchases once it breaks 64.192 however, we have to be sure that it is a high quality brea (all the mases can see it and are already in) After that, it is as simple as waiting for a shakeut (wait until they have created liquidity and reclaimed 64.192) after that the market is very likely to go to 65.349. if im correct, i will cover at least 60-70% or more because ill be going against a huge wall and we might still be on AB or already an internal process of D. Lets see

Boring oilHonestly, even if you analyze oil just once a month and then come back to the chart the next month, you wouldn’t miss anything — the chart is that repetitive. For months now, the price has been fluctuating between \$63 and \$61. So for now, we won’t be posting any more oil analyses until a new conflict in the Middle East happens that could push the price higher. ✅

Oil gains amid geopolitical risks, supply outlookOil gains amid geopolitical risks, supply outlook
Oil rose in early trade as markets weighed rising geopolitical tensions against forecasts of oversupply. Trump warned of major sanctions on Russia and urged allies to impose steep tariffs on China and India for buying its crude, while Ukraine’s drone strikes on Russian refineries added to risks.
Goldman Sachs expects oil to trend lower next year on strong supply growth but says prices may rebound sooner if inventories peak or OPEC cuts output. The bank now sees Brent in the low $50s and WTI near $50 by end-2026.

USOIL ShortAfter a long consolidation. We see minor pullbacks and these are places to start shorting.
AMEX:UCO is an ETF that can be used for exposure!
