Most underrated chart?? /// S&P500 /// $7500 bull market targetMost underrated chart out there? We are on the end of raging bull run where we broke out in 2013 and been going higher and higher since then. We gone top out at around $7500. The two green circles is where the points on the ray line is and the two other ray lines is a clone of that bottom line. Hope the chart is helpful. The stage is set. Hope this chart is helpful.
Trade ideas

Financial crisis like no other coming to the SPX V SOON!Guys, it is what it says in the title.
I don't know what will cause it.
But, some how it'll happen.
Max upside potential to 6,860$, which is nothing in comparison to max downside potential of 3,958$.
What do you think will happen to other traditional assets such as property etc ?
I am not here spreading FUD, I am just stating what I see, and very much so I am near always right in the long run.

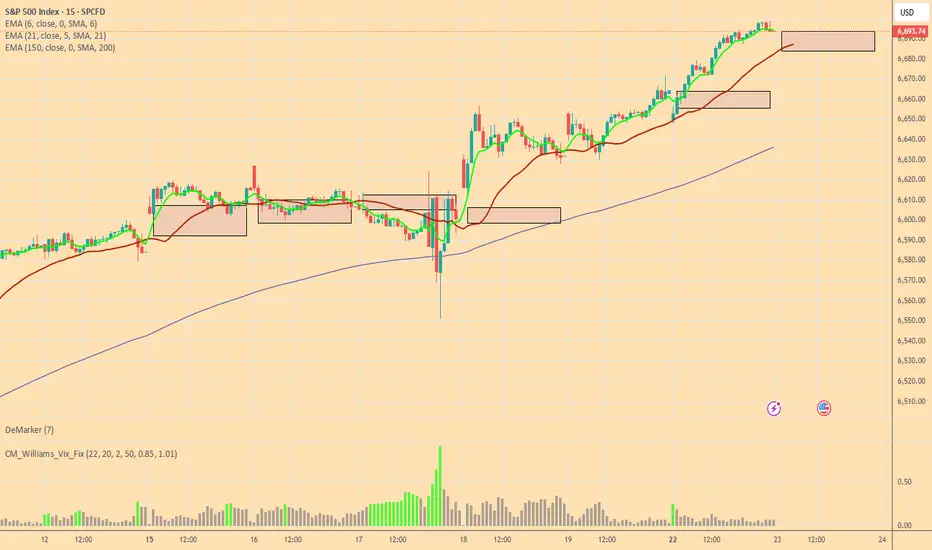
FOMC 100% Breakout (Check) - Key Resistance and 6500 Gamma PinFOMC was in fact a NOISE candle
So I measured the candle, projected a 100% breakout bullish and bearish
Bulls took the bait and ran higher, but still resistance @ 6700 seen today and hopefully
a short-term window to see a bit of a slide lower into some technical levels
EMA support levels
-watching the 21 period daily EMA
-watching the 50 period daily EMA
6550 FOMC candle lows from last week
6500 Gamma Pin with JP Morgan's quarterly collar trade
This is the first day in several weeks where I've seen some actual follow through
in negative gamma option flows
If futures grinds prices lower, the cascade may take hold and we can see a 100-200 point
selloff quickly in the S&P
I still like scooping up premium and buying the dips, but hopefully at more attractive levels
like 4-5% lower or even 8-10% lower
Let's see how it plays out. I'll be in the markets grinding per usual.
Thanks for watching!!!

SP500 Consolidation Higher to fresh HighsThe S&P 500 is consolidating within a strong range as U.S. stocks gained traction on Monday, extending record highs with additional support from the technology sector. Markets continue to assess the outlook for interest rates, but sentiment remains broadly positive.
The index advanced more than 0.5%, maintaining a bullish structure. Key resistance is seen around 6760.40, while support rests near 6650. As long as price action remains above the support zone, the path of least resistance favours continued growth.
You may find more details in the chart.
Trade wisely best of Luck,
Ps; Support with like and comments for better analysis Thanks for Support.

SPX Wave 4 nearZooming out to the longer-term view, it appears we are approaching a Wave 4 of a higher degree. After the completion of this corrective phase, I expect a final Wave 5 of the primary degree to unfold, likely carrying into the first quarter of next year, ( next year 1st 1/4 SPX 7,200-ish)

The next bubble? It is amazing to see the power of the U.S market.
The Economy and Wall Streets splitted paths a long time ago...
Inflation?
Wars?
Euro Zone Crisis?
Call it market manipulation or a rigid game... betting against the market should be only a short term strategy.

Bulls and Bears zone for 09-23-2025Last two trading sessions Bulls were very active. Hopefully, Bulls will continue the trend and make 3 sessions in a row.
Level to watch : 6752 --- 6750
S&P500 push to another ATH?Momentum & Leadership:
The index hit another record high yesterday (+0.44%), with strength again concentrated in tech and the Magnificent 7. Nvidia’s AI-driven deal with OpenAI (+3.93%) fuelled risk appetite and extended the rally. YTD gains show a narrow breadth: S&P 500 +13.8% vs equal-weighted S&P +7.7%.
Macro Data Today:
PMIs (US, UK, Eurozone, Germany, France): Watch for signs of resilience in services vs persistent weakness in manufacturing. A softening read could weigh on cyclicals but leave tech defensives relatively insulated.
US regional activity (Philly Fed services, Richmond Fed manufacturing, business conditions): Key for growth sentiment after mixed signals in recent weeks.
Q2 current account balance: Low market impact.
Central Banks:
Fed Chair Powell, Bowman, Bostic: Powell’s remarks could influence rate cut expectations post-FOMC. A cautious tone might temper equity momentum, while dovish signals could extend the rally.
Trading Implications:
The S&P’s rally remains narrowly led by tech/AI, leaving breadth weak.
Today’s PMI prints and Powell’s speech are the main potential volatility drivers – stronger growth data may challenge Fed easing expectations (pressuring valuations), while softer data could reinforce rate-cut hopes and keep the rally alive.
Watch semiconductors and Mag-7 for leadership; broader market participation is still lagging.
Key Support and Resistance Levels
Resistance Level 1: 6726
Resistance Level 2: 6747
Resistance Level 3: 6770
Support Level 1: 6655
Support Level 2: 6627
Support Level 3: 6605
This communication is for informational purposes only and should not be viewed as any form of recommendation as to a particular course of action or as investment advice. It is not intended as an offer or solicitation for the purchase or sale of any financial instrument or as an official confirmation of any transaction. Opinions, estimates and assumptions expressed herein are made as of the date of this communication and are subject to change without notice. This communication has been prepared based upon information, including market prices, data and other information, believed to be reliable; however, Trade Nation does not warrant its completeness or accuracy. All market prices and market data contained in or attached to this communication are indicative and subject to change without notice.
SPX500 ShortElite Analysis
Price accumulated after a bullish push
Asia liquidity accumulated and was taken out
4h structural liquidity was created
Price reacted off 4h structural liquidity
Targeting lower liquidity pools

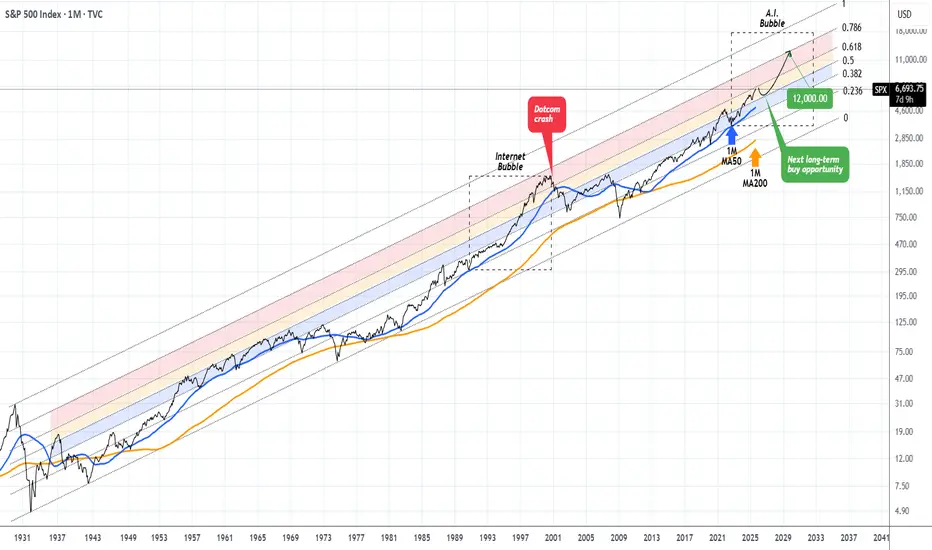
S&P500 approaching a Resistance that was last tested in 1998 !!This isn't the first time we present you this chart, in fact from time to time (usually on a quarterly basis) we like to bring this forward with some adjustments in order to help us maintain a long-term perspective.
And that technically shows the S&P500 index (SPX) trading within a century long Fibonacci Channel Up (since the 2029 Great Depression) with clear Bull and Bear Cycles. We will not get into much details on those, as they've been analyzed extensively in previous publications but we will point out that currently we remain inside a multi-year Bull Cycle.
In fact, since the November 2022 market bottom, we believe we've entered the A.I. Bubble, which is in our opinion (perhaps a more aggressive) version of the Internet Bubble of the 1990s. Again this has been analyzed extensively before.
Right now the index is approaching the top of the 0.5 - 0.618 Fib Zone (orange range). The one above (0.618 - 0.786 Fib, red Zone), was first entered in February 1998 and exited for good at the start of the Dotcom crash in February 2001. Since then, the market never even touched it (almost 25 years).
We believe that a marginal test and break inside this 'ghost zone' could be attempting by late 2025 - Q1 2026 and then a strong correction back near the 1M MA50 (blue trend-line) will present the next long-term buy opportunity that could fuel the A.I. Bubble until it finally bursts within 2030 - 2032.
Until then, a 12000 Target on SPX isn't at all an unrealistic one, in our opinion.
-------------------------------------------------------------------------------
** Please LIKE 👍, FOLLOW ✅, SHARE 🙌 and COMMENT ✍ if you enjoy this idea! Also share your ideas and charts in the comments section below! This is best way to keep it relevant, support us, keep the content here free and allow the idea to reach as many people as possible. **
-------------------------------------------------------------------------------
💸💸💸💸💸💸
👇 👇 👇 👇 👇 👇
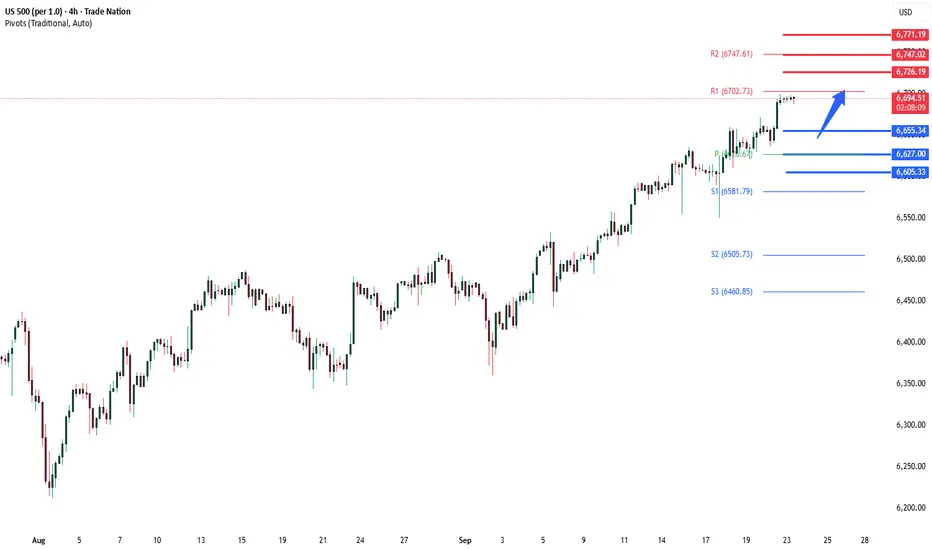
SPX500 – New Highs as Nvidia–OpenAI Deal Lifts Market SentimentSPX500 – Overview
U.S. indices hit new highs as markets digested fresh headlines, including Nvidia’s (NVDA) plan to invest up to $100 billion in OpenAI, with the first data-center gear expected to ship in the second half of 2026.
Analysts are split on the deal: bulls view it as confirmation that OpenAI sees no alternative to Nvidia GPUs, while skeptics question why Nvidia would fund a customer to buy its own equipment.
Attention also turns to the September flash PMIs, which will test U.S. economic resilience amid tariffs. Australian PMIs disappointed, but they carry little correlation to U.S. growth.
Technical Analysis
SPX500 has reached the key 6,700 resistance and is stabilizing above it, signaling continuation of the bullish trend while price trades above this pivot.
Bullish Path:
As long as price holds above 6,700, upside targets remain 6,722 → 6,742 → 6,780.
A strong 1H close above 6,742 would confirm further bullish extension.
Bearish Path:
A confirmed 1H close below 6,698 would signal a short-term correction toward 6,670.
For a deeper bearish shift, price must break the 6,663 pivot on a 1H close, opening the way to 6,634.
Key Levels
Pivot: 6,700
Resistance: 6,722 – 6,742 – 6,780
Support: 6,672 – 6,663 – 6,634


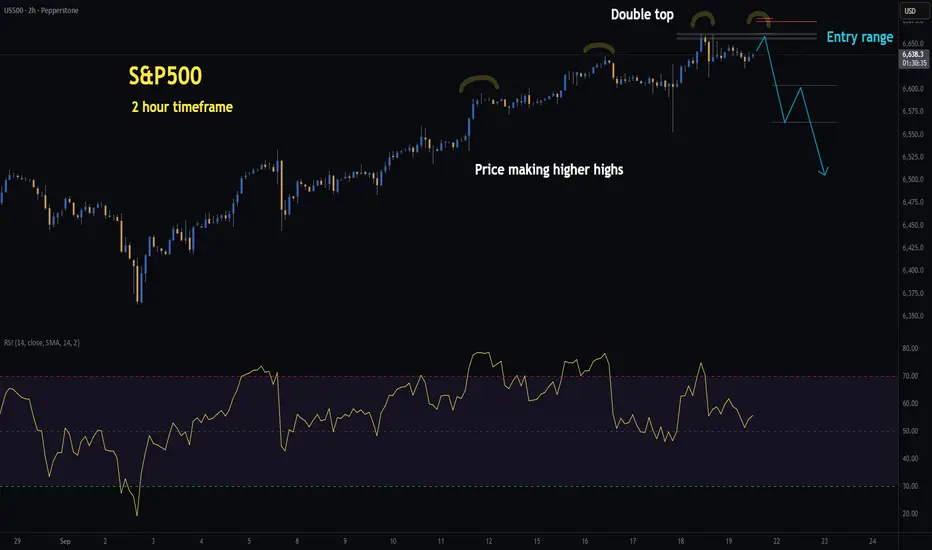
US500 | H2 Double Top | GTradingMethodHello Traders, I hope you’ve all had a profitable week!
🧐 Market overview:
The US500 has pushed into new highs since the FOMC and remains in an uptrend. However, price is advancing on weakening momentum — higher highs in price while RSI prints lower highs, a classic case of negative divergence. My system is flagging this as a potential double top setup on the 2H timeframe, but I am still waiting for confirmation before entering a short.
Interestingly, while my system highlights bearish risk, there are also bullish signals worth noting:
- Daily CMF money flow shows no negative divergence.
- Daily MACD remains on a buy signal.
- The recent rate cut adds further liquidity and stimulus to markets.
📊 My trade plan:
Risk/Reward: 3.6 – 4.5
Entry: 6,655.6 – 6,661.8
Stop Loss: 6,674.8 – 6,678.6
Take Profit 1 (50%): 6,604
Take Profit 2 (50%): 6,563
The entry and stop ranges vary depending on where the setup confirms within the zone.
Tip:
Divergences often act as early warning signs of trend exhaustion, but they work best when combined with pattern confirmation (like a double top) rather than traded in isolation.
🙏 Thanks for checking out my post!
Make sure to follow me to catch the next idea and keen to hear if you are trading the US500? :)
Please note: This is not financial advice. This content is to track my trading journey and for educational purposes only.
Close in on last segmentWell 6666 is the sign of the devil..Can it take that out .?
lets see what happens
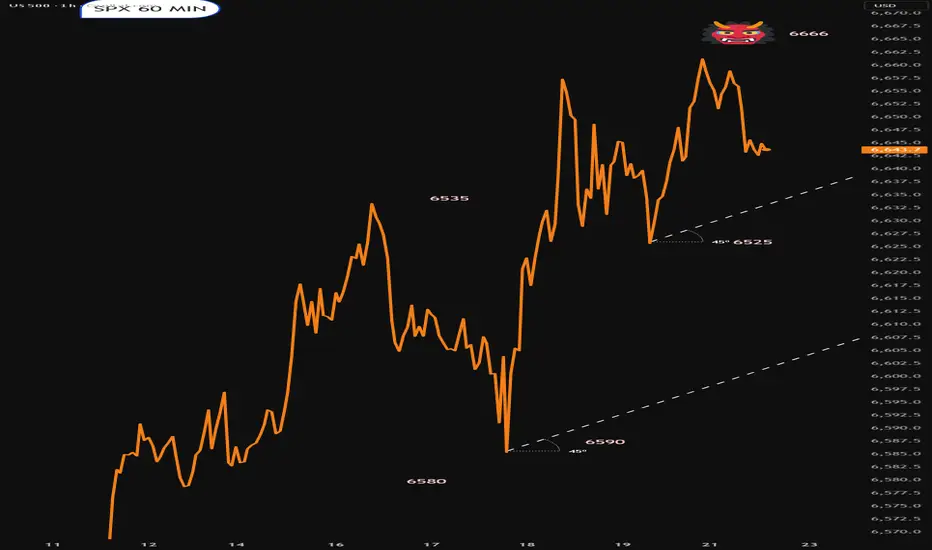
SPX despikedGot rid of some of the spikes to expose the trend.The range now seems to be 6590-6660 areas
SPX into the open/Monday 22nd SeptemberTrend markedDare ya sell it.? Really needs to pull back.that might not happen

Fed easing and earnings fuel US500 (S&P500) rally, but headwindsFed easing and earnings fuel rally, but headwinds remain.
Technical Perspective
1. The S&P 500 extends its rally, holding firmly above bullish EMAs. The EMAs consistent gap confirms strong constant momentum, reinforcing the potential for further gains.
2. The next target is 7,000, @ 161.8% Fibonacci retracement, which may act as a potential exhaustion point for the current bullish trend.
3. However, a bearish divergence between price and RSI has developed, signaling the risk of a short-term pullback in the range of 150–300 points. Such a move would likely be corrective rather than a reversal before reaching the target.
4. A decisive break above 6,700 would strengthen the bullish outlook, opening the path toward the 7,000 target.
5. Conversely, if a correction unfolds, it would be an opportunity, initial support is seen around 6,500, “the resistance become support level” that could now serve as a strong support.
Fundamental Perspective
6. S&P 500 surged, fueled by the Fed rate cut decision for the first time since Dec2024 and the Fed’s dovish forward guidance which gave investors confidence about more rate cut.
7. Strong corporate earnings, combined with optimism around AI. The technology sector is a key driver, reinforcing bullish sentiment across the index. While other sectors got rotation effect sometimes.
9. However, there are some risks remain such as; if inflation unexpectedly return, forcing the Fed to adopt a more hawkish stance. On top of that, valuations are stretched: the S&P 500’s price-to-earnings ratio (PE) hovers above 27, above the 10-year average and even higher than the pre-COVID19. Such overvaluation could act as a headwind for the index going forward.
Analysis by: Krisada Yoonaisil, Financial Markets Strategist at Exness

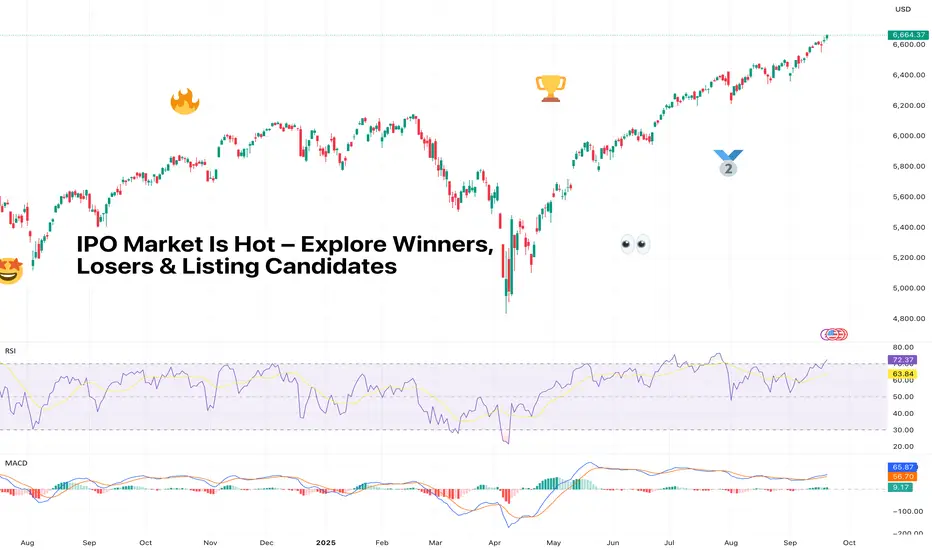
IPO Market Is Hot – Explore Winners, Losers & Listing CandidatesThe IPO market has woken up from its multi-year nap and is now in beast mode. But as always, Wall Street’s hottest party comes with an entrance fee and a dose of uncertainty – opaque prices, sketchy balance sheets, and a whole lot of FOMO.
So who’s winning, who’s losing, and who’s still waiting in the pipeline? Let’s find out.
🚀 The IPO Mania Returns
After years of drought, IPO mania is back in full swing. More than 150 companies have listed this year – up from 99 at this point in 2024 and just 76 in 2023, according to Renaissance Capital.
Together, they’ve raised nearly $30 billion, compared with $24 billion last year. First-day gains? Averaging 26%, the best since 2020. IPOs aren’t just back, they’re back with conviction.
Renaissance estimates we could see 40–60 more deals before the year is out. In other words, if you thought you missed the fun, the afterparty’s still ahead.
🤗 The Winners
Some debuts have been straight out of an IPO fantasy league.
Circle NYSE:CRCL , the stablecoin issuer, lit up the screens with a jaw-dropping 168% surge on its first trading day.
Firefly Aerospace NASDAQ:FLY , a rocket and lunar lander, blasted 30% higher on its IPO day, living up to its name.
Klarna NYSE:KLAR didn’t exactly moon, but a 15% pop for a lossmaking buy-now-pay-later firm isn’t shabby in this environment.
Then there’s Figure NASDAQ:FIGR , the blockchain-native mortgage lender. Since its listing in mid-September , it’s up 44% even after a midweek stumble. Investors love a fintech-meets-crypto mashup story – and Figure is playing it well.
Who said Figma NYSE:FIG ? The design software maker went vertical in its market debut , although reality has since slapped it down from those frothy day-one highs. Still, design nerds everywhere are proudly watching their favorite platform make its way up the rankings among the world's biggest software companies .
😭 The Losers
Not every IPO has the golden touch.
StubHub NYSE:STUB , the ticketing platform, came in hot with an 8% intraday pop above its $23.50 listing price, only to end its first session underwater at $22 . The days after? Even worse – the stock is floating near the $18 mark.
CoreWeave NASDAQ:CRWV , the AI up-and-comer, is a really interesting one. First off, it stumbled at the start after pricing its shares at $40 to float in March.
It traded under its IPO price for a while before clawing back with AI hype fueling the shares by 450% May through June. Then insider selling knocked the winds out of its sails in August.
Now it’s gravitating at triple its offering price, proving IPOs are a marathon, not a sprint.
🎲 The Pricing Game
The truth is, IPO pricing is as much science as it is art (and sometimes performance art). Investment banks like Goldman NYSE:GS , Morgan Stanley NYSE:MS , and Citi NYSE:C run the roadshows, build the books, and set the price. Oversubscribed IPOs often guarantee a strong open. Undersubscribed ones? Crickets.
Bears hate this one simple trick: most IPOs only float about 15–20% of the company. That tiny slice of tradable shares means volatility is baked into the flotation. Throw in a 180-day lockup (when insiders can’t sell), and early trading is a weird mix of price discovery and pure speculation.
💡 The Fundamentals Still Matter
The hype is real, but the numbers don’t lie. Valuations on some of these newly public firms are eye-watering. Circle trades at 130x earnings estimates, Figma at 184x. Compare that to Adobe’s 5x and you see how far the IPO froth can go.
Meanwhile, many of these firms aren’t consistently profitable. They post alternating quarters of red ink and black ink while investors cheer growth over everything.
🦄 Unicorn Watch: Who’s Next?
Here’s who’s buzzing on the IPO radar and what they’re worth in 2025:
• OpenAI, AI overlord, $500 billion
• SpaceX, rockets and satellites, $450 billion
• xAI / x.com, Elon Musk’s AI play, $200 billion
• Anthropic, OpenAI rival, $190 billion
• Databricks, data and AI analytics, $100 billion
• Stripe, payments giant, $92 billion
• Revolut, digital banking, $75 billion
• Canva, design platform (and your CV maker), $42 billion
• Fanatics, sports merch and betting, $30 billion
• Discord, chat for gamers (and everyone else), $15 billion
• Solera, software and data for auto and insurance, $10 billion
• Grayscale, crypto asset manager (part of Digital Currency Group), $10 billion
• AlphaSense, market intelligence, $4 billion
• Wealthfront, robo-advisor, $2 billion
• Quora, knowledge-sharing platform, $500 million
📉 The Risk of Chasing
So should you pile in? Here’s the trader’s dilemma: first-day pops are seductive, but inflated pricing means you’re often exit liquidity for early investors.
Waiting a few days, weeks, or even months for the froth to fade, lockups to expire, analyst coverage to roll in, and the hype to cool may be the smarter play.
🫶 Final Take
The current IPO season is hot, but so is the risk. But every IPO is different. Circle shows monster returns are possible, while StubHub proves not every ticker deserves a ticker-tape parade.
The winners? Companies with strong fundamentals (not just growth, but profits) and a story that Wall Street loves right now (AI, crypto, fintech).
The losers? Overpriced firms without consistent performance. The candidates? Mega-unicorns waiting for their grand entrance and some smaller players ready to make a splash.
As always, timing is everything. Here’s to hoping your favorite IPO won’t list right after a hawkish Jay Powell.
Off to you : What IPOs are on your radar for this year and the next? Share your thoughts in the comments!
SPX500 – Fed Speeches to Drive Next BreakoutSPX500 – Technical Outlook
Markets remain focused on Fed policy signals after last week’s rate cut and a wave of upcoming Fedspeak, while shrugging off the Trump administration’s H-1B visa crackdown. With traders pricing in further easing by year-end, comments from Fed officials will drive sentiment and could trigger sharp moves in U.S. indices.
Price Action
SPX500 is currently showing bearish momentum while trading below the pivot zone, reflecting investor caution ahead of key Fed speeches.
Bearish Path:
As long as price remains below the 6,663 pivot, downside pressure persists toward 6,634.
A confirmed 1H close below 6,634 would open the way for deeper losses toward 6,590.
Bullish Path:
A confirmed 1H candle above 6,684 would invalidate the bearish bias and signal fresh bullish momentum, targeting 6,700 → 6,742.
Key Levels
Pivot: 6,663
Resistance: 6,684 – 6,700 – 6,742
Support: 6,634 – 6,619 – 6,590

Hellena | SPX500 (4H): LONG to resistance area of 6700.Colleagues, I think we should expect the upward movement to continue. The upward impulse is not over yet, but I think we may see a correction to the 6500 area, then I expect the upward movement to continue to the 6700 area, which is a pretty strong psychological level and is the area of 50% levels of Fibonacci extension.
Manage your capital correctly and competently! Only enter trades based on reliable patterns!

The Future of World Trade with CBDCs1. The Mechanics of CBDCs in Global Trade
Before understanding the future, we must grasp how CBDCs function in practice within the trade ecosystem.
1.1 What are CBDCs?
A CBDC is a digital version of a sovereign currency, operating on secure digital ledgers (sometimes blockchain-based, sometimes centralized databases). They can exist in two forms:
Retail CBDCs: For individuals and businesses, used like cash or digital wallets.
Wholesale CBDCs: For interbank and institutional settlements, especially useful for cross-border trade.
For world trade, wholesale CBDCs are more relevant since they handle large, cross-border payments between corporations, governments, and central banks.
1.2 Current Problems in International Payments
Today, cross-border trade payments are often:
Slow: Transactions can take days due to intermediary banks.
Expensive: Fees are high, especially for developing nations.
Opaque: Hard to track payments and verify authenticity.
Fragmented: Reliant on SWIFT, correspondent banks, and dollar dominance.
1.3 How CBDCs Could Solve These
CBDCs could:
Enable instant cross-border settlements, reducing time from days to seconds.
Lower transaction costs by eliminating intermediaries.
Provide real-time tracking, reducing fraud and money laundering.
Reduce dependence on the SWIFT system and the U.S. dollar.
For example, if a Brazilian exporter sells soybeans to India, payment could be made directly via India’s Digital Rupee and Brazil’s CBDC, using a cross-CBDC bridge. No dollar conversion, no delays, no excessive fees.
2. Opportunities for Efficiency and Transparency
CBDCs open doors for significant efficiency gains in trade.
2.1 Faster Settlements
Today’s trade finance often locks up trillions of dollars in delayed settlements. CBDCs would free up liquidity, allowing businesses to reinvest faster and boost economic growth.
2.2 Lower Costs
By cutting out multiple banking intermediaries, CBDCs reduce costs for exporters and importers. This is particularly beneficial for small and medium enterprises (SMEs) in emerging markets, who often face the brunt of high fees.
2.3 Enhanced Transparency
With digital ledgers, every trade payment becomes traceable. This reduces corruption, black-market transactions, and money laundering. Governments can monitor international flows with precision.
2.4 Smarter Contracts
CBDCs could integrate with smart contracts — digital agreements that automatically execute when conditions are met. Imagine a shipment of coffee beans from Ethiopia: the CBDC payment could be released instantly once sensors confirm delivery at the port.
2.5 Financial Inclusion
Millions of unbanked traders and businesses in Africa, Asia, and Latin America could access international markets more easily through CBDC-enabled wallets, bypassing traditional banks.
3. Risks and Challenges of CBDCs in Trade
Despite the opportunities, CBDCs also bring significant risks.
3.1 Technology and Cybersecurity Risks
CBDCs will rely on advanced digital infrastructure. Cyberattacks on a CBDC system could paralyze trade flows or create financial chaos. If hackers compromise a major CBDC like the Digital Yuan or Digital Dollar, the ripple effect could be catastrophic.
3.2 Loss of Privacy
While CBDCs enhance transparency, they also give governments unprecedented surveillance powers. Every transaction can be tracked, raising concerns over trade confidentiality. Companies may hesitate to reveal sensitive financial data to foreign governments.
3.3 Geopolitical Fragmentation
Instead of unifying global payments, CBDCs might fragment them into competing blocs. For example:
China may push the Digital Yuan for Belt & Road trade.
The U.S. may push a Digital Dollar.
Europe may push the Digital Euro.
This could create currency blocs that compete for dominance, rather than seamless global integration.
3.4 Impact on Dollar Dominance
The U.S. dollar currently accounts for nearly 90% of global trade settlements. CBDCs might erode this dominance if countries start trading in their local CBDCs. While this reduces U.S. hegemony, it also risks creating currency volatility and trade inefficiencies.
3.5 Adoption Barriers
Not all nations have the same level of digital infrastructure. Poorer nations might struggle to adopt CBDCs quickly, widening the gap between advanced and developing economies.
4. The Impact on Currencies and Global Power
CBDCs are not just a financial tool; they are a geopolitical weapon. Whoever sets the CBDC standards could influence the future of global trade.
4.1 China’s First-Mover Advantage
China is far ahead with its Digital Yuan (e-CNY). Already tested in international trade pilots with countries like the UAE, Thailand, and Hong Kong, it may soon challenge the dollar in Asian and African trade corridors.
For China, the Digital Yuan is a way to reduce reliance on the U.S. dollar and avoid dollar-based sanctions. For partner countries, it offers an alternative payment system outside U.S. influence.
4.2 U.S. Response with a Digital Dollar
The U.S. has been cautious, but it cannot ignore the risk of losing dollar dominance. A Digital Dollar would aim to maintain its role as the global reserve currency. However, the U.S. faces political resistance due to privacy and state-control concerns.
4.3 Europe and the Digital Euro
The EU wants a Digital Euro to protect European trade sovereignty. This ensures European exporters aren’t overly dependent on U.S. systems like SWIFT or Asian payment networks.
4.4 Emerging Economies
Countries like India, Brazil, and Nigeria could use CBDCs to boost trade competitiveness. By settling trade directly in local digital currencies, they reduce forex risks and dependency on dollar reserves.
4.5 Multipolar Currency World
The long-term outcome may be a multipolar world of currencies, where trade is settled in multiple CBDCs rather than a single dominant reserve. This could reduce systemic risks but increase complexity.
5. Future Scenarios for World Trade with CBDCs
To imagine the future, let’s consider three possible scenarios:
5.1 Optimistic Scenario – Seamless Global CBDC Network
Countries agree on common standards for CBDCs.
Interoperability allows instant settlement between different CBDCs.
Costs drop, trade volumes soar, and SMEs globally benefit.
The dollar remains important but shares space with the Digital Yuan, Euro, and Rupee.
Transparency reduces fraud, boosting trust in trade.
This is the “global digital Bretton Woods 2.0” scenario — cooperation over competition.
5.2 Competitive Scenario – Currency Blocs and Rivalries
The U.S., China, and EU push their CBDCs, creating separate trade zones.
Global trade fragments, with Asia leaning on the Digital Yuan, the West on the Digital Dollar/Euro.
Smaller economies must choose sides, leading to geopolitical tensions.
Efficiency improves regionally but not globally.
This is the “Digital Cold War” scenario.
5.3 Risk Scenario – Fragmentation and Disruption
Lack of standardization makes cross-CBDC payments cumbersome.
Cyberattacks shake trust in CBDCs.
Dollar dominance weakens but no single CBDC replaces it, leading to volatility.
Trade costs rise instead of falling, hitting emerging economies hardest.
This is the “chaotic fragmentation” scenario.
6. Case Studies and Pilots
6.1 m-CBDC Bridge (China, UAE, Thailand, Hong Kong, BIS)
A real-world pilot enabling cross-border trade settlements via multiple CBDCs. Early results show faster, cheaper, and more secure payments compared to traditional banking.
6.2 India’s Digital Rupee
India has begun pilots of its retail and wholesale CBDCs. In the future, the Digital Rupee could play a huge role in South Asian trade, especially in energy and manufacturing supply chains.
6.3 Nigeria’s eNaira
Africa’s first CBDC, though adoption is slow. If scaled, it could support intra-African trade under the African Continental Free Trade Area (AfCFTA).
7. The Road Ahead – Key Requirements
For CBDCs to truly shape the future of trade, several things must happen:
Interoperability Standards: Just like SWIFT enabled global messaging, we need a global CBDC network.
Cybersecurity Frameworks: Robust protection against hacking and financial warfare.
Balancing Transparency and Privacy: Trade partners must trust that their data isn’t misused.
Global Governance: Institutions like the IMF, BIS, and WTO may play roles in setting rules.
Inclusive Access: Ensure developing nations aren’t left behind.
Conclusion
CBDCs represent the most significant innovation in money since the invention of paper currency. For world trade, they offer a future of speed, lower costs, transparency, and inclusion. However, they also pose risks of cyber insecurity, surveillance, and geopolitical fragmentation.
The future of trade with CBDCs will not be decided by technology alone but by political cooperation, global governance, and strategic choices made by the world’s leading economies.
If done right, CBDCs could usher in a new era of frictionless, fair, and inclusive trade, reducing reliance on the dollar and creating a multipolar currency world. If done poorly, they could create new divisions, power struggles, and systemic risks.
The choice before us is clear: Will CBDCs become a tool for global cooperation, or another weapon in the geopolitical rivalry? The answer will define the future of world trade in the 21st century.

WARNING S&P 500, upper bound of bullish channel reached!Is the US stock market in a speculative bubble? Is the S&P 500 index and the S&P 500 futures contract approaching a major market top as the Fed’s new monetary trajectory has sustained the bullish move initiated last April?
This question is on investors’ minds as they ride the bullish trend in place for many months, and logically, one must be on the lookout for technical exhaustion signals to protect invested capital.
We will answer this question using technical analysis of financial markets with chartist and quantitative aspects.
1. Warning: the S&P 500 index and futures have reached the upper bound of their long-term bullish channel, but no bearish divergence yet
In technical analysis, several combined factors are needed to anticipate a major market top. The combination of a major technical resistance with a price/momentum bearish divergence is particularly effective.
The chart below shows the weekly candlesticks of the S&P 500 index: after rebounding in early April at the lower bound of its long-term bullish channel, the index has now reached the upper bound at 6700 points.
However, there is currently no price/momentum bearish divergence. Nevertheless, the strong technical resistance at 6700 could trigger profit-taking.
2. The Russell 2000 index, US small caps, has reached its all-time high from late 2021
In the short term, the Russell 2000 could also pause as it is testing its record high, but this resistance may be broken this autumn thanks to the Fed’s monetary pivot.
The chart below shows the weekly candlesticks of the Russell 2000 index.
3. From a quantitative perspective, S&P 500 stocks are not yet in an extreme overheating zone
Thus, 6700 points represent major resistance for the S&P 500, which could enter a short-term consolidation phase. However, the long-term bullish trend does not seem threatened, since the market is not in an extreme overheating zone from a quantitative perspective, as shown below by the percentage of S&P 500 stocks above the 50-day simple moving average.
DISCLAIMER:
This content is intended for individuals who are familiar with financial markets and instruments and is for information purposes only. The presented idea (including market commentary, market data and observations) is not a work product of any research department of Swissquote or its affiliates. This material is intended to highlight market action and does not constitute investment, legal or tax advice. If you are a retail investor or lack experience in trading complex financial products, it is advisable to seek professional advice from licensed advisor before making any financial decisions.
This content is not intended to manipulate the market or encourage any specific financial behavior.
Swissquote makes no representation or warranty as to the quality, completeness, accuracy, comprehensiveness or non-infringement of such content. The views expressed are those of the consultant and are provided for educational purposes only. Any information provided relating to a product or market should not be construed as recommending an investment strategy or transaction. Past performance is not a guarantee of future results.
Swissquote and its employees and representatives shall in no event be held liable for any damages or losses arising directly or indirectly from decisions made on the basis of this content.
The use of any third-party brands or trademarks is for information only and does not imply endorsement by Swissquote, or that the trademark owner has authorised Swissquote to promote its products or services.
Swissquote is the marketing brand for the activities of Swissquote Bank Ltd (Switzerland) regulated by FINMA, Swissquote Capital Markets Limited regulated by CySEC (Cyprus), Swissquote Bank Europe SA (Luxembourg) regulated by the CSSF, Swissquote Ltd (UK) regulated by the FCA, Swissquote Financial Services (Malta) Ltd regulated by the Malta Financial Services Authority, Swissquote MEA Ltd. (UAE) regulated by the Dubai Financial Services Authority, Swissquote Pte Ltd (Singapore) regulated by the Monetary Authority of Singapore, Swissquote Asia Limited (Hong Kong) licensed by the Hong Kong Securities and Futures Commission (SFC) and Swissquote South Africa (Pty) Ltd supervised by the FSCA.
Products and services of Swissquote are only intended for those permitted to receive them under local law.
All investments carry a degree of risk. The risk of loss in trading or holding financial instruments can be substantial. The value of financial instruments, including but not limited to stocks, bonds, cryptocurrencies, and other assets, can fluctuate both upwards and downwards. There is a significant risk of financial loss when buying, selling, holding, staking, or investing in these instruments. SQBE makes no recommendations regarding any specific investment, transaction, or the use of any particular investment strategy.
CFDs are complex instruments and come with a high risk of losing money rapidly due to leverage. The vast majority of retail client accounts suffer capital losses when trading in CFDs. You should consider whether you understand how CFDs work and whether you can afford to take the high risk of losing your money.
Digital Assets are unregulated in most countries and consumer protection rules may not apply. As highly volatile speculative investments, Digital Assets are not suitable for investors without a high-risk tolerance. Make sure you understand each Digital Asset before you trade.
Cryptocurrencies are not considered legal tender in some jurisdictions and are subject to regulatory uncertainties.
The use of Internet-based systems can involve high risks, including, but not limited to, fraud, cyber-attacks, network and communication failures, as well as identity theft and phishing attacks related to crypto-assets.
