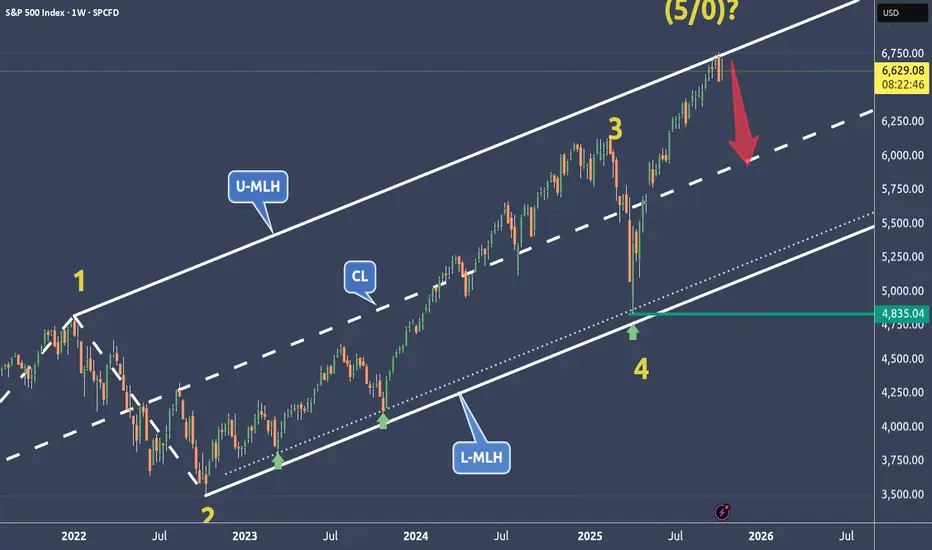
SPX is weakening at a very dangerous price level🔱 SPX is at a very dangerous price level ⚠️
...right at the Upper Median Line Parallel.
💰 If this market turns, the Centerline becomes the next target.
The 0-5 Count is also a good indication when prices start to turn at these extreme levels.
⚠️ Stay sharp — momentum is fading.
I wish you all a relaxing weekend.
Trade ideas
SP500: Breaks Out Of Channel, Steps Into Wave Four I hope you had a nice weekend despite that nasty turn lower on stocks we saw on Friday. As you know, the move came after Trump threatened to impose new tariffs on China, following China’s own restrictions and tighter export controls on rare earth metals, which are crucial for the tech sector. We’ve seen this story before back in April, and if tariffs come back into focus again, traders will likely react with fear — so it’s not a surprise we saw such a strong drop in stocks on Friday.
Normally, markets are most sensitive when this kind of news first hits, and then they tend to stabilize afterward. What’s interesting, though, is that despite the strong sell-off in stocks, the dollar index didn’t show the kind of sharp upside reaction you’d usually expect. So I’m wondering if stocks can find some support, but seems like this can be only wave B rally, since we are in the middle of wave four retracement. Keep in mind there is an open gap lower on futures.
Big supports is at 6400 and 6200.
Grega
Is SPX indicating a breakdown The SPX is trading below its trendline on the daily chart , with increasing volume .
All signs of a breakdown.

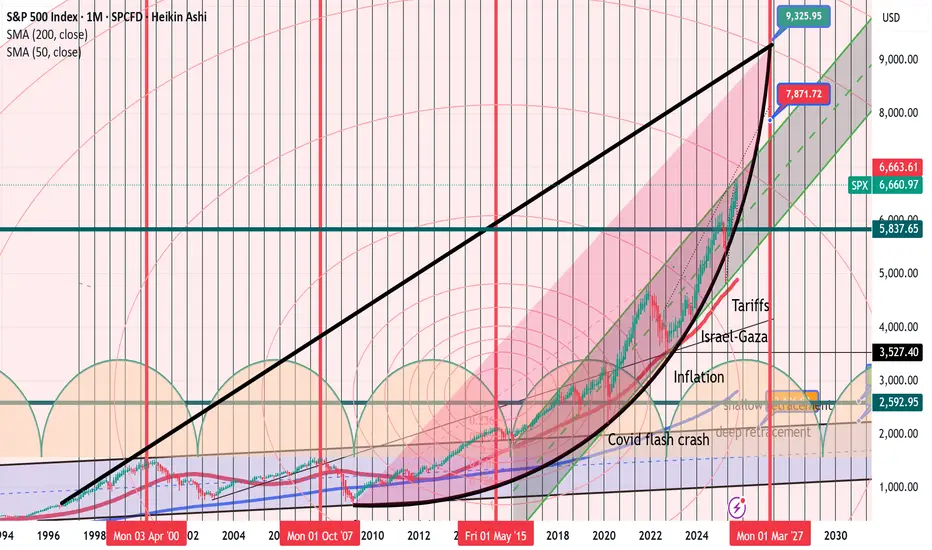
Small fish follow the streamUpdate: My best case scenario. 9000 points in a massive bull run that started in 2009. Hyperbolic move since then.
Top in March 2027
SPXShift prediction to the right a bit. I think almost everyone in these markets are waiting to sell.... I'm thinking if SPX closes below $6650 today, that will give the signal the wolves are looking for.
Still anticipating brief freefall on crypto ~1 week and brief correction on stocks ~1 month.
Short timeframe, but huge drop. Good luck.
SPX – Correction Scenarios#SPX – Correction Scenarios
The S&P 500 is entering a corrective phase after completing a full 5-wave impulse.
Current price: 6,654
Main focus: potential retracement between 6,350–6,150 pts
Technical Context
• The index reached the 2.618 Fibonacci extension (≈6,520) — typical for the final wave 5.
• RSI divergence + trendline break confirm exhaustion.
• Structure now shifts into ABC correction, possibly extending into wave (4) or a larger degree A-wave.
Correction Scenarios
1️⃣ Shallow pullback (yellow path)
• Target: 6,600–6,530 (0.236 Fib)
• Structure: quick ABC with limited downside — “wave 4 inside 5.”
• Bias: short-term profit-taking only.
• Probability: High, if Fed remains neutral and earnings stay solid.
2️⃣ Standard correction (purple path)
• Target: 6,350 (0.382 Fib / Pivot)
• Structure: classic A-B-C retracement after trend extension.
• Represents healthy market cooling without trend reversal.
• Probability: Base case / Most likely.
3️⃣ Deeper correction (white path)
• Target: 6,150 (0.5 Fib / EMA 200 zone)
• Structure: larger A-B-C completing wave (4).
• Often precedes a strong new impulse (wave 5 of higher degree).
• Probability: Moderate, triggered by weaker Q3 data or tighter Fed tone.
4️⃣ Extended correction (cyan path)
• Target: 6,030–5,800 (0.618–0.786 Fib)
• Structure: deeper W-X-Y or expanded flat, washing out late longs.
• Long-term accumulation zone.
• Probability: Low, but key for long-term investors.
📌 Summary
• SPX likely transitions into a corrective ABC structure.
• Primary support area: 6,350–6,150.
• Only a break below 6,000 would confirm a broader trend reversal.
• Until then, overall bias stays medium-term bullish — correction before continuation.

SPX500 | HULL MA & Fibo Confluence Setting Up the Move!🎯 SPX500: The "Polite Thief" Strategy - Stealing Profits Like a Gentleman 🎩💰
📊 Market Overview
Asset: SPX500 (S&P 500 Index CFD)
Trade Type: Swing/Day Trade Opportunity
Bias: Bullish 🐂
Strategy Style: Multi-Layer Entry (The "Thief Method")
🔍 Technical Setup
The Plan: We're eyeing a bullish confirmation with a clean retest/pullback at the 38.2% Fibonacci level, aligned beautifully with our HULL Moving Average. This confluence zone is screaming "buy the dip" louder than your portfolio manager at a market crash! 📈
🎯 Entry Strategy Options:
Option 1: The "Polite Thief" Multi-Layer Approach
Instead of going all-in like it's a Vegas buffet, we're using calculated limit orders:
📍 Layer 1: 6620
📍 Layer 2: 6640
📍 Layer 3: 6660
📍 Layer 4: 6680
Feel free to add more layers based on your account size and risk appetite!
Option 2: Market Execution
Jump in at any current price level if the setup confirms during live hours.
🛡️ Risk Management
Stop Loss: 6580
⚠️ Disclaimer: Dear Ladies & Gentlemen (Thief OG's), this is MY stop loss based on MY analysis. You're the captain of your own ship! 🚢 Set your risk parameters according to YOUR comfort level and account size. Risk management is YOUR responsibility.
💎 Profit Target
Target Zone: 6860
This level represents our "Electric Shock Wall" 🔌⚡ - a confluence of:
Strong historical resistance
Overbought territory potential
Bull trap zone (where late entries get caught)
Exit Strategy Note: I'm not your financial advisor! 💼 When you see green, secure those gains at YOUR discretion. The market doesn't care about our targets - take profit when YOU feel comfortable!
🌐 Related Pairs to Watch
Keep your eyes on these correlated instruments:
📈 AMEX:SPY (S&P 500 ETF) - Moves in lockstep with SPX500; watch for volume confirmation
📈 NASDAQ:QQQ (Nasdaq-100 ETF) - Tech-heavy index; bullish momentum here supports SPX strength
📈 AMEX:DIA (Dow Jones ETF) - Broader market sentiment indicator
📈 TVC:VIX (Volatility Index) - Inverse correlation; falling VIX = bullish for equities
💵 TVC:DXY (US Dollar Index) - Typically inverse to equities; weakening dollar supports stocks
Key Correlation: When tech leads (QQQ pumping), SPX usually follows. Watch for VIX to stay subdued below 15 for sustained bullish momentum.
📝 Key Technical Points
✅ 38.2% Fibonacci retracement acting as dynamic support
✅ HULL Moving Average confluence strengthens the setup
✅ Multi-layer entry reduces average cost and timing risk
✅ Clear risk/reward structure with defined zones
✅ Resistance zone identified for disciplined exits
⚡ The "Thief Strategy" Philosophy
We're not robbing the market - we're borrowing profits with permission! 😉 The layered entry approach allows us to build positions like a professional, not gamble like a reckless amateur. Scale in, scale out, and live to trade another day!
✨ If you find value in my analysis, a 👍 and 🚀 boost is much appreciated — it helps me share more setups with the community!
⚠️ Final Disclaimer
IMPORTANT: This "Thief Style" trading strategy is for educational and entertainment purposes only! 🎪 This is NOT financial advice. I'm sharing my personal analysis and trade ideas - what you do with your money is 100% YOUR decision. Trade at your own risk, manage your own capital, and never risk more than you can afford to lose. Past performance doesn't guarantee future results. Always do your own research! 🔍
#SPX500 #SP500 #TradingIdeas #SwingTrading #DayTrading #TechnicalAnalysis #FibonacciRetracement #SupportAndResistance #RiskManagement #TradingStrategy #StockMarket #IndexTrading #ThiefStrategy #LayeredEntry #PriceAction #MarketAnalysis #TradingCommunity #ChartAnalysis

Hellena | SPX500 (4H): SHORT to support area of 6646 .Colleagues, in the last forecast I was counting on price reaching the 6550 area, but that plan turned out to be a long term plan. I see the sense in making some shorter term targets.
The closest target I see is the 6646 support area, where wave “4” ends. This is a corrective movement, so it is necessary to realize that the price may continue to fall after reaching the target.
Fundamental context
U.S. inflation remains elevated — CPI rose to about 2.9 % YoY, with core inflation around 3.1 %. At the same time, the labor market continues to cool, and corporate earnings show mixed results. Combined with the Fed’s cautious stance and ongoing fiscal uncertainty, this creates pressure on the stock market.
Manage your capital correctly and competently! Only enter trades based on reliable patterns!

SPX500 NEW HIGHSThis picture includes the 50 day moving average. In addition to Static Sq9 support at 6602, keep an eye on the 50dma at 6549. A close below the 50dma will get the attention of a lot of traders. Once the SPX closes below the 50dma, look for a waterfall decline as traders and investors start to panic.

S&P 500 The Bull Run Is Over. Watch the Yellow Level.The S&P 500 rally looks exhausted.
Over the past week, momentum has clearly faded, lower highs, weaker daily closes, and stronger selling pressure on each bounce.
Technically, the market shows early signs of a shift from bullish to corrective or bearish.
The Yellow Level acts as a divider between a mildly bullish market and the start of a medium-term bearish phase.
Above the Yellow Level: price may hold short-term strength or consolidation.
Below the Yellow Level: structure breaks down and downside potential expands.
A daily close below the Yellow Level would confirm the beginning of a broader bearish move.
In my view i suggest all the Trader/Investor which they are reading this to stay AT LEAST 80/90% IN CASH. something is about to happen... stay safe!

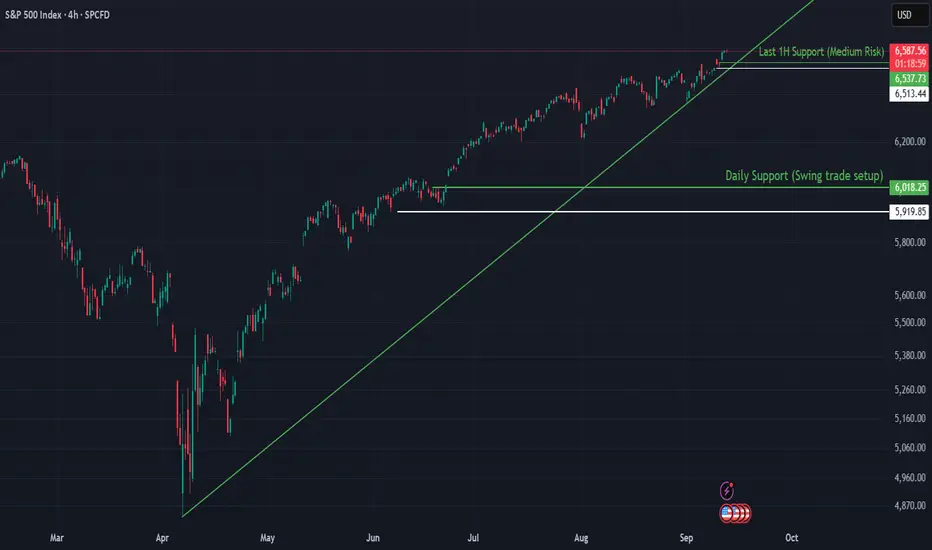
SPX Supported by Trendline and Rate Cut ExpectationsThe S&P 500 has been climbing steadily, with the ascending trendline from April acting as a reliable backbone for the move. Despite short-term volatility, buyers continue to defend higher lows. Coupled with expectations of interest rate cuts, the trend structure remains intact unless key supports give way.
🔍 Technical Analysis
Current price: 6,584
The green trendline (since April) is guiding the advance.
Price is consolidating near highs, supported by demand zones underneath.
🛡️ Support Zones & Stop-Loss (White Lines):
🟢 6,537 – 1H Support (Medium Risk)
First line of defense for short-term traders.
Stop-loss: Below 6,513
🟡 6,018 – Daily Support (Swing Trade Setup)
Stronger base for medium-term positioning.
Stop-loss: Below 5,919
🧭 Outlook
Bullish Case: Hold above 6,537 + April trendline intact → continuation toward new highs above 6,600–6,700.
Bearish Case: Break below 6,537 could trigger a correction into 6,018. Losing that zone would weaken the April trendline structure.
Bias: Bullish while April trendline holds.
🌍 Fundamental Insight
Rate cut expectations continue to provide a macro tailwind for equities. With inflation moderating and yields easing, investors remain willing to support risk assets. A sudden shift in data or Fed tone, however, could test the resilience of the April trendline.
✅ Conclusion
The S&P 500 remains in a strong bullish structure, anchored by the April trendline. Unless supports at 6,537 or 6,018 are lost, the path of least resistance remains higher.
If you found this useful, please don’t forget to like and follow for more structure-based insights.
⚠️ Disclaimer
This analysis is for educational purposes only and does not constitute financial, investment, or trading advice.
SPX500 Long From Support!
HI,Traders !
#SPX500 made a retest
Of the wide horizontal
Support level of 6581.19
And a local rebound is
Already taking place so
We are bullish baised
And we think that a local
Bullish correction is to
Be expected !
Comment and subscribe to help us grow !

S&P 500 testing resistance after bouncing off lowsMarkets recovered sharply from their earlier lows on the back of comments from US Trade Representative Jamieson Greer, who told CNBC that Donald Trump was still set to meet Chinese premier Xi Jinping. But it remains to be seen whether the US and China will come to some sort of an agreement, perhaps an extension of the tariff truce. That scenario looks more likely than a complete breakdown into a full-blown trade war. However, the risks are undeniably rising.
Anyway, the SPX500 is now testing key resistance here between 6648 to 6655, marked in yellow on the chart. Unless it goes on to make a higher high above 6677 on this hourly chart, and hold above it, there is still the risk we could see another dip as we head deeper in the US session.
By Fawad Razaqzada, market analyst with FOREX.com
October 13 - October 17 2025I decided to go through and consolidate my charts this week to make for easier decision making. Friday’s sell off was a sign of weakness in a market that was already showing strain. While the drop on resumed trade war threats was swift, the rest of the market had a muted response. Heading into this week, we should see another big move and I will try to be open to trading either side depending on how this develops.
1. Macro
Gold is still in its uptrend and that is unlikely to change anytime soon. I don’t have it charted here, but Gold’s volatility index CBOE:GVZ spiked during Friday’s session, however buyers seemed to be absorbing the volatility since it still closed up over 1%. Gold has already made a new ATH today and I do not expect to see the trend change this week.
The dollar TVC:DXY seems to be near the top of its deviation from the flat EMA. I think we will see the dollar move lower which could boost Gold, Stocks, or both. Next, we saw TVC:US03MY remain relatively flat during Friday’s sell off while TVC:US10Y moved sharply lower during the session, making the TVC:US10Y -US03MY spread very tight once again. Since real yields are still edging up and the 3M bond stayed flat during the panic, that leads me to believe the bond market volatility was contained and may not be indicative of a true risk-off reaction.
One reason why US Treasuries will continue to catch a bid is that as forward inflation expectations continue to slide (bottom left chart), the real return is still attractive compared to bonds from other major countries. We’ll see if the renewed trade sparring will change the forward inflation exceptions trend since the data from TIPS is delayed, however for now I’ll continue to base my perception on what I’m currently seeing on the chart.
Lastly, Oil is continuing to see an average decline. Hopefully middle eastern peace efforts are successful, which could keep the price subdued. On the bottom chart I have combined the average of MCX:COPPER1! and Corn CBOT:ZC1! into a single line compared to TVC:DXY , which aims to show real demand (and/or inflation) pressure against the Dollar’s relative strength. Here we can see commodities took a hit on Friday but the trend is still very strong to the upside. Since forward inflation expectations are down and the dollar is flat, this may be pointing to the presence of real demand, which should be bullish for equities.
2. Risk
Even when looking at the past six months on a line chart, the pullback, Friday’s drop was significant. As I mentioned last week, there are important risk-health items to watch for here. I’m now just charting the High Yield OAS - Investment Grade OAS spread, which was already starting to move up before Friday’s sell off. This data is only reported once per day for the previous session, so the impact on corporate bond yields is not yet known. This will be very important to pay attention to, as it could signal true aversion to risk.
Next, the $ES1!/GOLD spread is declining and should continue until Gold enters a re-accumulation phase. Anyone’s guess when that will be so for now I think it’s safe to assume that Stocks will continue to underperform Gold, and if Friday’s drop was any indication of which side is in control, it serves as confirmation that stocks are sensitive to bad news. Buyers seem to be the ones getting absorbed.
The third chart on the top shows that although CME_MINI:NQ1! has been outperforming CBOT_MINI:YM1! since the market bottomed, the momentum seems to be stalling out. I’ll be looking at the sectors to find any further signs of sustained rotation.
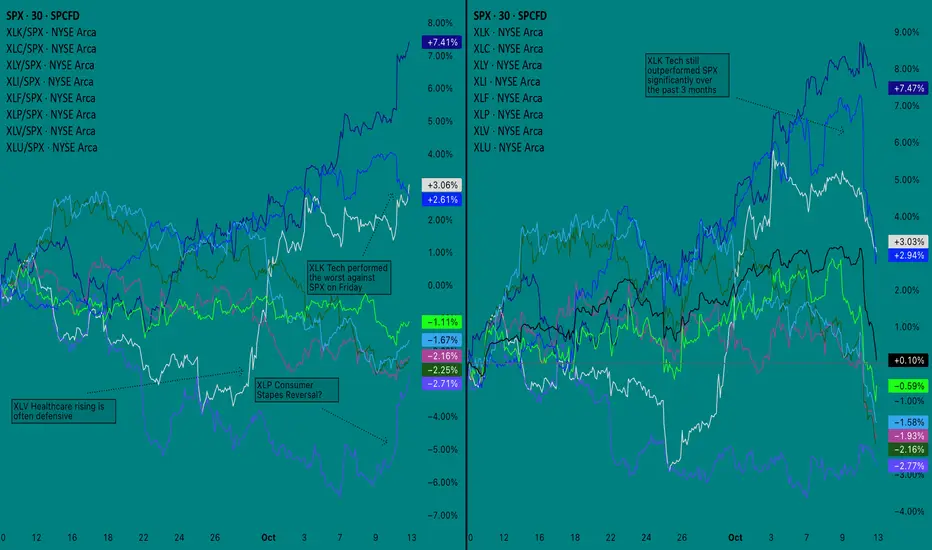
3. Sector Analysis
My notes are best explained in the screenshot but my comment is that most of the decline on Friday came from AMEX:XLK (Tech sector) selling off. Other sectors performed better against SPX, with AMEX:XLP (Consumer Staples) seemingly breaking out of a decline, however as you can see from the chart on the right, it has still been the worst performer against the other indices over the past three months.
One session is not enough to change the trend, however it will be important to watch for continued rotation out of tech and into other sectors. This could cause CME_MINI:NQ1! to decline against CBOT_MINI:YM1! as I suggested earlier, and would signal the market is positioning for a more sustained downturn - likely caused by disappointing growth.
4. Bias
This is the chart I have tried to condense the most. I have switched to just using Line Break as my main chart for ES, which I found performed better than Renko when combined with my other indicators. On the lefthand side, I am using Session CVD but got rid of my other indicators and made a CVD Momentum indicator, which tracks the momentum of CVD rising or falling over an anchor period (1 week). I’m still using a range chart calculation for this chart, currently set to 20R.
On the right, I am using what I’ll call my Volatility Dashboard, however it does not start producing a useful signal until premarket. Based on Volatility, it can be said with certainty that dealers went long on puts right before the sell-off began.
From a technical standpoint, the price was in a rising wedge and dumped after it made a higher high that did not reach the upper trend line. Rising channels are generally bullish, however the extent of Friday’s free fall could mean that even if the price quickly recovers, it may be forming a top similar to what we saw last December. This is why risk indicators like corporate bond spreads, sector performance, and changes to the macro structure will be important to monitor over the coming days.
—
Conclusion
For this week, all I can say with certainty is that I think there will be some good opportunities. Here is what I believe can be safely assessed from this analysis:
1. Stocks remain under pressure, however “smart money” will require more time to rotate out of tech, leading to repeated retests of the top of the range.
2. Tailwinds for stocks are potential real demand in agriculture and industrial material that is not impacting the market’s forward inflation expectation.
3. “Smart Money” will sell volatility (puts) into pullbacks if the price is set to be driven higher, or will do the opposite, buying volatility (puts) and selling calls on low volume rips
This is why I will be looking for more confirmation before taking a side, as the market’s goal now is to clear out liquidity. When it comes to the larger trend, I tend to think that stocks do not seem to be showing strength over the larger macro structure, however that does not necessarily dictate that the index will come down another 8%. Instead, I think at the very least we will stay in a flat range for the time being.
I do not think the market is ready to go on a bull run, nor do I think the environment is showing a risk-off bias that is strong enough to warrant stocks going straight down. If we meet resistance near the top of the range, I’ll look at volatility positioning and CVD for the signal to go short. Conversely, if we make a higher low I will go long on calls to the top of the range.
Good luck to all and thanks for reading!
Breakdown in SPX is a possibility Observation on SPX
1) Since 25TH April the SPX was bouncing on its 20 Ema . In fact if you bought every time SPX touched the 20 EMA you would have made money .
2) The 20 Ema acted as a support 6 times .
3) But notice the last three bounces were weaker and weaker .
4) 7 time the 20 Ema broke with increasing volume .
Conclusion the probability of a break down is very high almost 75%
SELL S&P 500from the price action point of view the S&P 500 is looking bearish. having been that the chart has formed a complete rising wedge. it liking to test and intra supoort level on 30H. of 6600.
#bearish #S&P500 #Fundamentalanalysis #technicalanalysis

Traders, Investors, and PolicymakersTheir Role in Global Trading.
Introduction
Global trading forms the backbone of the world economy. It connects nations through the exchange of goods, services, capital, and ideas, driving economic growth and innovation. Behind the seamless flow of trade, three critical groups shape its structure and direction — traders, investors, and policymakers. Each group plays a distinct but interconnected role in ensuring that global markets function efficiently, fairly, and sustainably.
Traders facilitate transactions and price discovery; investors allocate capital and influence long-term market trends; policymakers design the legal and institutional framework that governs trade and investment. Together, they create a dynamic balance between market forces and regulations, driving global economic progress.
1. The Role of Traders in Global Trading
1.1 Market Intermediaries and Price Discovery
Traders are the front-line participants in global markets. Their primary function is to buy and sell goods, commodities, currencies, and financial instruments across borders. Through their actions, traders facilitate price discovery — the process by which the value of an asset is determined based on supply and demand.
In global markets, traders operate in multiple forms:
Commodity traders, dealing in oil, metals, agricultural products, etc.
Currency traders (forex traders), influencing exchange rates and liquidity.
Equity and derivatives traders, focusing on stocks, bonds, and financial contracts.
By responding quickly to changing market conditions — such as geopolitical tensions, inflation data, or production shifts — traders ensure that prices reflect real-time global realities. This continuous activity keeps markets liquid and efficient.
1.2 Risk Management and Hedging
Global trade is inherently risky. Prices of commodities and currencies fluctuate constantly due to factors like weather, politics, and global demand. Traders play a critical role in risk management by using derivatives instruments such as futures, options, and swaps.
For example:
An oil producer may hedge future prices by selling crude oil futures contracts.
An importer may buy currency futures to protect against exchange rate volatility.
Such hedging activities stabilize revenues and costs, making international trade more predictable. Traders thus act not merely as profit seekers but also as risk absorbers, helping firms and economies manage uncertainty.
1.3 Liquidity Creation and Market Efficiency
One of the most important functions traders perform is liquidity creation. By continuously buying and selling, they ensure that there is always a counterparty for market participants wanting to enter or exit a trade. Liquidity enhances market efficiency, reducing transaction costs and narrowing bid-ask spreads.
In global markets, high-frequency trading firms, market makers, and institutional traders provide the bulk of this liquidity. Their algorithms process information in microseconds, reacting to changes across global exchanges — from New York to London to Tokyo — creating an interconnected trading ecosystem.
1.4 Speculation and Price Stabilization
While speculation is often criticized, it plays a vital role in price stability. Speculators take positions based on their forecasts of market movements, which often correct price distortions caused by temporary imbalances in supply and demand.
For instance, if a drought threatens wheat production, speculators may buy wheat futures, pushing prices up early. This incentivizes farmers to produce more and consumers to conserve, helping balance the market over time. Thus, traders indirectly contribute to long-term equilibrium through their speculative actions.
2. The Role of Investors in Global Trading
2.1 Capital Allocation and Global Growth
Investors — including individuals, institutions, and sovereign wealth funds — play a foundational role by providing the capital that fuels global trade and development. Their investment decisions determine which countries, industries, and companies receive funding to expand production, improve infrastructure, and innovate.
Foreign Direct Investment (FDI), portfolio investment, and venture capital flows are all forms of global investment that bridge financial gaps between nations. For developing economies, such inflows bring not just capital but also technology, expertise, and access to international markets.
For example, investors in emerging markets like India or Vietnam help create factories, logistics hubs, and export-oriented industries that become integral parts of the global supply chain.
2.2 Long-Term Stability and Confidence
While traders focus on short-term movements, investors typically adopt a long-term outlook. Their steady commitment provides stability and confidence to global markets. Institutional investors like pension funds, mutual funds, and insurance companies deploy capital over years or decades, allowing businesses to plan for sustainable growth.
Moreover, investors’ willingness to hold assets across economic cycles smooths out market volatility and helps economies recover from downturns. For instance, during global recessions, sovereign and institutional investors often continue to fund key projects, preventing total collapse in economic activity.
2.3 Portfolio Diversification and Global Integration
Global investors diversify across countries and asset classes to spread risk and enhance returns. This diversification links markets together — a movement in one region can now affect investment sentiment worldwide.
For example:
A slowdown in China can influence global commodity prices and stock markets.
A rise in U.S. interest rates can trigger capital outflows from emerging markets.
Thus, global investors not only connect financial systems but also transmit economic signals, influencing policymaking and business strategies worldwide.
2.4 Corporate Governance and Ethical Standards
Investors today increasingly focus on Environmental, Social, and Governance (ESG) principles. By choosing where to allocate capital, they exert influence over corporate behavior, encouraging transparency, sustainability, and ethical conduct.
Large institutional investors such as BlackRock or Norway’s sovereign wealth fund use their ownership stakes to push companies toward sustainable practices. In this way, investors act as guardians of global corporate responsibility, ensuring that profits are balanced with long-term social and environmental well-being.
3. The Role of Policymakers in Global Trading
3.1 Creating a Legal and Regulatory Framework
Policymakers — including governments, central banks, and international organizations — set the rules of the global trading system. Their policies determine tariffs, taxes, capital controls, interest rates, and trade agreements.
Without effective policymaking, global markets could descend into chaos. Laws governing intellectual property, labor rights, dispute resolution, and customs procedures ensure fairness and predictability. Institutions such as the World Trade Organization (WTO), International Monetary Fund (IMF), and World Bank coordinate policies among nations to maintain a level playing field.
3.2 Trade Agreements and Economic Diplomacy
One of the key policymaking roles is negotiating trade agreements that define how countries exchange goods and services. Bilateral and multilateral pacts such as the European Union (EU), North American Free Trade Agreement (NAFTA), or Regional Comprehensive Economic Partnership (RCEP) facilitate cross-border commerce.
Through diplomacy, policymakers open new markets, remove barriers, and harmonize standards. These agreements also provide dispute-resolution mechanisms that reduce uncertainty for traders and investors, making global trade smoother and more predictable.
3.3 Monetary and Fiscal Policies
Global trading is deeply influenced by monetary and fiscal policies. Central banks manage interest rates, currency supply, and inflation — all of which affect exchange rates and investment flows. For example:
When the U.S. Federal Reserve raises interest rates, the U.S. dollar strengthens, making imports cheaper and exports less competitive.
Fiscal policies like tax incentives or export subsidies can promote certain industries, shaping trade patterns.
Policymakers must balance domestic goals (such as employment and inflation control) with global competitiveness, ensuring their economies remain resilient in a fluctuating global environment.
3.4 Crisis Management and Market Stabilization
During periods of global crisis — such as financial collapses, pandemics, or wars — policymakers play a stabilizing role. They coordinate interventions like stimulus packages, bailouts, and monetary easing to restore confidence and liquidity in markets.
For instance, during the 2008 global financial crisis, coordinated actions by central banks and governments prevented a deeper economic collapse. Similarly, during the COVID-19 pandemic, massive fiscal and monetary responses helped maintain global trade flows and investment levels despite severe disruptions.
4. Interconnection Between Traders, Investors, and Policymakers
4.1 A Symbiotic Relationship
While their roles differ, traders, investors, and policymakers form a mutually dependent ecosystem.
Traders provide liquidity and efficiency that attract investors.
Investors supply the capital that drives global growth and trade volume.
Policymakers set the structure within which both can operate securely.
For example, a trader may profit from short-term movements created by new policy announcements, while investors adjust long-term strategies based on those same signals. Policymakers, in turn, analyze market reactions to gauge the effectiveness of their decisions.
4.2 Feedback Loops and Global Impact
The actions of one group often influence the others in a feedback loop:
If policymakers tighten monetary policy, investors may withdraw funds, leading traders to adjust their positions.
If traders detect currency instability, policymakers may intervene to stabilize exchange rates.
Investor confidence, reflected in capital inflows or outflows, often guides future policy decisions.
This constant interplay ensures that global trade remains dynamic and adaptive, capable of responding to new challenges and opportunities.
5. Challenges and Future Outlook
5.1 Technological Disruption
The rise of AI-driven trading, blockchain, and digital currencies is reshaping the roles of traders and investors. Algorithms now execute billions of trades daily, while decentralized finance (DeFi) is bypassing traditional intermediaries. Policymakers are challenged to keep pace with this rapid innovation while ensuring transparency and stability.
5.2 Geopolitical Tensions and Protectionism
Trade wars, sanctions, and regional conflicts can disrupt global supply chains. Policymakers must balance national interests with global cooperation. Traders and investors, in turn, must adapt to shifting regulations, tariffs, and political risks — making flexibility and diversification more critical than ever.
5.3 Sustainable and Inclusive Growth
The global trading system is under pressure to become more sustainable and inclusive. Investors are pushing for green finance; policymakers are designing carbon-neutral trade policies; and traders are exploring ethical sourcing. The collaboration between these three groups will determine whether global trade can evolve into a system that benefits both people and the planet.
Conclusion
The story of global trading is not just about goods, currencies, or capital — it’s about the interaction of human decisions across borders and markets. Traders bring liquidity and efficiency; investors provide capital and confidence; and policymakers ensure order and fairness.
Together, they form the three pillars of the global economic structure. Their coordinated actions determine how wealth is created, distributed, and sustained across nations. In an era of technological transformation and geopolitical complexity, their collaboration will be essential for building a resilient, equitable, and sustainable global trading system.
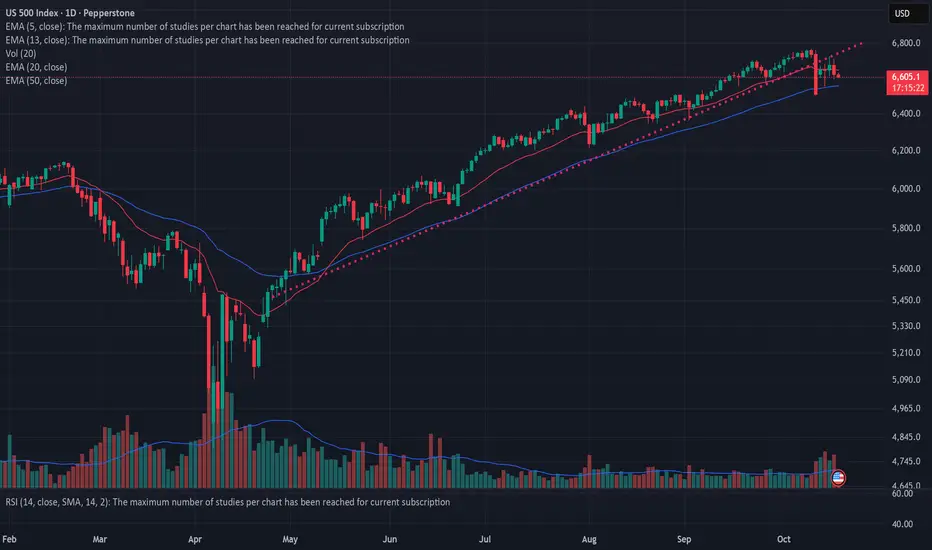
US500 OutlookFundamental Analysis
The US500 remains firmly supported by robust large-cap earnings and underlying resilience in the technology and consumer sectors. The index's significant one-year gain of 26% reflects strong corporate balance sheets and continued optimism for economic stability. Recent upward momentum is fueled by strong bank earnings and persistent hopes for Federal Reserve rate cuts. However, near-term sentiment is challenged by elevated volatility stemming from renewed US-China trade tensions and the ongoing government shutdown, alongside warnings that the market is "stretched" in valuation.
Technical Analysis
US 500 closed above 6,650, confirming a continued long term bullish momentum. However, short term technical sentiment is mixed as the index struggles to sustain rallies above its EMA21, which is acting as a cap. Immediate resistance is clustered near the recent all-time highs 6,765. Key support is identified at 6,600 down to the critical downside buffer at 6,550. A breach of the 6,550 support level could signal a definitive end to the current uptrend.
Analysis by Terence Hove, Senior Financial Markets Strategist at Exness

I can't believe nowbody saw this coming for crypto. S&P 500 Technical Analysis: Long-Term Channel Pattern
The S&P 500 has been trading within a well-defined ascending parallel channel for over 5 years. As shown in the chart, the index has consistently respected both the upper resistance and lower support trendlines of this channel throughout this period.
Current Market Position:
The index recently reached the upper boundary of this parallel channel around the 6,700-6,800 level and has begun to pull back. Historically, when the S&P 500 has tested this upper resistance line, it has typically reversed and moved toward the lower support trendline.
Key Observations:
Channel Behavior: The price action shows a clear pattern of rejection at the upper channel resistance, followed by moves back toward the middle or lower boundary of the channel.
Correlation with Crypto: When the S&P 500 experiences significant downward moves, risk assets like cryptocurrencies tend to follow suit, often with amplified volatility.
Potential Scenarios: While a retest of the upper resistance is possible, the more probable scenario based on historical channel behavior is a move toward the lower support line, which currently sits around the 5,200-5,400 range.
Risk Factors:
The current market environment faces additional headwinds, particularly concerns about an AI bubble. If sentiment shifts regarding AI valuations, this could accelerate the move toward channel support, as AI-related stocks have been significant drivers of the index's recent performance.
Conclusion:
Technical analysis suggests caution at current levels, with the channel's upper boundary acting as a natural resistance zone. Risk management and monitoring of support levels will be crucial in the coming weeks.

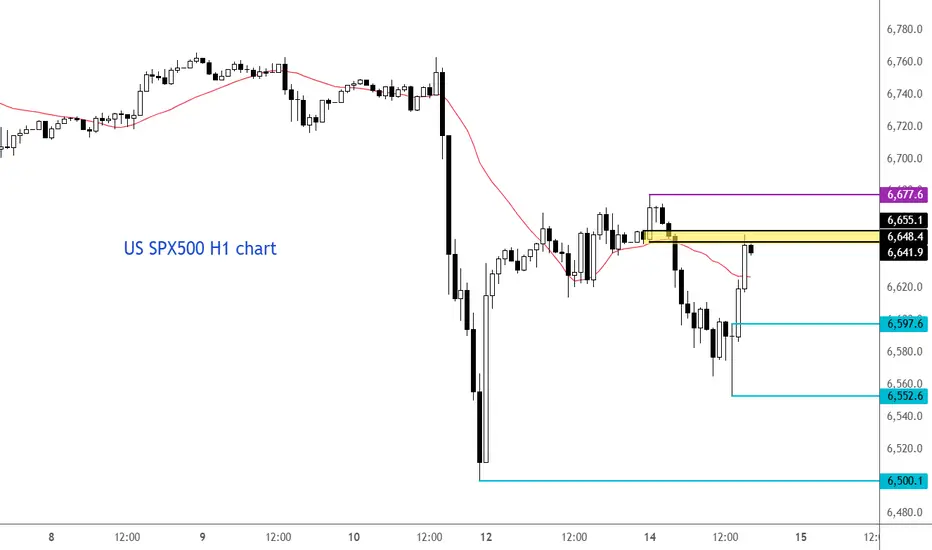
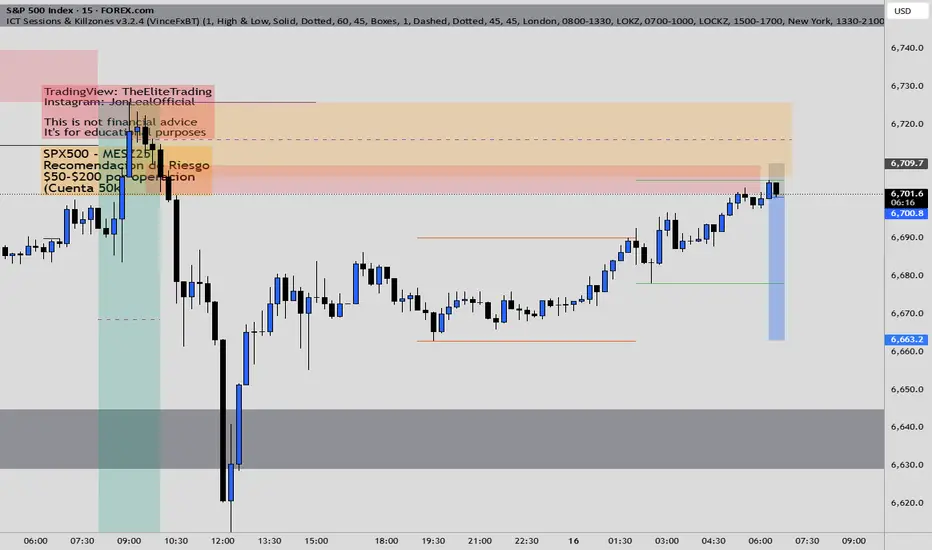
SPX 500 extends recovery as traders watch US-China situationAfter breaking above 6677 yesterday, the S&P 500 created a higher high on the intraday charts, and so today's gains were a continuation of that move. But the index has now arrived into the next potential resistance area between 6720-6740, which was a key short-term support zone before the breakdown we saw on Friday. Could we see some volatility around this zone now?
Risk appetite returned overnight, with US index futures climbing to new weekly highs, even though European markets showed a more mixed performance. In currencies, the US dollar index retreated against most major peers, surrendering part of its recent gains. Market sentiment this week reflects a cautious blend of optimism and restraint. Expectations for Federal Reserve rate cuts remain the key driver, underpinning risk appetite even as gold extends its record-breaking rally beyond $4,200.
Investors appear largely unfazed by renewed US–China trade tensions, brushing off President Trump’s latest warning on cooking oil imports. Meanwhile, solid US bank earnings have bolstered confidence in corporate resilience, keeping equities supported despite the ongoing US government shutdown. Adding to the upbeat tone this morning, French political tensions eased after Prime Minister Sébastien Lecornu announced a delay to his contentious pension reform plan.
But with the US-China tensions back at the forefront, could investors start taking profits on their long equity trades to cause a bit of selling pressure now?
by Fawad Razaqzada, market analyst with FOREX.com

US 500 Index – Limited Correction Or Sentiment Reversal?With all the talk in the financial press last week of a potential AI bubble, soaring volatility in the precious metals market, and an on-going US government shutdown, perhaps it was understandable that traders were a little on edge going into Friday. So, when President Trump’s new threats of 100% tariffs on China were posted on social media late in the afternoon the reaction was a big downside correction, which saw the US 500 drop around 3.6% from its all-time highs of 6769 seen just a day earlier to a low of 6508.
Since then, comments from President Trump and Vice President Vance over the weekend regarding China have seemed to be more conciliatory in tone, signalling an openness to get back to the negotiating table and hammer out a deal in some form. This has seen all markets breath a small sigh of relief and led the US 500 to open higher, currently trading up 2.2% around 6650 (0800 BST). However, whether this positivity continues may depend on multiple factors, including the technical outlook (more on this below).
While trader sensitivity to the next round of comments from the US and Chinese administrations regarding the on-going trade tensions could remain high, they may also be keen to receive the latest Q3 earnings from the major US banks, with JP Morgan, Goldman Sachs and Citigroup reporting on Tuesday (before the open), then Bank of America and Morgan Stanley reporting on Wednesday (before the open). While the focus may be on assessing actual performance against expectations, it could also be important to hear the outlook for future revenue, the direction of US economic growth and the size of bad debt provisions.
Federal Reserve Chairman Jerome Powell also speaks on Tuesday at 1720 BST and with the US government shutdown delaying the release of the most recent inflation updates (CPI/PPI) which were due this week until later in October, any comments he makes regarding the inflation outlook or the potential for an October Fed rate cut could take on extra significance.
Technical Update: Limited Correction or Sentiment Reversal?
Headline-driven price sell-offs like the one experienced on Friday (Oct 10th) are unpredictable, underscoring the importance of disciplined risk management. If you're long of an asset during such volatility, having well-placed stop-losses is crucial to limit downside exposure, especially when liquidity starts to reduce, as it likely did ahead of today’s US holiday. These events serve as a reminder that protecting your trading capital is just as important as delivering profitable outcomes.
After such a sharp sell-off, the question is whether it marks a brief, exaggerated correction within a broader uptrend or signals a deeper negative sentiment shift that could lead to further price weakness.
The answer may well depend on how the price of the US 500 reacts in the upcoming sessions. Whether support levels hold, momentum stabilises, and buyers return or whether the price decline deepens and the next support levels give way.
The jury may still be out on this, but as the chart above shows, judging the potential key support and resistance levels could help gauge the next directional risks. A closing break of either side may offer signals to the next phase of price activity.
If the Sell-Off Reflects a Negative Sentiment Shift:
Friday’s sharp decline may have already breached some initial support levels, raising the risk of a more extended phase of price weakness.
The daily Bollinger mid-average (currently 6668) is typically viewed by traders as a support level in an uptrend and this level was broken on a closing basis within Friday’s decline. Despite this morning’s rally, 6668 could now act as a resistance, and if it remains intact, could keep upside activity in check for now.
While 6668 resistance holds on a closing basis, this morning’s recovery may be viewed by some as a reactionary bounce following Friday’s sharp decline, leaving possibilities of renewed selling pressure later in the week.
If this proves to be the case, closing breaks below potential support at 6550, a level which is equal to half the rebound from Friday’s low, might lead to renewed downside pressure. This may open tests of 6490, the 50% retracement of the August 1st to October 9th rally, with a closing break below this level, suggesting scope for moves toward 6224 which is the 61.8% retracement.
If the Sell-Off Proves to be a Limited Correction:
While Friday’s decline was sharper and larger than any since the June 2025 lows, traders may now be watching whether current price strength can close back above the 6668 Bollinger mid-average.
While not a guarantee of renewed price strength, past declines since June 23rd 2025, have seen US 500 prices recover to close back above this line, leading to resumed attempts at upside strength. A closing break back above 6668 may once again open attempts to push to higher levels.
If confirmed, a break above resistance at 6668 may lead to further upside back toward 6769, which is the October 9th all-time high. Should this level give way, further strength may extend toward 6866, which is the 38.2% Fibonacci extension of last week’s sharp decline.
The material provided here has not been prepared accordance with legal requirements designed to promote the independence of investment research and as such is considered to be a marketing communication. Whilst it is not subject to any prohibition on dealing ahead of the dissemination of investment research, we will not seek to take any advantage before providing it to our clients.
Pepperstone doesn’t represent that the material provided here is accurate, current or complete, and therefore shouldn’t be relied upon as such. The information, whether from a third party or not, isn’t to be considered as a recommendation; or an offer to buy or sell; or the solicitation of an offer to buy or sell any security, financial product or instrument; or to participate in any particular trading strategy. It does not take into account readers’ financial situation or investment objectives. We advise any readers of this content to seek their own advice. Without the approval of Pepperstone, reproduction or redistribution of this information isn’t permitted.

