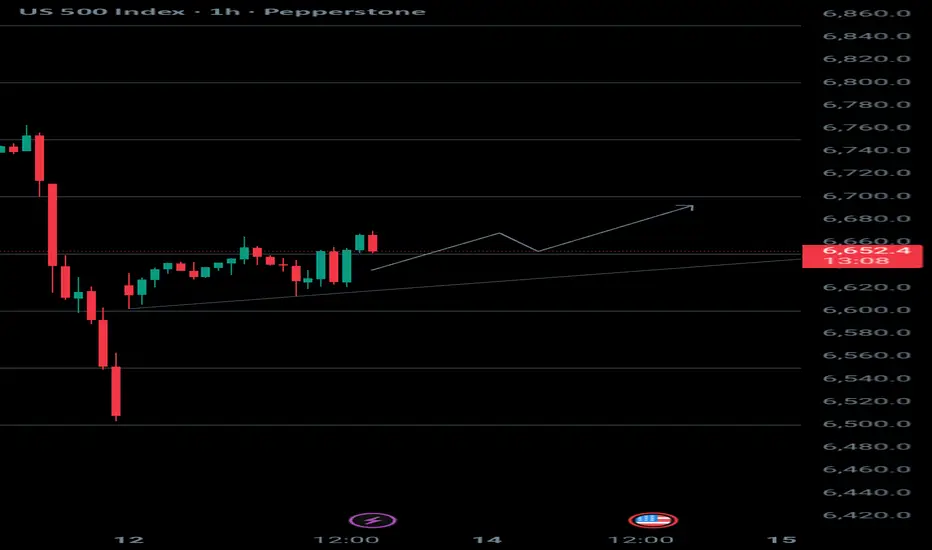
US 500The US 500 has just broken through the 6650 level again. After testing support and closing above it, the trend is to target the next level, 6700.
Trade ideas
S&P 500 (SPX) Simple Break Down The S&P (SPX) is sitting at a key turning point. Here’s what to watch for next:
If price drops below 6553, we could see it keep falling toward 6469 and if that breaks, then possibly down to around 6398.
But if price pushes above 6763, the next big target area could be 7237–7274.
So basically:
👉 Below 6553 = likely drop
👉 Above 6763 = likely climb
Right now, we’re in a tight spot where either direction could open up a strong move.
If you’re unsure how to trade around these levels or what kind of pullback makes sense, shoot me a quick DM
I can walk you through how I’m looking at setups and risk zones in plain English.
Mindbloome Exchange

Trump’s Decision Shakes Global Financial MarketsTrump’s Decision Shakes Global Financial Markets
On Friday, 10 October, President Trump made an unexpected statement about the possible introduction of 100% tariffs on Chinese goods, triggering sharp price swings across global markets:
→ Stock markets: The S&P 500 index tumbled by more than 3%, hitting its lowest level in over a month.
→ Currency markets: The US dollar slumped sharply against other major currencies.
However, on Sunday, Donald Trump softened his tone on Truth Social, suggesting that trade relations with Beijing “will be absolutely fine”. Vice President JD Vance echoed this sentiment, adding that the United States is ready for talks if China is “prepared to act reasonably”.
This shift in rhetoric from US officials helped markets recover, with the S&P 500 index rebounding sharply at Monday’s open, reclaiming much of Friday’s losses.
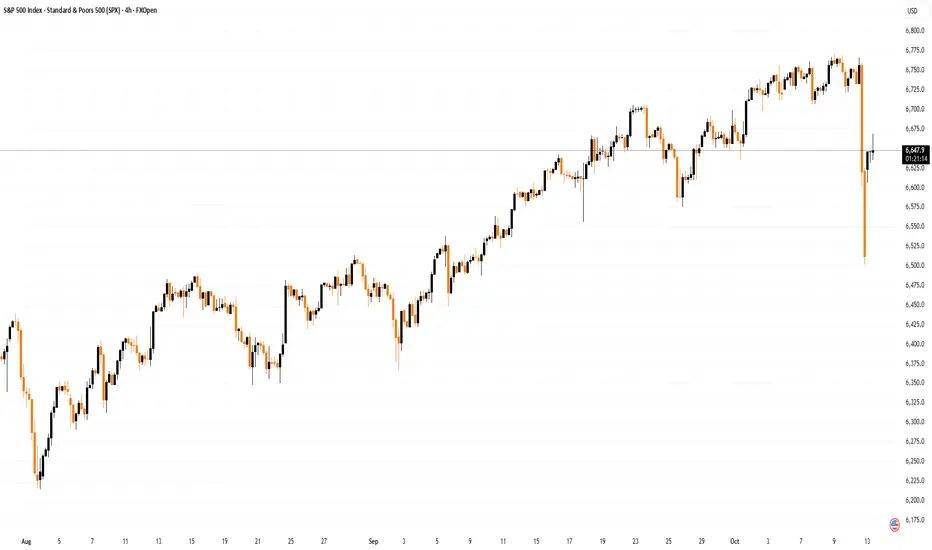
Technical Analysis of the S&P 500 Chart
In our previous analysis of the 4-hour S&P 500 chart (US SPX 500 mini on FXOpen) on 4 October, we identified an upward channel (shown in blue) and expressed several concerns:
→ The price was approaching the upper boundary of the channel, where long positions are often closed for profit.
→ The latest peak slightly exceeded the October high (A), suggesting a potential bearish divergence.
→ The news blackout caused by the government shutdown created an “information vacuum”, which could quickly turn sentiment negative if filled with adverse developments.
The lower boundary of the blue channel offered only temporary support near 6,644 points on Friday before the price broke downwards. Doubling the channel width provides a projected target near 6,500, which coincides with Friday’s low.
Given these factors, it can be assumed that the lower line of the blue channel now acts as the median of a broader range following Friday’s sell-off. This suggests that in the coming days, the S&P 500 index may stabilise as demand and supply find temporary balance along this line.
Looking further ahead, the situation may resemble that of early April, when after a panic-driven market drop (also triggered by Trump’s tariff comments), the S&P 500 not only fully recovered but went on to reach new highs.
Key Levels:
→ 6,705 – a level that has acted as both support and resistance this autumn;
→ 6,606 – the boundary of the bullish gap.
This article represents the opinion of the Companies operating under the FXOpen brand only. It is not to be construed as an offer, solicitation, or recommendation with respect to products and services provided by the Companies operating under the FXOpen brand, nor is it to be considered financial advice.
SPX: Tariffs 2.0 slams marketSPX stumbles as trade tensions resurface, feeding volatility into Friday's close. Friday was a painful day on financial markets, with a correction of 2,71%. For one more time it all started with the announcement on social networks of the US President that the US will impose 100% tariffs on imports from China starting November 1st. The rest is history - around $2 trillion from markets was wiped out. A similar situation occurred in April this year, when the never-ending story about tariffs started. Finally, the market settled that around 40% tariffs on imports from China would not impact the US economy at the higher level. However, analysts are estimating that the 100% tariffs might hurt the US economy more severely.
Semiconductor stocks like Nvidia and AMD led Friday’s market decline. Nvidia fell 5% amid uncertainty over its efforts to gain approval from the U.S. and China to sell downgraded AI chips. AMD, which had recently driven the tech rally, dropped nearly 8%. Apple and Tesla also saw sharp losses, down 3% and 5% respectively. However, the pullback wasn’t limited to China-exposed names, it was a broad-based sell-off, with 424 of the S&P 500 stocks closing in the red. The magnitude of the drop forced institutional investors to de-risk across the board, selling other positions to cover losses and raise cash as tech dragged portfolios lower. Only a few defensive names, including Walmart and tobacco-related stocks, managed to end the day slightly higher.
The current question is what does Monday bring? On one side, investors might continue to perceive tariffs impact negatively, so the correction might continue. On the opposite side are investors who will be in the mood of wait-and-see if a current threat of 100% tariffs will actually come to effect, or some sort of agreement on the state levels will be achieved.

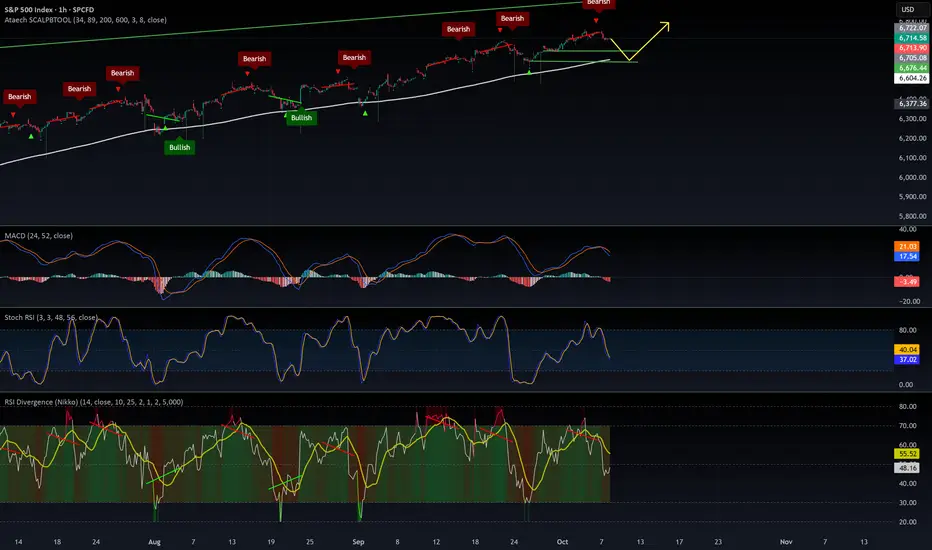
technical summary of your S&P 500 Index (SPX, 1-hour chart)Short-Term Bias: Bearish below 6,593.
Potential Bounce Zone: Between 6,468 – 6,527.
Trend Change Zone: Only if SPX reclaims 6,700+ with strong volume.
If selling pressure continues this month, 6,362 is your next high-probability support level for a possible rebound setup.

The next markets move will be agrresive, crypto will follow!SPX6300 then massive rally 5 months in a row, then crash to Trump's "buy now" low.
Nov-DEC-Jan-Feb-March will be green.
SPX | Daily Analysis #1Lets take a look at OANDA:SPX500USD at start of the Monday and being ready for the week.
Last Week:
well, as you may know last week was a struggle and flashy crashy market for all and at least about 80% of indexes was turning red in Friday amid US and China trade war escalation.
Start Of the Week:
Personally I think the market will open with huge gap in down side and flame the Fear factor for the start of Monday.
Horizon:
Well, during 2018-2019 trade war showed us that this romance not gonna end soon and this story will continue at least 3-6 months. And if any tension rises, the markets will shot again.
4H Time Frame:
As you can see, the index passed trough the latest Demand zone and heading to Supply zone. this area may good for some buyers to take action for catching or creating correction for Friday's move. if this will happen the price would go in $6580 area. and make some range towards 1st of November.
✔️ Personally, I’m waiting and observing for market re-action for THIS first day of market.

Here we go! The rally begins, ladies and gentlemenAccordding with TS: Don’t worry about China, it will all be fine! Highly respected President Xi just had a bad moment. He doesn’t want Depression for his country, and neither do I. The U.S.A. wants to help China, not hurt it!!! President DJT

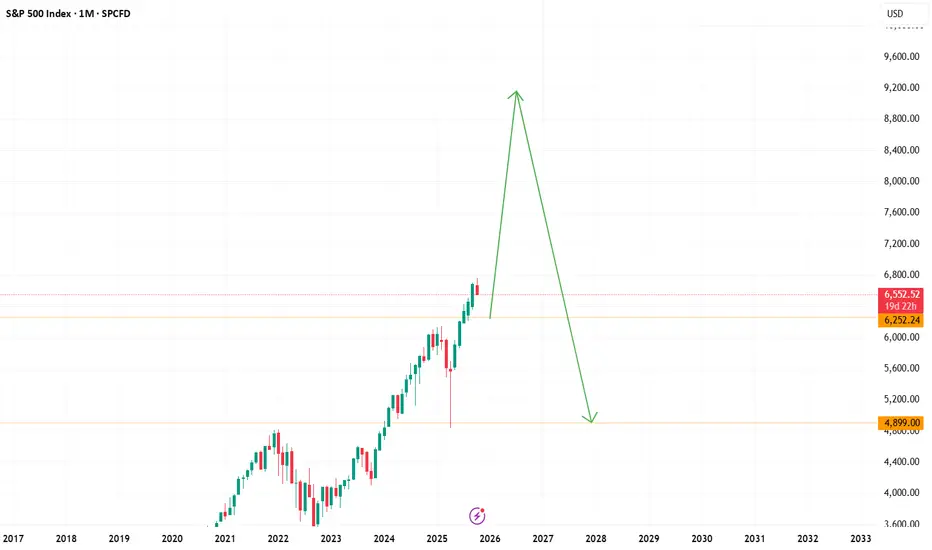
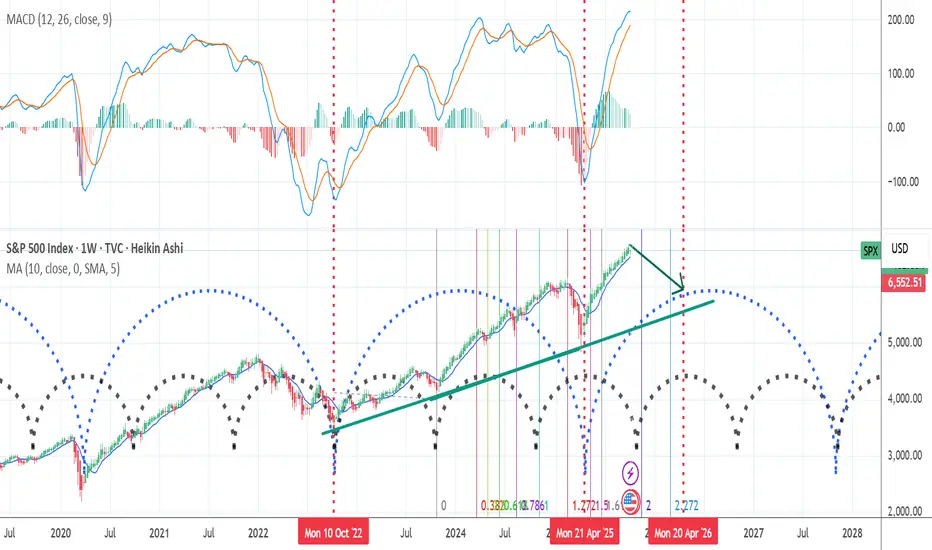
Bigger Market Correction ahead??? We can see a bigger correction in markets???
Its a nice probability. Its that happened could be a great opportunity to longs entry before we can see a new leg up in markets until the Q2-Q3 2026 for the end of 5 or 6 years current liquidity cycle .
Then we can spect the beggining of the bigger bear market that we ever see in our times. (nobody know's)
This its not finantial advice, just a trading idea for entertaiment and educational porpuose, dont follow this idea! Keep your owns idea in play , do your own reaserch and manage properly your money. The markets have bigger risks escenarios right now.

S&P 500 - GRAND MARKET OUTLOOKS&P 500 - GRAND MARKET OUTLOOK BY FIBCOS
This analysis integrates multiple layers of market interpretation, combining Elliott Wave Theory across Supercycle , Macro , Micro , and Sub-Micro degrees with Smart Money Concepts (SMC) , price action behavior, and Fibonacci retracements/extensions to project the S&P 500 ’s long-term trajectory. It captures how institutional capital rotates through accumulation and distribution phases, aligned with macroeconomic cycles, policy shifts, and investor sentiment. Each wave is grounded in historical and forward-looking fundamental events—from post-war booms to financial crises to the current AI-driven tech surge. The use of Fibonacci ratios (1.618, 3.618, 5.618) provides mathematical confluence for wave targets, while price structure confirms the ongoing impulsive behavior. Altogether, it creates a cohesive, multi-dimensional forecast expected to culminate in a Supercycle Wave (III) top around Q1 2029 , with an S&P 500 target between 20,000(20K).
🌀 Supercycle Wave (III) — The Final Ascent (1942–2029*)
🌍 SUPERCYCLE STRUCTURE: The Multi-Generational Bull
We are inside Supercycle Wave (III) which began in 1942 and is unfolding in 5 Macro Impulse Waves . Each of these macro waves has further Micro and Sub-Micro waves. As of 2025, we're in the final stretch of this grand cycle, specifically:
👉 Sub-Micro Wave ③ of Micro Wave ⑤ of Macro Wave ⑤ of Supercycle Wave (III)
Final top expected in Q1 2029 , around the 20,000 (20K) zone 📍
🧭 MACRO WAVE TIMELINE (Supercycle III)
🔹 Macro Wave ① (1942–1968): 🌟 Post-War Industrial Renaissance
Fundamentals:
WWII victory → economic dominance
Baby boom, suburbanization, auto and housing expansion
Bretton Woods system established USD supremacy 💵
Smart Money Insight:
Institutional capital rotated from war manufacturing into consumer goods, construction, and tech foundations
Price Action: Strong impulsive move with clean higher highs/lows
Fibonacci Insight: Laid the base for 1.618 extension targets
Ends in 1968 with rising inflation and Vietnam drag
🔹 Macro Wave ② (1968–1974): 🌪️ Stagflation Storm
Fundamentals:
Vietnam War expenditures
Gold standard broken (1971 Nixon shock)
Oil embargo, inflation > growth
Price Action: Deep correction, volatile chop, broad distribution
SMC Insight: Institutions exited cyclicals, quietly accumulated future outperformers (tech, defense)
Fibonacci: 0.236% retracement of Super Cycle Wave ii
🔹 Macro Wave ③ (1974–2000): 🚀 Tech & Financialization Explosion
Fundamentals:
Reaganomics & deregulation
PC revolution, Internet birth, globalization 🌐
Explosion in derivatives, S&P futures, ETFs
SMC: Institutions accumulated during 70s lows, fueled tech IPO boom (Apple, Microsoft)
Price Action: Violent rallies with accelerating slope — classic 3rd wave behavior
Fibonacci: Extended well beyond 4.618% of Macro ① & ② — true power wave
🔹 Macro Wave ④ (2000–2009): 🌊 Dot-Com + Financial Crisis Correction
Fundamentals:
Dot-Com bust ➜ $5T in lost value
9/11 shocks & Iraq war
GFC: Housing bubble → global banking collapse
Price Action: Double top structure (2000 & 2007), multi-leg correction
SMC Insight: Smart money cashed out in 2000 and 2007; bought again heavily in March 2009
Structure: WXY complex correction, bottoming with V-shape GFC recovery
Fibonacci: 0.236% retracement of Macro ②
🔶 MACRO WAVE ⑤ (2009–2029): 🔥 The Final Ascent – AI, Liquidity & Euphoria
This is the final macro wave of Supercycle (III), and it subdivides into 5 Micro Impulse Waves.
We are now in Micro Wave ⑤ , which itself contains Sub-Micro Waves 1–5.
🔷 Micro Wave ① (2009–Apr 2010): 🪙 The Bounce from Oblivion
Fundamentals:
Fed QE1 💉, bailouts (TARP), 0% rates
Fear of deflation flipped to hunt for yield
Price Action: Clean V-bottom, shallow pullbacks
SMC: Institutions were loading REITs, tech, and banks post-GFC carnage
🔷 Micro Wave ② (Apr 2010–Jun 2010): 🩻 Flash Crash Flush
Fundamentals:
Euro debt scare, Greece bailout, volatility spike
Price Action: Sharp correction, liquidity vacuum
Fibonacci: Textbook 0.236% retracement
SMC: Stop hunt phase — liquidity grab before next leg
🔷 Micro Wave ③ (Jun 2010–2018): 🚀 Passive Investing Boom
Fundamentals:
QE2, QE3 → massive central bank asset inflation
Apple, Amazon, Google explode in earnings and valuation
ETF revolution = automated capital flows
Price Action: Relentless trend with low volatility
Fibonacci: 2.618+ extension of Wave ①
SMC: Institutions began multi-year hold strategies (FANGM), volatility sellers emerged
🔷 Micro Wave ④ (2018–2020): ⚠️ Volatility & COVID Shock
Fundamentals:
Rate hikes (2018), trade war (US-China)
COVID black swan — global shutdown, crude oil collapse (went negative!)
Price Action: Massive drop with record velocity (VIX > 80)
SMC: Panic selling, smart money accumulation March 2020
🔵 MICRO WAVE ⑤ (2020–2029): 📈 The Final Climb Begins
This is where we are now. This Micro Wave ⑤ is subdividing into:
🟢 Sub-Micro Wave ① (Mar 2020 – Nov 2021): 💹 Stimulus Mania
Fundamentals:
Unlimited QE, COVID relief checks
Crypto/NFT mania, meme stocks (GME/AMC)
Retail explosion via Robinhood & Reddit
Price Action: Parabolic rally, overbought signals
SMC: Institutions faded retail euphoria mid-2021
🟡 Sub-Micro Wave ② (Nov 2021 – Oct 2022): 🔻 Inflation Reckoning
Fundamentals:
CPI > 9%, Fed hikes aggressively
Yield curve inversion, tech meltdown
Price Action: 0.236% retracement
SMC: Smart money rotated into energy, defense, and value stocks during panic
Sentiment : Retail fled, fear extreme — perfect accumulation zone
🔴 Sub-Micro Wave ③ (Oct 2022 – Est. 2027): ⚡ AI Supercycle Ignites
CURRENT WAVE IN PROGRESS
Fundamentals:
AI revolution (ChatGPT, LLMs, Robotics, Automation)
Cloud, semiconductors, defense, biotech surge
Fiscal policy dominance, wars & tech race 🧠
Price Action:
Clean impulse structure
Shallow pullbacks, breakout-retest continuation
SMC:
Institutions aggressively long AI/Defense (Nvidia, Palantir, defense contractors)
Liquidity injections in dips, stealth breakouts
Fibonacci Target: 3.618 extension ~11,200
Expected to peak in 2026
🟠 Sub-Micro Wave ④ (Est. 2027-2028): 🧯 Last Shakeout Before the Climax
Expect:
Profit-taking, geopolitical panic, credit stress
Retest of broken trendline or previous resistance zone
Fibonacci : Retrace 0.236–0.382 of Wave ③
SMC: Final accumulation before blow-off top
🔵 Sub-Micro Wave ⑤ (Est. 2028–Q1 2029): 🚨 Blow-Off Top: 20,000 Target
Fundamentals:
Peak optimism: “AI replaces everything”, euphoria
Retail mania, influencer ETFs
Fed/central banks possibly easing again to avoid slowdown
Price Action: Parabolic, low pullbacks, extreme momentum, RSI divergence, volume climax
SMC: Massive institutional distribution — quiet selling into strength
Target: ~20,000 (5.618 of Wave ①), final top of Supercycle (III)
🛑 What Comes After? SUPERCYCLE WAVE (IV): 🔻 Decade-Long Reset (2029–2040?)
Major correction, potentially multi-decade sideways or secular bear
Catalyst? AI bust, geopolitical war, credit collapse
"Stay focused on structure, not emotions." - FIBCOS
📘 Disclaimer: This is a structural, educational market outlook. Not financial advice. Please do your own due diligence and risk management.
#FIBCOS #ElliottWave #SmartMoneyConcept #MarketAnalysis #Gold #XAUUSD #ElliottWave #WaveTheory #SuperCycle #MacroTrend #SmartMoney #Fibonacci #PriceAction #Commodities #TechnicalAnalysis #LongTermOutlook

SPX Technical Levels to watchSPX (S&P 500) Technical Levels Quick Breakdown
Current Price: 6,552.51 (as of Oct 10, 2025 close, down 2.71%; futures suggest mild rebound at Oct 11 open).
Key Levels (Classic Pivots):
Support: S1 $6,576 | S2 $6,562 (watch for breakdown below S2 toward $6,500).
Resistance: R1 $6,613 | R2 $6,637 (clearing R1 eyes $6,700 round number).
Pivot: $6,600 (neutral gravity point).
Key Indicators (Daily Timeframe):
RSI(14): 18.6 (deeply oversold—potential bounce setup above 30).
MACD(12,26): -34.8 (strong sell signal, bearish momentum).
Moving Averages: All sell (e.g., 5-day SMA $6,602; 50-day $6,717; 200-day $6,619—price well below, confirming downtrend).
Overall: Strong sell across MAs and indicators, but oversold RSI flags exhaustion risk for a relief rally. Watch volume on any upside push.
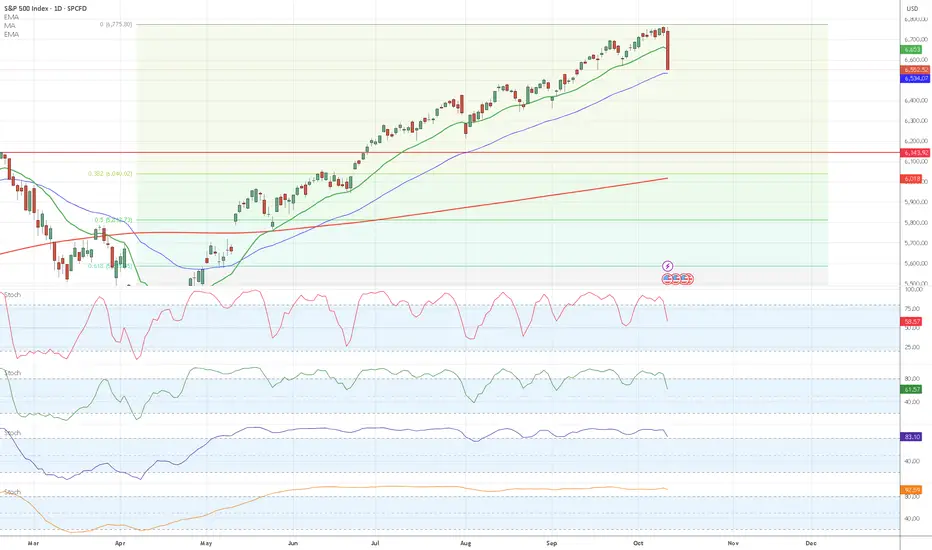
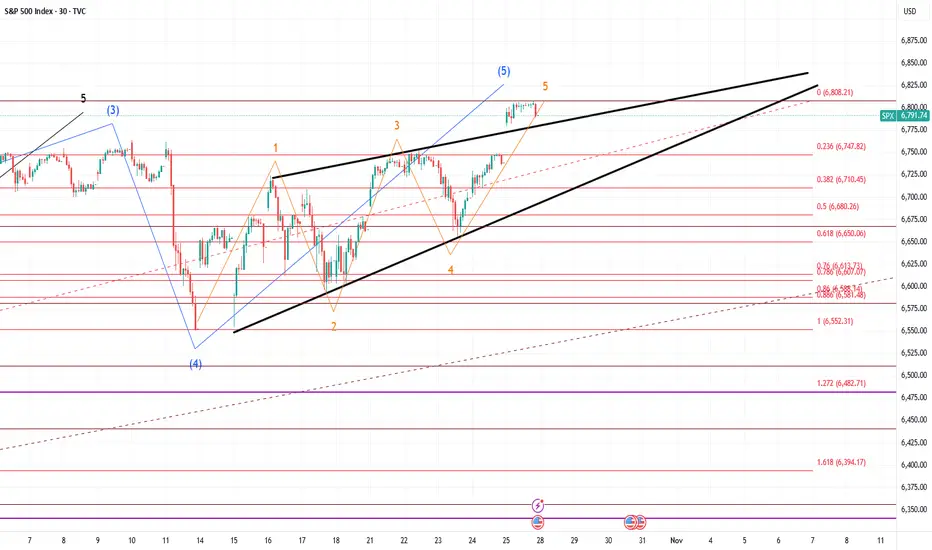
Bigger correction down for SPX500USDHi traders,
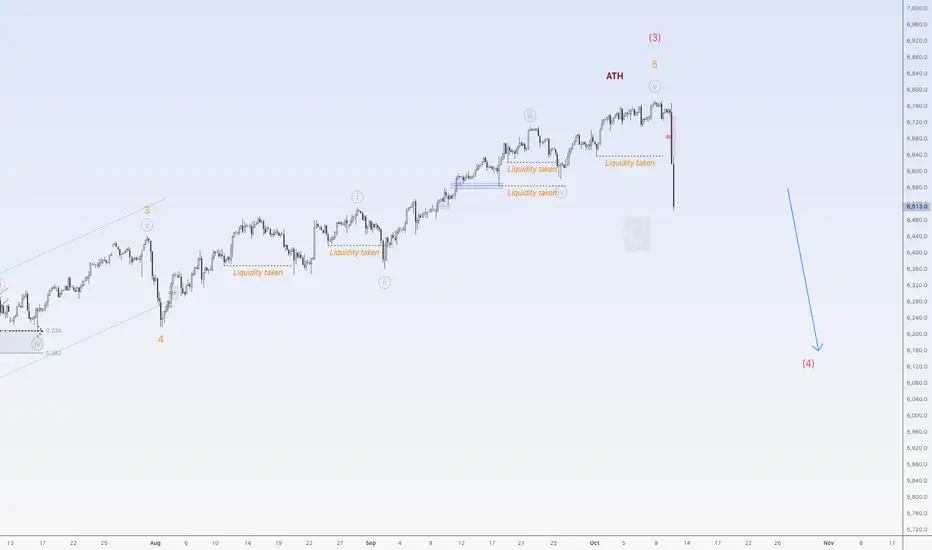
I called the top in my outlook of last week for SPX500USD.
After a small correction last week it went up one more time to make a new ATH. After that it dropped.
Now it started the bigger correction down.
So next week we could see a correction up and more downside for this pair.
Let's see what the market does and react.
Trade idea: Wait for a correction up and a change in orderflow to bearish on a lower timeframe to trade shorts.
If you want to learn more about trading FVG's & liquidity sweeps with Elliott wavecount and patterns, then please make sure to follow me.
This shared post is only my point of view on what could be the next move in this pair based on my technical analysis.
Don't be emotional, just trade your plan!
Eduwave
SPX : How to play this DPrice has now reached our target as anticipated. The question is, when do we SELL?
Anyway, for those who follow the D, I am sure it has saved you guys a lot of trouble. At least you know where/when to start SELLING. Many others who started selling EARLy had all lost their money.
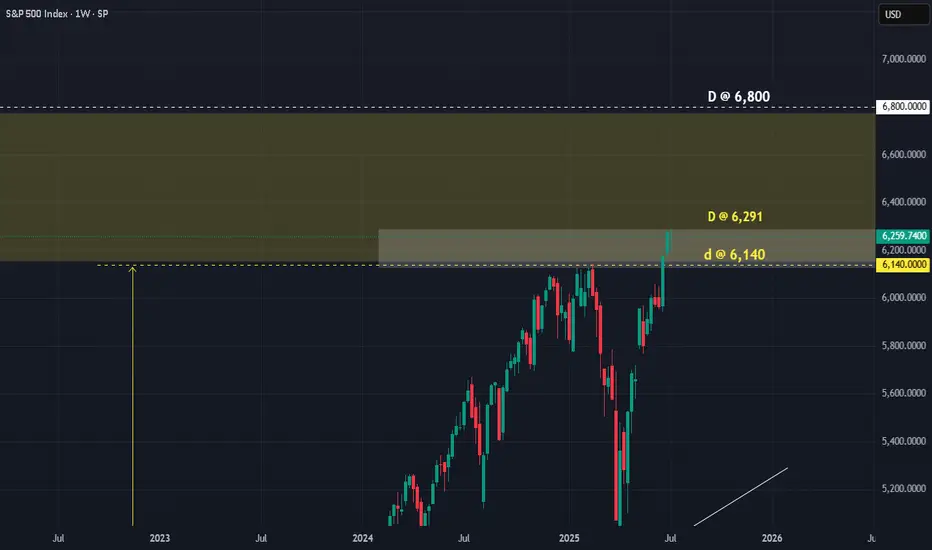
As we can see, there are 3 D's. Price can still move UP to 6,800. Bear that in mind. Or has already reached the max at 6,291!!!
Price is at where they are, there are 2 choices:
a) SELL now and SL @ 6,300
b) SELL when price touched the lower D @ 6,140 with SL @ 6,291
Whichever way, the R/R is still FANTASTIC.
It is true that MARKET MAKER might still take advantage and try to screw short sellers. But even they would find it hard at the D. For even they need to respect it a bit.
If you know your D, you trade safer.
Good luck.
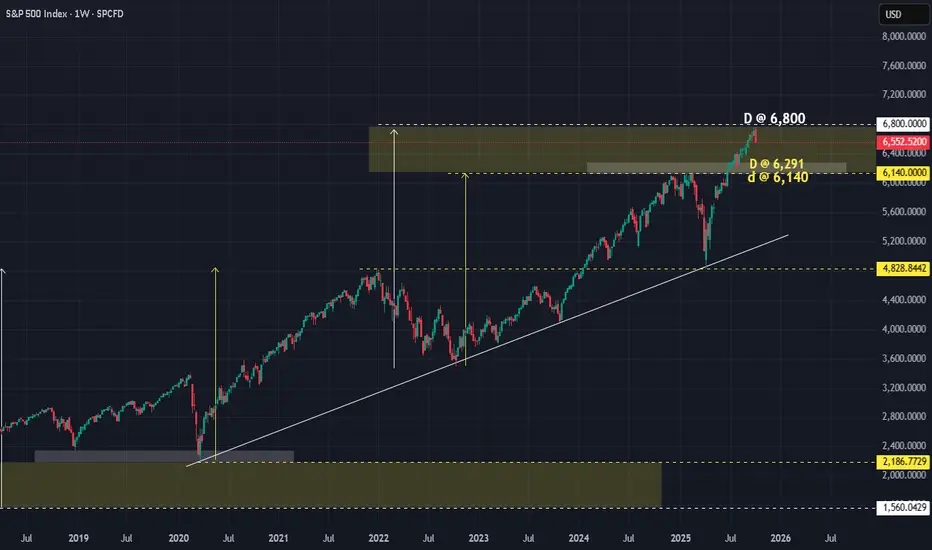
SPX : Remember what I wrote on 14 Jul 2025Long ago, I put up this chart.
Thanks to Trump, it is finally a reality.
Price has nowhere else to go but DOWN.
This is the kind of MONEY you can make by being patient.
Good luck.
DJI and SPX ---- ;-)
[VNFORECASTER][SPX] The price action of SPX in next cycle The price action of SPX in next cycle on Oct 11, 2025
The price action of SPX index can go down quickly.
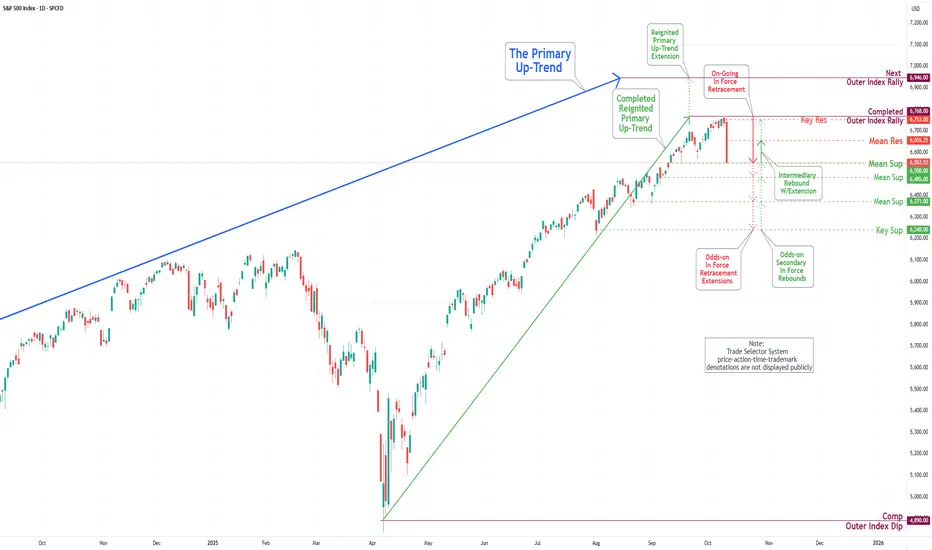
S&P 500 Daily Chart Analysis For Week of Oct 10, 2025Technical Analysis and Outlook:
During the previous week's trading session, the S&P 500 Index experienced a notable decline in price activity after reaching the Key Resistance level of 6750 and the Outer Index Rally at 6946.
At present, the index is positioned just above the newly established Mean Support level of 6550, which indicates the potential for further downward momentum. This trend could extend to subsequent Mean Support levels of 6485, 6371, and the Key Support level at 6240.
It is imperative to recognize that the index may exhibit a strong rebound following its price contact at the Mean Support level of 6550. Furthermore, there exists the possibility of an upward extension that could reach the Key Resistance target of 6753.
Global Market Time Zone ArbitrageExploiting Temporal Gaps in Financial Trading.
Introduction
In the world of finance, time is money—literally. Global markets operate across multiple time zones, from Tokyo to London to New York, creating a continuous 24-hour trading cycle. This nonstop nature of global finance gives rise to an intriguing phenomenon known as “time zone arbitrage.” It refers to the opportunity traders have to profit from differences in asset prices across markets that open and close at different times. These discrepancies often occur due to variations in liquidity, news flow, investor sentiment, and economic data releases.
While traditional arbitrage exploits price differences between identical assets in different locations or exchanges, time zone arbitrage takes advantage of temporal inefficiencies—how the same information is priced differently at different times of day across the globe. Understanding this concept requires a grasp of market interconnections, regional behaviors, and how global events ripple through the timeline of financial markets.
1. The 24-Hour Trading Clock
Global financial markets never sleep. When the Asian markets wind down, Europe takes over, followed by the U.S. sessions, which eventually hand back momentum to Asia. This rotation ensures that trading activity continues around the clock, covering key financial hubs:
Region Major Markets Trading Hours (GMT) Overlap With
Asia-Pacific Tokyo, Hong Kong, Singapore 00:00 – 08:00 Europe (partial)
Europe London, Frankfurt, Paris 07:00 – 15:30 Asia (early), U.S. (midday)
North America New York, Chicago 12:00 – 21:00 Europe (early)
The overlapping hours, especially between London and New York, see the highest liquidity and volatility. However, when one market closes and another opens, temporary inefficiencies can occur. These are the breeding grounds for time zone arbitrage opportunities.
2. Defining Time Zone Arbitrage
Time zone arbitrage is a strategy that seeks to profit from price differences created by timing gaps between global markets. For instance, when an event occurs after the close of one market but before another opens, the latter reacts first. Traders anticipating how the closed market will respond once it opens can position themselves ahead of that reaction.
Example:
Suppose a major tech company listed on both the New York Stock Exchange (NYSE) and the Tokyo Stock Exchange (TSE) releases strong earnings after NYSE closes. The Tokyo market opens several hours later and reacts immediately to the news, pushing prices higher. A savvy trader could buy shares in Japan and later sell in New York when it opens, assuming the NYSE-listed shares will follow the same upward adjustment.
This approach doesn’t involve “insider information”—it’s about acting faster within a global time structure.
3. The Mechanisms Behind Time Zone Arbitrage
a. Information Lag
Financial information doesn’t reach all investors at the same time. Even though digital news travels instantly, the interpretation and pricing of that information vary across regions.
Asian traders may react differently to U.S. Federal Reserve comments than their European counterparts.
Markets that close early might “miss” a late-breaking development, creating temporary mispricing.
b. Fund Valuation Delays
Mutual funds, ETFs, and index funds in certain markets are priced based on closing prices, which creates valuation lags. For example, U.S. mutual funds investing in Asian equities may value their holdings at stale prices, ignoring overnight moves in Asian markets. Arbitrageurs can exploit this discrepancy through stale price arbitrage, a form of time zone arbitrage.
c. Cross-Listed Securities
When the same company’s stock trades on multiple exchanges (e.g., London and New York), time zone differences can create arbitrage windows. Traders monitor price deviations and use derivatives or foreign exchange tools to hedge risk while exploiting temporary inconsistencies.
d. Currency Influence
Because cross-border trading involves multiple currencies, forex market movements play a critical role in time zone arbitrage. Exchange rates fluctuate continuously, impacting how international assets are priced in local currencies.
4. Real-World Examples of Time Zone Arbitrage
i. Japan-U.S. Market Arbitrage
When Wall Street closes, the Nikkei often reacts to the S&P 500’s performance overnight. Traders who anticipate these reactions can use index futures to capitalize on correlations between the two.
ii. Asian ETFs in U.S. Markets
Many U.S.-listed ETFs (like the iShares MSCI Japan ETF) track Asian indices. However, when the U.S. market opens, Asian exchanges are closed. If U.S. traders expect the Asian market to open higher the next day (based on global cues), they can buy the ETF in anticipation—earning profits when the ETF’s price aligns after Asia opens.
iii. Currency Futures
Currency markets, particularly USD/JPY or EUR/USD, exhibit strong correlations with regional stock markets. Traders use these as time-zone proxies, trading currencies in one time zone to predict or hedge equity movements in another.
iv. Gold and Commodities
Commodities like gold trade continuously across exchanges, but price adjustments often occur in waves. If Asian demand pushes gold higher overnight, U.S. traders can anticipate a catch-up rally during their session.
5. Institutional Exploitation and Algorithmic Trading
Modern arbitrage has largely become the domain of institutions equipped with algorithmic trading systems. High-frequency trading (HFT) algorithms scan multiple markets, currencies, and time zones to detect fleeting inefficiencies.
Key techniques include:
Latency Arbitrage: Exploiting milliseconds of delay between data feeds from exchanges in different time zones.
Cross-Exchange Hedging: Simultaneously buying in one market and selling in another as prices converge.
AI-Powered Prediction Models: Using sentiment analysis and global event tracking to forecast market reactions in different time zones.
Because these opportunities exist for only seconds to minutes, manual traders rarely succeed without advanced technology.
6. Risks and Limitations
Despite its appeal, time zone arbitrage isn’t without challenges:
a. Execution Risk
Price discrepancies may vanish before the trade is executed, especially in high-frequency environments. Latency and order execution speed are critical.
b. Currency Risk
Cross-border transactions expose traders to exchange rate volatility. A profitable price move could be offset by an unfavorable currency fluctuation.
c. Transaction Costs
Commissions, spreads, and taxes can erode the small profit margins typical in arbitrage strategies. Institutions often rely on large volumes to make such trades worthwhile.
d. Market Correlations
With globalization, asset correlations have increased, reducing inefficiencies. Arbitrage opportunities are rarer and shorter-lived.
e. Regulatory Barriers
Different countries have distinct trading regulations, taxes, and capital controls. Navigating these legal frameworks requires compliance expertise.
7. Time Zone Arbitrage in Different Asset Classes
a. Equities
Cross-listed stocks and ETFs provide the most direct time-zone arbitrage routes. Example: ADRs (American Depository Receipts) and their foreign counterparts often show price mismatches.
b. Bonds
Fixed-income markets move slower but still present opportunities. Global bond ETFs can react late to sovereign yield changes, creating short-term valuation gaps.
c. Currencies
Forex markets operate 24/7, making them the backbone of time zone arbitrage. Traders use currency pairs as early indicators for equity and commodity moves.
d. Commodities
Oil, gold, and copper often see price leadership shifts between Asia, Europe, and the U.S. as regional demand and supply updates roll out.
e. Cryptocurrencies
Crypto markets are open 24/7, yet time-zone trading patterns persist due to regional investor behavior. Asian sessions often set the tone for early momentum, while U.S. traders influence volatility later in the day.
8. Case Study: The Asia–U.S. Price Reaction Cycle
Consider a simplified chain reaction:
U.S. closes higher on positive economic data.
Asian markets open hours later and react to the U.S. optimism by rallying.
European markets open next, digesting both U.S. and Asian sessions, adding or adjusting momentum.
The U.S. reopens, responding to global sentiment formed overnight.
Traders who understand this cyclical information flow can position themselves to profit. For instance, buying Asian index futures before the open after a strong U.S. session often yields short-term gains—an example of inter-temporal correlation arbitrage.
9. The Future of Time Zone Arbitrage
Technological advancement is both a blessing and a curse for arbitrageurs. On one hand, machine learning and big data analytics enhance detection of global mispricings. On the other, automation has drastically reduced the lifespan of opportunities.
Emerging technologies shaping the future include:
Quantum computing for ultra-fast data analysis.
AI-driven sentiment analysis tracking news flow across time zones.
Decentralized trading platforms reducing latency barriers.
Moreover, as financial institutions seek a “follow-the-sun” trading model, with teams operating in shifts across continents, time zone arbitrage could evolve into real-time global arbitrage networks.
10. Conclusion
Time zone arbitrage stands as a testament to the interconnectedness of modern finance. It reveals how geography and time, despite technological progress, still shape global asset pricing. By leveraging differences in market hours, traders exploit short-lived inefficiencies caused by delayed reactions to information.
However, succeeding in this space requires precision, speed, and understanding of cross-market correlations. What began as a manual strategy has now evolved into a highly automated, algorithm-driven endeavor dominated by institutions.
In essence, time zone arbitrage is the art of turning time itself into a tradable asset—where every second counts, and every sunrise in Tokyo or sunset in New York opens a new chapter of global opportunity.
THE NEXT MOVE WILL BE PARABOLIC! CRYPTO GOING TO FOLLOW!We are in a bubble phase, the next move will be big until start of Q2 2026.

A healthy consolidation should dip lowerA healthy consolidation should dip lower (around $6,648 or even better $6,000) before bouncing.
But will the billionaires manipulating this market have the patience — or will they fire their money into the air too soon?
Hopefully, we get a deeper correction for a solid long setup by the end of the week and a strong rebound next week.
Patience is key. 🕒
This is the END(ing diagonal)The ending diagonal has formed. If you check RSI you will see a double daily and fresh WEEKLY divergence. It will crash hard next week. 6480 is the first target, but it can be just a bounce area. 1.618 level from low to top of the diagonal is at 6400 level on SPX and at 6300 level on US500 - I think we can get a flash-crash into this area next week. And if this is a reversal, it can trend down to February peak and lower according to fibs.
REVEALED: What REAL Trading isWhat is Financial Trading in a nutshell?
For the last 20 years I’ve summed up trading as just ONE BIG AUCTION.
It sounds like a fast-paced, high-risk, Wall Street movie scene with shouting brokers and skyrocketing graphs.
But, here’s the truth:
Trading is the most relaxing thing – when done right!
It’s a lifestyle, a process, and a mindset.
It’s one thing where YOU can take your finances on an exciting adventure — if you do it right.
Whether you’re a complete newbie or a seasoned trader, here is a refresher to dive into what trading really is.
Trading Is More Than Just an Auction of buying or selling…
Let’s clear up one thing first.
For the last 20 years I’ve summed up trading as just ONE BIG AUCTION.
And yes it is one big market of buying and selling – but that’s only part of it.
TRADING is all about solving a puzzle of analyzing probabilities, managing risks, and navigating uncertainty.
Every time you enter a trade (buy or sell), you’re making an educated guess on where the market is LIKELY to go next.
And you’re placing a bet on human behavior — how millions of people around the world (with their emotions, news reactions, and strategies) will affect the price of an asset.
That’s the technical side of trading. Here’s where I want you to integrate trading into your life…
Trading Is A Lifestyle
It’s not just about making money — it’s about integrating trading into your lifestyle.
You need to find the right markets, time, time frame, styles, strategy and approach.
Trading is like hitting the gym; it requires discipline, consistency, and a whole lot of sweat equity.
And just like you don’t get a six-pack or lose weight after ONE workout.
You shouldn’t expect to master trading overnight.
It’s a routine you build day by day.
A typical trading day might include:
Pre-market analysis (Weekly bias):
You need to check what’s happening in the world with other markets with both Asian, American, European and even London session.
You also need to look at the US Economic Calendar to see what news is arising for the week.
Analyse and Execute trades:
Once done the pre analysis, you need to do the actual analysis. See what trades are lining up according to your proven strategy. And if anything looks good to go EXECUTE.
Review and track your trades:
This is where you will reflect on what went right and what went wrong. This is where you’ll track and review your trades that lined up to add to your journal.
The key takeaway: Trading isn’t just what you do; it’s who you become.
Trading Is a Forever Game
When it comes to trading, think long-term.
Like, REALLY long-term. Because trading is a forever game.
Unlike sports with seasons or video games with levels, trading doesn’t end.
The markets will be there tomorrow, next week, and 100 years from now.
And as a trader, your mission is to stay in the game for the long haul.
That means managing your risk, protecting your capital, and always looking to improve your skills.
Trading Is A Business Where YOU Are The Boss
The beauty of trading?
You’re in control.
Trading is a business, and you are the CEO.
You call the shots, decide when to enter and exit trades, and ultimately, you take control of your financial destiny.
Like any business, trading requires:
Planning and strategy:
Risk and reward management:
Tracking performance and improving:
And, just like in any business, you’ll make mistakes.
But those mistakes are not failures; they’re lessons.
You learn from them, adapt, and get better. That’s what makes trading such an empowering journey.
Final Words:
Financial trading is more than a job, a hobby, or a side hustle.
It’s a process-driven approach to decision-making, a lifestyle to live, a forever game to play, and a business where you’re in charge.
If done right, trading can be one of the most rewarding pursuits you’ll ever undertake.
Key Takeaways
Trading is a process: Follow a set strategy, criteria, and rules for success.
Trading is a lifestyle: Incorporate trading into your daily routine and stick with it consistently.
Trading is a forever game: It’s not a one-time event; it’s a lifelong pursuit.
Trading is a business: You’re the CEO — plan your moves, manage your risk, and take charge of your financial destiny.

The Real 3 Thrills of Trading: (Hint: It’s Not When You Think)Trading.
It’s a game.
A challenge.
A journey.
It’s a lifestyle.
And yes having a passion to trade is half the battle won.
But it’s not just about winning.
If you feel thrill when you win a trade. Then you’re enjoying the wrong parts of successful trading.
If you’re in a winning streak and feel thrill – Same story.
Because you know the losses are inevitable.
And you know the drawdown is coming too.
So that’s why you need to enjoy the FULL journey…
And here’s where you should feel the THRILL for trading.
THRILL #1: When you survive the drawdown
Like I said earlier, your next drawdown is coming.
Your BIGGEST drawdown is coming.
So you need to embrace and prepare for these times.
I have gone through more drawdowns than you can imagine.
And yet my portfolio keeps heading to all time highs.
HOW?
Well you need to endure the drawdown.
You need to keep following your rules and strategy.
And when the market environment is more favourable, your portfolio will turn from down to up.
And it will continue to go up until you not only recover – but your portfolio breaks to all time highs.
And when you survive the drawdown – FEEL THRILL!
THRILL #2: Knowing your strategy works (through the good and bad)
The markets are like an ocean.
Waves come and go, the tide shifts, and sometimes there’s a storm.
If you go look at the US Economic Calendar you’ll know the market is about to swivel in ways you can’t even imagine!
The thrill doesn’t come from riding one good wave (winner).
It should come from taking every trade that lines up perfectly with the strategy.
If you followed your rule and criteria to a T – Feel THRILL that you are on the right path to success.
Regardless of whether the trade is a winner or a loser.
See the bigger picture and what it can do for you!
THRILL #3: The Love for the Game and the benefits of trading
Remember I said trading is more than just money.
Trading helps with everything in your life!
It teaches you to be a risk manager.
It teaches you how to toughen your mind.
It teaches you how to be disciplined, consistent.
And it teaches you how you can CREATE your own wealth without depending on a BOSS.
The Challenge, the Mental Toughness, and the Growth
And the thrill?
FINAL WORDS – Celebrate the Right Thrills
The thrill of trading isn’t about the quick wins, the big gains, or riding the market waves.
It’s about resilience. Mastery. Passion. Patience. And growth.
Well fall in love with what trading has offered and taught you, other than the money aspect.
It’s not just about making money; it’s about becoming better. Sharper. Wiser.
Every trade you take is a lesson.
Every loss is a learning opportunity.
And every time you wake up excited to face the market, that’s the thrill of passion.
Because trading isn’t just a job.
It’s a craft.
A skill.
A calling.
If you find yourself waking up early, excited to start your day, knowing full well there’s a challenge waiting for you—you’ve found the thrill.
If you find weekends are not ending early enough because you want to trade – that’s a thrill!
Let’s sum up some reasons to feel THRILL when trading.
THRILL #1: When you survive the drawdown
THRILL #2: Knowing your strategy works (through the good and bad)
THRILL #3: The Love for the Game and the benefits of trading
Do you agree and how has trading changed your life?
WHY Financial Markets Will Always ChangeChange is the only constant in the financial markets.
And that’s why it’s important to stay humble and grounded because everyday is a UNIQUE day to the markets and the pre market movers.
No matter how much experience you have, you can’t get too comfortable with the way things are.
Because we know they won’t stay that way for long.
The markets are like a living, breathing entity—constantly shifting, evolving, and transforming.
And now I want to explain why I believe the markets are ALWAYS changing.
REASON #1: The Fresh Faces of Trading
Continuous flow of new and old traders.
Every day, new traders enter the game while seasoned veterans continue to play.
This constant influx of fresh perspectives creates a dynamic market environment.
New traders bring innovative strategies, emotions, and decision-making processes into the market, while the veterans tweak their systems to keep up with ever-evolving trends.
And so the demand and supply is constantly shifting in new ways – which changes the markets style, moves and algorithms.
End of the day, the market is one big AUCTION as I have told my members for the last 15 years.
They’re influenced by the people who trade in them.
REASON #2: The Never-Ending Stream of New Information
New information – shining on the market
Here’s the thing: the financial markets thrive on information.
New data points, news reports, earnings releases, and economic indicators flow in non-stop, impacting prices and trends at every turn.
Sometimes there is good days with amazing news coming out.
Other days there is catastrophic news.
And then you get the mundane boring days with no reaction.
If a central bank announces an unexpected interest rate cut, or if a company releases disappointing earnings, the market is going to react swiftly.
Even geopolitical events and natural disasters play their part in shaping the direction of markets.
So no matter how much analysis you’ve done, be prepared for the fact that new info can change the game in an instant.
REASON #3: Micro, Macro, and Inner Fundamentals
New micro, macro and inner fundamentals
The fundamentals that underpin market movements are far from static.
On the micro level, individual companies are constantly evolving.
New product launches
Mergers and acquisitions
News and earning reports
Prospects
Leadership changes can all affect a stock’s price.
Zoom out a little, and you’ve got macro fundamentals.
These show the big-picture factors like:
Interest rates
inflation, and
unemployment rates,
All of which influence the broader economy.
REASON #4: Global Economies and World Events
World info from the economies
The financial markets are more interconnected than ever.
What happens in one part of the world now ripples through the rest of the global economy in minutes, not weeks.
A change in China’s trade policy can directly impact European markets.
An unexpected election result in America could influence the South African or UK equities.
REASON #5: The Endless Actions of Traders
Constant actions of traders around the world
Then, of course, we have the daily actions of traders around the world.
Every time a buy or sell order is placed, the market shifts.
I like to think of it as the Stock Market’s Butterfly-Effect.
These actions are a direct result of human behavior—our emotions, analysis, strategies, and even fear and greed.
When traders believe in a trend, they pile on, creating momentum.
But when panic strikes, markets can spiral down in a blink of an eye.
Since traders are constantly reacting to new information, the market flows like an ever-shifting river.
Conclusion
The financial markets are in a constant state of flux.
They will forever change and we need to learn how to evolve, adapt or die trying.
But there is one thing that is inevitable.
The markets will KEEP moving and trending. And for that, we will always be profiting in the medium to long term.
Let’s sum up why the markets will always change…
REASON #1: The Fresh Faces of Trading
Continuous flow of new and old traders.
REASON #2: The Never-Ending Stream of New Information
New information – shining on the market
REASON #3: Micro, Macro, and Inner Fundamentals
New micro, macro and inner fundamentals
REASON #4: Global Economies and World Events
World info from the economies
REASON #5: The Endless Actions of Traders
Constant actions of traders around the world
